Original Ar
tic
le
Study conducted at the Voice Laboratory (Laborvox), Pontifícia Universidade Católica de São Paulo – PUC/SP – São Paulo (SP), Brazil, with grants from the Coordenação de Aperfeiçoamento de Pessoal de Nível Superior – CAPES. (1) Graduate Program (Masters degree) in Speech-Language Pathology and Audiology, Pontifícia Universidade Católica de São Paulo – PUC-SP – São Paulo (SP), Brazil.
(2) Pontifícia Universidade Católica de São Paulo – PUC-SP – São Paulo (SP), Brazil.
(3) Undergraduate Program in in Speech-Language Pathology and Audiology, Pontifícia Universidade Católica de Campinas – PUCCamp – Campinas (SP), Brazil.
(4) Departament of Epidemiology of the Public Health School, Universidade de São Paulo – USP – São Paulo (SP), Brazil.
(5) Undergraduate Program in in Speech-Language Pathology and Audiol-ogy, Pontifícia Universidade Católica de São Paulo – PUC-SP – São Paulo (SP), Brazil.
Correspondence address: Sylvia Boechat Coutinho. Av. das Américas, 7935, Grupo 201, Barra da Tijuca, Rio de Janeiro (RJ), Brasil, CEP: 22793-081. E-mail: [email protected]
Received: 7/7/2010; Accepted: 11/22/2010
ethanol and sugar mill
exposed to occupational risks
Sintomas vocais e sensações laríngeas em trabalhadores de
uma usina de álcool e açúcar expostos a riscos ocupacionais
Sylvia Boechat Coutinho1, Ana Claudia Fiorini2, Iára Bittante de Oliveira3, Maria do Rosário Dias de Oliveira
Latorre4, Léslie Piccolotto Ferreira5
ABSTRACT
Purpose: To investigate vocal symptomsand laryngeal sensations among workers of an ethanol and sugar mill exposed to noise and/ or chemical substances. Methods: Participants were 289 workers of an ethanol and sugar mill distributed into ive exposure groups (I – noise; II – noise, oil, grease, petroleum derivatives; III – noise, acids, sulfates, chlorides, nitrates; IV – noise, breathable dust and free crystalline silica; V – oil, grease, petroleum derivatives) and a control group, who answered the questionnaire Conditions of Vocal Production – Teacher adapted to the professional category. The groups were compared regarding vocal symptoms, laryngeal sensations, smoking habits, and exposure to physical and chemical risks. This comparison was conducted using statistical analyses. Results: The most reported vocal symptom and laryngeal sensation were low-pitched voice and cough with phlegm, respectively. Considering the physical risk in the work environment, groups I and IV were the ones that most reported exposure to noise. Because of this exposure, they increase voice intensity (Effect of Lombard-Tarneaud) and, thus, also reported vocal symptoms.Regarding chemical risks in the occupational environment, group IV was the one that most referred presence of dust and smoke, which were composed by breathable dust and silica. Such exposures lead to vocal symptoms and laryngeal sensationsand, consequently, to vo-cal alterations. Conclusion: Vocal symptoms and laryngeal sensations can be related to professional activities where workers are exposed to physical and/or chemical risks.
Keywords: Workers; Voice; Occupational risks; Working environment; Occupational health
INTRODUCTION
Several researches have been developed aiming at eviden-cing the relationship between workers’ vocal complaints and the presence of occupational risk factors, such as noise, chemical
substances, and environmental temperature, among others (1-3).
Such complaints may be translated into symptoms that are sensa-tions associated to phonation, for instance sore throat after long conversations, frequent dry throat and hawking. Furthermore, they may also represent complaints related to voice perceptual characteristics, such as hoarseness and shaky voice(4).
The noise exposure may trigger vocal disorders besides the known hearing problems. Vocal disorders may occur due to an effort to increase voice intensity in order to be unders-tood in an environment with intense background noise. This increase of intensity may be explained by a relex response to noise, since it impedes the listening of one’s own voice, called Lombard-Tarneaud effect(5-9). Hence, the exposure to certain
chemical substances may result in hoarseness, throat irritation, cough, breathing dificulty and mouth irritation, tongue, nose, and respiratory tract tissues(10).
METHODS
A transversal epidemiological study was carried out with ethanol and sugar plant workers of Mato Grosso state (Brazil). All participants were male and hired by the company to work during season and off-season periods for at least one year. They were exposed to noise, noise and chemical substance or only to chemical substance. Workers presenting a second job, with noise and/or chemical substance exposure, were excluded since they could present different vocal symptoms and laryngeal sensations due to an additional effect. The study was approved by the Research Ethics Committee of the Pontifícia Universi-dade Católica de São Paulo – PUC-SP (protocol no 133/2008).
The safety technician of the company designed a list of the sectors and occupations, based on the Environmental Risk Pre-vention Program (ERPP). The number of workers by occupation and exposure to physical (noise) and chemical risks (breathable particles and free crystallized silica; oil, grease, petroleum pro-ducts, acids, sulfates, chlorates, nitrates) was detailed.
Five groups of workers exposed to physical and/or chemi-cal risks and a control group were constituted. Table 1 shows the respective exposure levels to noise, breathable particles and free crystallized silica. According to the ERPP report, oil, grease, petroleum derivate, acids, sulfates, chlorates and nitrates are qualitatively measured, thus the exposure is not expressed in values.
Considering that groups II and III had a lower number of workers, 50 workers were randomly select for each group in order to guarantee size homogeneity of all groups. Workers were selected by a randomized systematic extraction. Workers from each group were ordered according to age and the sample interval was Ni/50, Ni being the total number of workers in
groups I, IV and V. A casual start (a number between 1 and Ni/50) was drafted and, the subsequent workers were
selec-ted. Whenever the participant was no longer in the plant, the following worker was considered.
Likewise, the control group was comprised by 50 partici-pants considered unexposed to noise and chemical substance, since levels were below the tolerance limit.
Among the 294 workers who should have participated in the study, nine were ired: four belonging to group II, one to group III, three to group IV and two to the control group. Workers from groups IV and control were substituted by other ones of the same category. Nevertheless, workers from groups II and III were not replaced once the groups were complete. Thus, group II comprised 40 workers and group III, 49 ones. Furthermore, seven questionnaires were excluded once they belonged to individuals with a second job with noise and/or chemical substance exposure. One belonged to group I, two to group IV, three to group V and one to the control group. These ones were replaced by their peers, that is, workers of the same exposure group. Therefore, data collecting was performed with 289 workers. Table 1 shows the description of the groups with the respective exposure levels.
The questionnaire “Conditions of the Vocal Production – Teacher”, based on the proposal of Ferreira(11), was used
for data collecting. The questionnaire was adapted to the workers’ reality, and presented a detailed questioning about occupational risks.
Before the application of the questionnaire, a pilot study was carried out with ive workers: two agronomists, two workers with specialization in agricultural technology and mechanization and one worker with incomplete elementary school. None of the workers belonged to the control group. In the end of the pilot study, changes and adjustments were made in the questionnaire in order to improve the workers’ understanding.
A worker from the administration sector handed the ques-tionnaires attached to the Informed Consent Term to the mana-gers of each area who handed to the workers. Questionnaires were answered at home, once it was not possible to gather the workers to answer them during working time.
After returning the questionnaires, results were double registered in the Epi-Info software, version 6.04d, for further analysis of data base consistency.
In this study, groups were compared regarding vocal symp-toms and laryngeal sensations, as well as regarding tobacco use and environmental factors (physical and chemical risks). This
Table 1. Description of the research groups and their respective exposure levels
Group Exposure Exposure value Tolerance limit –
NR 15
Number of workers
Number of participants in the study
I Noise 85.6 to 97.1 dB N(A) 85 dB N(A) 303 50
II Noise + oil, grease and
petroleum products 85 to 89.1 dB N(A) 85 dB N(A) 44 40
III Noise + acids, sulfates, chlorate
and nitrates 85.8 dB N(A) 85 dB N(A) 50 49
IV Noise + breathable dust and Free crystallized silica
87.6 to 92.8 dB N(A) 0.1 to 0.5 mg/m3
0.019 to 0.053 mg/m3
85 dB N(A) 63 mg/m3
1 mg/m3
222 50
V Oil, grease e petroleum products 76.3 to 84.5 dB N(A) 85 dB N(A) 104 50
comparison was performed by the association test Chi-squared. The signiicance level considered was p≤0.050.
RESULTS
Table 2 indicates that the most frequently reported vocal symptom was low-pitched voice (n=96; 33.2%), mostly re-ported by group IV (p=0.001). The most frequent laryngeal sensation reported was cough with phlegm (n=63; 21.7%). Group IV also reported hawking more frequently (p=0.001) and group III reported more cough with phlegm (p=0.026), throat secretion/phlegm (p=0.014) and dry throat (p=0.037).
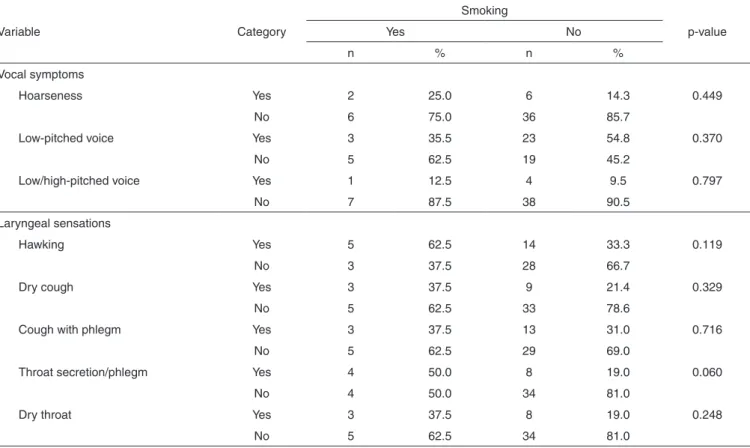
Table 3 shows the smoking habit. The number of smokers is higher in group IV (p=0.013). In group II there are no smokers and the number of ex-smokers is higher in group I (p=0.016). Table 4 shows the association between vocal symptoms, laryngeal sensations and smoking habit only for workers from group IV, since it presented eight smokers while the other groups presented an expected number below ive. There was no statistical relation between these variables, however the laryngeal sensation throat “throat secretion/ phlegm” was close to the signiicance level (p=0.060).
Concerning the physical risks of the working environment (Table 5), groups I and IV reported more noise exposure (p<0.001). For groups I and II, noise comes from their oc-cupation area (p<0.001). Noise was considered strong and annoying for the majority of workers from group I. Most of the workers from groups IV and V reported exposure to dust (p<0.001). Group IV reported smoke (p=0.004). The presence of humidity in the working place was more reported by group I (p<0.001). Finally, the exposure to chemical substances was more reported by group III (p<0.001).
DISCUSSION
Vocal symptoms and laryngeal sensations observed in workers from ethanol and sugar plant were evident and in-dicated possible relations with exposure to physical and/or chemical risks during their professional activities.
The most reported vocal symptom (Table 2) was low-pitched voice, with a greater frequency of occurrence in group IV, exposed to noise and breathable particles and to free crystallized silica. Initially, such fact may be justiied by three possibilities: irst by a gender related matter since the question
Table 2. Distribution of workers (n=289) according to self-report voice symptoms
Self-report voice symptom GI GII GIII GIV GV CG p-value
n % n % n % n % n % n %
Vocal symptoms
Hoarseness 6 12.0 4 10.0 7 14.3 8 16.0 5 10.0 7 14.0 0.937
Low-pitch 20 40.0 11 27.5 19 38.8 26 52.0 7 14.0 13 26.0 0.001*
Low-pitch/High-pitch 10 20.0 7 17.5 5 10.2 5 10.0 2 4.0 5 10.0 0.165
Laryngeal sensations
Hawking 7 14.0 9 22.5 8 16.3 19 38.0 2 4.0 8 16.0 0.001*
Dry cough 7 14.0 6 15.0 15 30.6 12 24.0 7 14.0 7 14.0 0.154
Cough with phlegm 9 18.0 10 25.0 16 32.7 16 32.0 6 12.0 6 12.0 0.026*
Throat with secretion/phlegm 5 10.0 3 7.5 13 26.5 12 24.0 4 8.0 5 10.0 0.014*
Dry throat 11 22.0 7 17.5 16 32.7 11 22.0 3 6.0 13 26.0 0.037*
* Signiicant values (p≤0.05) – Chi-squared test
Note: GI = group exposed to noise only ; GII = group exposed to noise + oil, grease, petroleum. products; GIII = group exposed to noise + acids, sulfates, chlorates, nitrates; GIV = group exposed to noise + breathable dust and free crystallized silica; GV = group exposed to oil, grease, petroleum products only; CG = control group (unexposed)
Table 3. Distribution of workers (n=289) according to smoking habit
Smoking GI GII GIII GIV GV CG p-value
n % n % n % n % n % n %
Present
Yes 2 4.0 0 0 1 2.0 8 16.0 3 6.0 2 4.0
0.013*
No 48 96.0 40 100.0 48 98.0 42 84.0 47 94.0 48 96.0
Past
Yes 16 33.3 11 27.5 6 12.5 7 16.7 4 8.5 7 14.6
0.016*
No 32 66.7 29 72.5 42 87.5 35 83.3 43 91.5 41 85.4
Total 50 100.0 40 100.0 49 100.0 50 100.0 50 100.0 50 100.0
* Signiicant values (p≤0.05) – Chi-squared test
Table 4. Distribution of workers (n=50) from group IV (exposed to noise + breathable dust and free crystallized silica)
Variable Category
Smoking
p-value
Yes No
n % n %
Vocal symptoms
Hoarseness Yes 2 25.0 6 14.3 0.449
No 6 75.0 36 85.7
Low-pitched voice Yes 3 35.5 23 54.8 0.370
No 5 62.5 19 45.2
Low/high-pitched voice Yes 1 12.5 4 9.5 0.797
No 7 87.5 38 90.5
Laryngeal sensations
Hawking Yes 5 62.5 14 33.3 0.119
No 3 37.5 28 66.7
Dry cough Yes 3 37.5 9 21.4 0.329
No 5 62.5 33 78.6
Cough with phlegm Yes 3 37.5 13 31.0 0.716
No 5 62.5 29 69.0
Throat secretion/phlegm Yes 4 50.0 8 19.0 0.060
No 4 50.0 34 81.0
Dry throat Yes 3 37.5 8 19.0 0.248
No 5 62.5 34 81.0
* Signiicant values (p≤0.05) – Chi-squared test
referring to low-pitched voice came just after the question about high-pitched voice; second, by a possible confusion in the deinition of hoarseness and low-pitched voice, once the workers were not keen to voice matters; and third, by the pre-sence of vocal chords edema causing a lower voice pitch(12), by
reducing the length and increasing the mass during vibration. This last possibility may be due to two aspects: because they are workers exposed to breathable particles and free crystalli-zed silica and inhale such substances; or because they belong to the group with higher number of smokers (16%) (Table 3). A possible association between smoking habit and vocal symptoms and laryngeal sensations was investigated (Table 4). The statistical result did not identify a correlation between low-pitched voice and smoking, and therefore, it seems more likely that such symptom in workers from group IV is due to the exposure to breathable particles and free crystallized silica, indicating that this group is at risk for vocal disorder(s). It is important to stress that, in Table 2, group IV mentioned more hoarseness, which may be due to the dificulty to diffe-rentiate between hoarseness and low-pitched voice, or to the presence of vocal chords edema resulting from the exposure to such chemical substances.
According to NR-15, the tolerance limit for silica is 1 mg/ m3. Participants of this research were exposed to silica levels
within the tolerance limit. Such limit is considered safe for an individual not to develop any kind of cancer, such as lung can-cer. However, such limit is probably not safe for the workers not to register vocal chords edema, which may lead to low-pitched voice and hoarseness symptoms. Therefore, vocal symptoms should be valued since they may be indicators of illness.
Regarding the laryngeal sensations (Table 2), group IV mentioned more often the hem sensation which y be justiied by the exposure to breathable particles and free crystallized silica. Analyzing the association between laryngeal sensations and smoking habit in workers from this group (Table 4), the variable throat secretion/ phlegm was close to statistical sig-niicance. Workers from group III, exposed to noise and acids, sulfates, chlorates and nitrates, referred more the presence of dry cough, cough with phlegm, throat secretion/phlegm and dry throat. This inding reinforces the hypothesis that these laryngeal sensations were mentioned because workers are exposed to such chemical substances.
Groups III and IV, exposed to noise and chemical substan-ces, mentioned more the presence of laryngeal sensations. It wasn’t possible to identify whereas those sensations are due to some type of pulmonary disease. Workers exposed to chemi-cal substances have a higher risk to develop several diseases, including respiratory affections. Several respiratory diseases may affect the worker during his professional activity, such as: rhinitis, sinusitis, pharyngitis, laryngitis and asthma, among several ones(13). Researches report respiratory symptoms in
workers exposed to chemical substances (14-17).
In summary, the following symptoms were veriied in this study: low-pitched voice and hoarseness, and laryngeal sen-sation of cough with phlegm, dry throat, dry cough, hawking, and throat secretion/phlegm. In researches performed with metallurgical workers, higher percentages of vocal signs and symptoms of dry throat, pain, or throat irritation, hawking, hoarseness and cough were identiied(2). Another study with
symptoms of hoarseness, throat ache and laryngeal sensation of cough with phlegm (3). Thus, it may be observed that workers
from the ethanol and sugar mill studied made less reference to presence of vocal symptoms and laryngeal sensations when compared to the previous studies.
Concerning the physical risks of the working environment (Table 5), groups I (exposed to noise) and IV (exposed to noise and breathable particles and free crystallized silica) made more reference to noise. Because of the background noise, workers from both groups increase their vocal intensity since they hear their voice less clearly (Lombard-Tarneaud effect)(5-9). Thus, such workers may report more vocal
symp-toms. This fact may also justify the reason why group IV mentioned more low-pitched voice and hoarseness. It was observed that group I was the second group to make more references to the symptom of low-pitched voice.
Most of the workers afirmed that noise comes from the working place where they are inserted. In general, noise was not considered strong and unpleasant. However, group I made more reference to Strong and unpleasant noise. The control group, on the other hand, made less reference to Strong and unpleasant noise. Hence, it may be veriied that indings cha-racterize the research’s group criteria. Literature concerning noise in occupational environment reports that the majority of workers in the metallurgical industry mention such risk (1,2).
Concerning the chemical risk in the working environment (Table 5), it was veriied that workers from group IV, exposed to noise and breathable particles and free crystallized silica, reported more the presence of dust and smoke in the working area. This dust and smoke may be composed by breathable particles and free crystallizes silica. Thus, the exposure to such chemicals may lead to vocal symptoms and laryngeal
Table 5. Distribution of workers (n=289), according to self-reference to environmental factors (physical and chemical risks)
Environmental factors GI GII GIII GIV GV CG p-value
n % n % n % n % n % n %
Physical risks
Noisy area
Always 42 84.0 29 72.5 32 65.3 43 86.0 26 52.0 5 10.0
<0.001*
No/Not always 8 16.0 11 27.5 17 34.7 7 14.0 24 48.0 45 90.0
Place of noise
Working area 44 88.0 36 90.0 37 75.5 24 48.0 24 48.0 8 16.0
<0.001*
Tractor/truck 1 2.0 0 0 2 4.1 16 32.0 13 26.0 9 18.0
Others 2 4.0 0 0 7 14.3 0 0 6 12.0 29 58.0
More than one place 3 6.0 4 10.0 3 6.1 10 20.0 7 14.0 4 8.0
Strong noise
Always 34 68.0 22 55.0 23 46.9 21 42.0 15 30.0 3 6.0
<0.001*
No/Not always 16 32.0 18 45.0 26 53.1 29 58.0 35 70.0 47 94.0
Unpleasant noise
Always 27 54.0 20 50.0 21 42.9 21 42.0 14 28.0 5 10.0
<0.001*
No/Not always 23 46.0 20 50.0 28 57.1 29 58.0 36 72.0 45 90.0
Chemical risks
Presence of dust
Always 21 42.0 22 55.0 15 30.6 45 90.0 30 60.0 11 22.0
<0.001*
No/Not always 29 58.0 18 45.0 34 69.4 5 10.0 20 40.0 39 78.0
Presence of smoke
Always 15 30.0 5 12.5 5 10.2 16 32.0 9 18.0 4 8.0
0.004*
No/Not always 35 70.0 35 87.5 44 89.8 34 68.0 41 82.0 46 92.0
Presence of humidity
Always 16 32.0 6 15.0 3 6.1 7 14.0 3 6.0 0 0
<0.001*
No/Not always 34 68.0 34 85.0 46 93.9 43 86.0 47 94.0 50 100.0
Exposure to chemical products
Always 13 26.0 17 42.5 41 83.7 7 14.0 11 22.0 5 10.0
<0.001*
No/Not always 37 74.0 23 57.5 8 16.3 43 86.0 39 78.0 45 90.0
Total 50 100.0 40 100.0 49 100.0 50 100.0 50 100.0 50 100.0
* Signiicant values (p≤0.05) – Chi-squared test
sensations and, consequently, to voice disorders.
Group V was the second group to make more reference to the presence of dust in the working area. This group is composed by workers exposed to oil, grease and petroleum products. According to the plant safety technician, these petro-leum products are composed by hydrocarbonates. The organic solvent may be subdivided into chemical classes, including hydrocarbonates(18). Therefore, workers from this group are
exposed to organic solvent and may be intoxicated due to the direct contact, by the skin, with such substance. Eyes and upper airway tract are the irst regions of the body to be affected when there is direct or indirect contact with products made of petroleum (19). Therefore, such workers may report laryngeal
sensations due to the presence of respiratory diseases, such as rhinitis, sinusitis, pharyngitis, laryngitis.
Workers from group III, exposed to noise and acids, sulfa-tes, chlorates and nitrates reported more times the exposure to chemical products, probably because they are actually in direct contact with such chemicals. On the other hand, workers from group IV are not in direct contact with free crystallized silica, once it is transformed in dust and smoke. This may explain why group IV did not report such exposure.
The control group made less reference to the presence of noise, dust, smoke, humidity and exposure to chemical pro-ducts, conirming, thus, its choice as control group. Workers from this group are not directly exposed to occupational risk factors, since the noise and chemical substances levels are below tolerance limits. Nevertheless, once they also work in the plant, they are not free of the studied risks. Therefore, these workers reported noise, dust, smoke, humidity, and chemical products in the working environment, besides vocal symptoms and laryngeal sensations, although less intensively than workers from the study groups.
These indings concerning the exposure to chemical subs-tances in workers from an ethanol and sugar mill agrees with
a national literature that mentioned that most of the workers from a metallurgical industry were exposed to chemical pro-ducts, dust and smoke (2). In another research, workers from
a soy oil reining industry reported presence of dust in the working area(3). Adversely, workers from another metallurgical
industry afirmed that their working environment was free of dust and smoke (1).
In general, workers from group IV suffer the most with the interference of occupational risk factors in their vocal health, that is, it is the most probable group to develop vocal disorders.
It is important to comment that although the results found are relevant, this study presents limitations regarding the data collecting method, since the managers handed the question-naires to the workers who answered the questions at home. Furthermore, there is also limitation concerning the sample size. Thus, further researches directed to workers’ vocal health are necessary.
CONCLUSION
Workers from this ethanol and sugar plant mentioned low-pitched voice as the main vocal symptom and cough with phlegm as the main laryngeal sensation. Such reports may be related to the exposure to physical and/or chemical risks during their professional activity.
Group IV, composed by workers exposed to noise and breathable particles and free crystallized silica, was consi-dered more likely to develop vocal symptoms and laryngeal sensations and, consequently, voice disorders. This fact may be explained by chemical exposure they are submitted. Further-more, it is composed by a greater number of active smokers. No correlation between low-pitched voice and smoking was veriied and, this way, this symptom may be related to the exposure to such chemical substances.
RESUMO
Objetivo: Investigar os sintomas vocais e sensações laríngeas dos trabalhadores de uma usina de álcool e açúcar expostos a ruído e/ou substâncias químicas. Métodos: Participaram 289 trabalhadores de umausina de álcool e açúcar distribuídos em cinco grupos expostos (I – ruído; II – ruído, óleo, graxa, derivação de petróleo; III – ruído, ácidos, sulfatos, cloretos, nitratos; IV – ruído, poeiras respiráveis e sílica livre cristalizada; V – óleo, graxa, derivação de petróleo) e um grupo controle que responderam o questionário Condições de Produção Vocal – Professor adaptado à categoria proissional. Os grupos foram comparados em relação aos sintomas vocais, sensações laríngeas, tabagismo e riscos físicos e químicos. Esta comparação foi realizada por meio de análise estatística. Resultados: O sintoma vocal e a sensação laríngea mais relatados pelos trabalhadores foram voz grave e tosse com catarro, respecti-vamente. Considerando o risco físico no ambiente de trabalho, os grupos I e IV foram os que mais citaram presença de ruído. Devido à sua exposição, os mesmos aumentavam a intensidade da voz (Efeito de Lombard-Tarneaud) e, assim, mencionaram sintomas vocais. Em relação aos riscos químicos no ambiente ocupacional, o grupo IV foi o que mais referiu presença de poeira e fumaça, e estas eram compostas por poeiras respiráveis e sílica. Tais exposições ocasionam sintomas vocais e sensações laríngeas e, consequentemente, alterações vocais. Conclusão: Sintomas vocais e sensações laríngeas podem estar relacionados a atividade proissional em que haja exposição a riscos físicos e/ou químicos.
REFERENCES
1. Coze WA. Condições de produção vocal em trabalhadores de uma indústria metalúrgica [dissertação]. São Paulo: Pontifícia Universidade Católica de São Paulo; 2003.
2. Ubrig-Zancanella MT, Behlau, M. Relação entre ambiente de trabalho e alteração vocal em trabalhadores metalúrgicos. Rev Soc Bras Fonoaudiol. 2010;15(1):72-9.
3. Arakaki FN, Ferreira LP, Troni CR, Lima FS. Condições de produção vocal de trabalhadores industriais: levantamento de dados na presença de riscos ocupacionais. Fono Atual. 2006;9(36):44-55.
4. Colton RH, Casper JK. Compreendendo os problemas de voz. Porto Alegre: Artes Médicas; 1996.
5. Siegel GM, Pick HL Jr. Auditory feedback in the regulation of voice. J Acoust Soc Am. 1974;56(5):1618-24.
6. Siegel GM, Schork EJ Jr, Pick HL Jr, Garber SR. Parameters of auditory feedback. J Speech Hear Res. 1982;25(3):473-5.
7. Pick HL Jr, Siegel GM, Fox PW, Garber SR, Kearney JK. Inhibiting the Lombard effect. J Acoust Soc Am. 1989;85(2):894-900.
8. Dejonckere PH, Lebacq J. Plasticity of voice quality: a prognostic factor for outcome of voice therapy? J Voice. 2001;15(2):251-6.
9. Behlau M, Madazio G, Feijó D, Azevedo R, Gielow I, Rehder MI. Aperfeiçoamento vocal e tratamento fonoaudiológico das disfonias. In: Behlau, M. Voz: o livro do especialista. Vol 2. Rio de Janeiro: Revinter; 2005. p.409 - 564.
10. Behlau M, Feijó D, Madazio G, Rehder MI, Azevedo R, Ferreira AE. Voz proissional: aspectos gerais e atuação fonoaudiologica. In: Behlau, M. Voz: o livro do especialista. Vol 2. Rio de Janeiro: Revinter; 2005. p.288 - 407.
11. Ferreira LP, Giannini SP, Latorre MR, Zenari MS. Distúrbio de voz relacionado ao trabalho: proposta de um instrumento para avaliação de professores. Distúrb Comun. 2007;19(1):127-36.
12. Behlau M, Azevedo R, Madazio G. Anatomia da laringe e isiologia da produção vocal. In: Behlau M. Voz: o livro do especialista. Vol 1. Rio de Janeiro: Revinter; 2001. p.288-407.
13. Ministério da Saúde do Brasil. Organização Pan-Americana da Saúde no Brasil. Doenças relacionadas ao trabalho: manual de procedimentos para os serviços da saúde. Brasília: Ministério da Saúde do Brasil; 2001. (Série A. Normas e Manuais Técnicos; n.114)
14. Facchini LA, Weiderpass E, Tomasi E. Modelo operário e percepção de riscos ocupacionais e ambientais: o uso exemplar de estudo descritivo. Cad Saúde Públ. 1991;25(5):394-400.
15. Pivetta AB, Botelho C. Prevalência de sintomas respiratórios e avaliaçäo espirométrica em trabalhores de marmorarias. J Pneumol. 1997;23(4):179-88.
16. Castro HA, Vicentin G, Ribeiro PC, Mendonça IC. Peril respiratório de 457 trabalhadores expostos à poeira de sílica livre no Estado do Rio de Janeiro. Pulmão RJ. 2004;13(2):81-5.
17. Veigas CA. Agravos respiratórios decorrentes da atividade agrícola. J Pneumol. 2000;26(2):83-90.
18. Leite EM. Solventes orgânicos. In: Oga S. Fundamentos de toxicologia. São Paulo: Atheneu; 1996.