ISSN 0104-6632 Printed in Brazil
www.abeq.org.br/bjche
Vol. 26, No. 03, pp. 595 - 610, July - September, 2009
Brazilian Journal
of Chemical
Engineering
SIMULATION ASSESSMENT OF CONTINUOUS
SIMULATING MOVING BED CHROMATOGRAPHY
PROCESS WITH PARTIAL FEED AND NEW
STRATEGY WITH PARTIAL FEED
H. Khan
Department of Chemical Engineering, Hanyang University, Seoul, 133-791, Korea. Current Address, Department of Chemical Engineering, NWFP University of
Engineering & Technology Peshawar, 25000, Pakistan. E-mail: [email protected]
(Submitted: December 27, 2008 ; Revised: April 9, 2009 ; Accepted: April 28, 2009)
Abstract - Partial Feed simulating moving bed (SMB) has proved to be more efficient in binary separation performance (purity, recovery, productivity) because of its two additional degrees of freedom, namely feed
length and feed time, as compared to classical SMB process. The binary separation of dextran T6 and fructose
with linear isotherm is modeled with Aspen Chromatography simulator in a four zone SMB with one column per zone for both normal-feed and Partial Feed. Increase in number of feed length and feed time in the cycle plays a very important role in the separation performance with Partial Feed. In addition, the effect of mode of operation (early or late introduction of increase in number of feed length in the cycle) on product purity and recovery is also investigated. Furthermore, the binary separation system is designed with the safety margin method and the optimum operating parameters for simulation are calculated with triangle theory. Finally, a new strategy with Partial Feed is developed, showing improved separation performance relative to the basic four-zone SMB with regard to extract stream purity and recovery. The results of the proposed study can served as a useful summary of Partial Feed operation.
Keywords: Simulating Moving Bed; Separation; Simulation; Column Profile; Partial Feed.
INTRODUCTION
Simulating moving bed (SMB) systems have served the hydrocarbon and sugar industries for more than forty years (Wang and Ching, 2007) because of their continuous process operation and other advantages in terms of minimum desorbent requirement, high productivity, lower product dilution, high final purities, efficient use of stationary and mobile phases, low investment cost and low space requirements (Zhang et al., 2004a; Mun et al., 2006).
Applications of SMB technology in the areas of biotechnology, pharmaceutical and fine chemical industries, as well as chiral separations, gives a further edge in advancement as compared to other chromatographic separation processes (Wang and Ching, 2007). Originally the SMB process was devised as the practical implementation of a true
Enriched Extract operation (EE-SMB) (Paredes et al., 2006), in which a portion of the extract is enriched and then re-injected into the SMB at the same collection point. The MF (MultiFeed) operating mode, introduced by Kim et al. (2005) and Sa Gomes et al. (2006), allows the introduction of multi-feed streams in a conventional SMB unit. In the Outlet Swing Stream-SMB operation mode, demonstrated by Sa Gomes and Rodrigues (2006), lower affinity and higher affinity components are collected in the raffinate and extract ports non-continuously. The Pseudo-SMB process (Mata and Rodrigues, 2001; Borges da Silva and Rodrigues, 2006; Borges da Silva and Rodrigues, 2008), illustrated by Japan Organo (JO) technology, is characterized by a 2-step operation: a chromatographic fixed-bed process in step 1 (feed is introduced while the intermediate product is recovered) and a simulated moving bed process in step 2 (feed is stopped and the more and less retained products are collected).
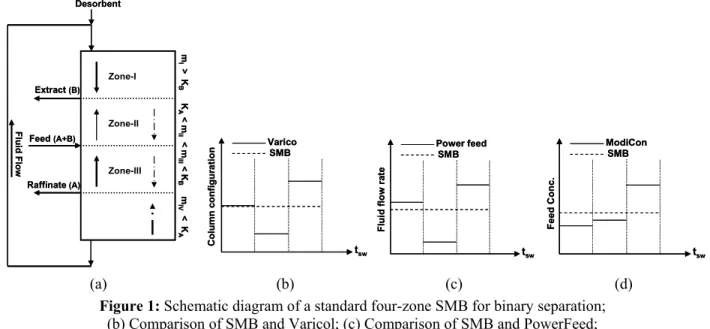
Further modifications of the simulating moving bed techniques are: the PowerFeed SMB process (Kearney and Hieb, 1992; Kloppenburg and Gills, 1999; Zhang et al., 2003a, 2004a,b) in which the flow rates in the unit are allowed to change during a column switching time following a predefined pattern; in Varicol (Adam et al., 2000, Hombourger et al., 2000, 2002; Zhang et al., 2002, 2003b; Toumi et al., 2003; Pais and Rodrigues, 2003) the basic principle of the process consists of an asynchronous shift of the inlet/outlet lines in a system of multicolumns in a recycle loop; in ModiCon (Schramn et al., 2002, 2003), another modification of classical SMB, the flow rate and the column configuration are kept unchanged while modulating the feed concentration during the switching period of the SMB process. Schematic representations of these three processes, i.e., PowerFeed, Varicol and ModiCon, in comparison to the basic SMB system, are shown in Figure 1. In the same class, a fourth new mode is Partial Feed (Zang and Wankat, 2002a), which has recently been proposed. Partial Feed follows the concept of varying the feed flow rate from continuous constant flow, as in total feed, to discontinuous pulsed flow (Zang and Wankat, 2002a; Kim et al., 2005, Abunasser et al., 2003). All the above processes have been developed to enhance the SMB separation performance, based on the idea of modifying the dynamic characteristics of its operation. These processes employ time varying liquid and solid flow rates instead of constant ones in the basic SMB process. The modification in solid and liquid flow rates increases the number of degrees of freedom as compared to a simple SMB unit (equivalent to a TMB with five degrees of freedom, that is, switching time and internal liquid flow rates Q1 to Q4, Zhang et al., 2004b).
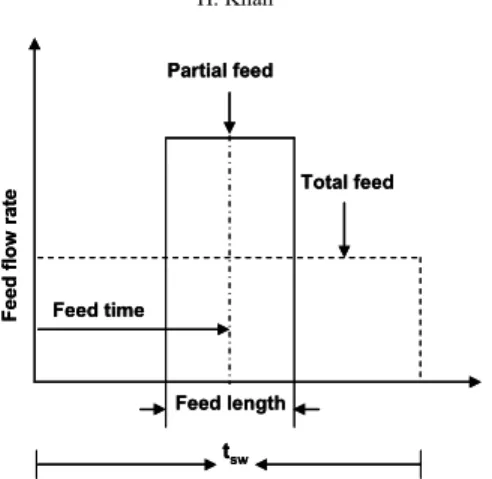
This work is a further extension of the work of Zang et al. (2002a). According to Zang and Wankat (2002a), Partial Feed operation introduces two additional degrees of freedom, feed time and feed length. Feed time refers to the time at which the centre of the feed phase enters the column (Figure 2). Feed length defines the time duration of the feed (Figure 2). The feed length is expressed as a function of the column switching time and the feed time is the time gap from the beginning of each step to the feed centre, also expressed as a fraction of column switching time. The choice of these two parameters affects the separation efficiency of Partial Feed SMB, because the operation does not have to be symmetric.
In Partial Feed SMB (Figure 2), the flow rates of extract product and desorbent streams are maintained constant at the same values as in total feed operation. Because of mass balance constraints, a change in feed flow rate brings approximate changes in the raffinate product flow rate. The operating method keeps the feed amount for each switching period the same as in total feed operation, though the feed flow rate is changed.
[
]
(
)
sw totalfeed
feed partial feed sw feed
t (feed flow rate)
t feed flow rate t t
−
× =
⎡ × ⎤ ≥
⎣ ⎦
(1)
Partial Feed can be considered to be a special case of total feed operation when tfeed = tsw.
In this paper, the influence of an increase in number of feed length and feed time in the process cycle on the separation performance of Partial Feed operation is investigated. In addition, the effect of an operational mode in which the increased number of feed length and feed time are introduced into the process cycle on product purity and recovery is also illustrated. No previous studies have, hitherto, given a detailed explanation of how the additional degrees of freedom offered by the Partial Feed strategy and the mode in which they are introduced into the operation cycle influence the separation performance. Finally a new strategy with Partial Feed operation is developed, showing enhanced product purity and recovery results, especially for the extract product stream, relative to conventional four-zone SMB.
SMB MODEL
Simulation Assessment of Continuous Simulating Moving Bed Chromatography Process 597
physical problems e.g., attrition of solid phase, lack of efficiency, axial mixing, liquid velocity limited by the fluidization (Blehaut and Nicoud, 1998).
Consequently, the only way to implement the moving bed concept is to discretize the counter-current column into identical fixed bed columns connected in series, achieving liquid circulation in the columns, then periodically switch the injection and withdrawal points from one column to the following one, so that it simulates the movement of the solid.
The commercial SMB unit is characterized by two streams (feed and desorbent) entering the system and two outlet streams (extract and raffinate) exiting from the system. These four streams divide the unit into four zones I, II, III and IV as shown in Figure 1; each of the four zones of the unit has to perform a specific task. The feed enters the column between zones II and III. Thus, these zones are responsible for the separation of the two feed components. Here, the net flow rates need to be set so that the more retained solute B is carried in the direction of the extract outlet and the least retained solute A in the direction of the raffinate outlet stream. Zones I and IV are responsible for the regeneration of the solid and liquid phases in order to avoid cross contamination. The desorbent is fed to zone-I to desorb solute B and thus to regenerate the stationary solid phase. In zone-IV, solute A is adsorbed onto the stationary solid phase to regenerate the desorbent. Moreover, the following set of inequalities has to be fulfilled in order to achieve a complete separation of the binary feed mixture A+B (Keßler and Morgenstern, 2006; Azevedo and Rodrigues, 2006, Morgenstern et al., 2008).
mI > KB (2)
KA < mII < mIII < KB (3)
KA > mIV (4)
In order to calculate explicit values for the flow rates, it is convenient to introduce a safety factor (β).
mI = β KB (5a)
mII = β KA (5b)
mIII = KB / β (5c)
mIV = KA / β (5d)
The parameters are Ki, linear isotherm and mj, the
so called mass flow rate ratio, defined as the ratio of net fluid flow rate over the solid phase flow rate in each zone of the SMB unit.
j
net fluid flow rate m
adsorbed phase rate
− =
−
SMB * * j
j *
Q t V
m
V (1 )
− ε =
− ε (6)
where ε* is the overall void fraction, V is the volume of the column, mj is the flow rate in the four zones of
SMB, Qj
SMB
is the internal flow rate in each of the zones of the SMB unit and t* is the column switching time.
Feed (A+B)
Raffinate(A) Extract (B)
Fl uid Fl o w Desorbent Zone-I Zone-II Zone-III m I
> K
B K A < m II < m III < K B m IV < K A
Feed (A+B)
Raffinate(A) Extract (B)
Fl uid Fl o w Desorbent Zone-I Zone-II Zone-III m I
> K
B K A < m II < m III < K B m IV < K A tsw Co lu m n c onf igur ati o
n VaricoSMB
tsw Co lu m n c onf igur ati o
n VaricoSMB
tsw Fl uid fl ow ra te Power feed SMB tsw Fl uid fl ow ra te Power feed SMB tsw F eed C o n c . ModiCon SMB tsw F eed C o n c . ModiCon SMB
(a) (b) (c) (d)
Figure 1: Schematic diagram of a standard four-zone SMB for binary separation; (b) Comparison of SMB and Varicol; (c) Comparison of SMB and PowerFeed;
Feed length
tsw
Fee
d
fl
ow
r
a
te
Feed time
Total feed Partial feed
Feed length
tsw
Fee
d
fl
ow
r
a
te
Feed time
Total feed Partial feed
Figure 2: Schematic sketch of Partial Feed and total feed SMB strategy.
ESTIMATION OF FLOW RATE AND COLUMN SWITCHING TIME
One of the key issues in simulating moving bed design is its successful operation, which depends on the correct choice of operating conditions, in particular determination of each zone flow rate and column switching time. Because of the complex behavior of these units, the choice of operating conditions is not straightforward. Currently used SMB design approaches are the safety margin method (Zhong and Guiochon, 1997), the standing wave design method (Ma and Wang 1997; Cremasco and Wang, 2003), the triangle theory (Storti et al., 1993; Mazzotti et al., 1997a), the separation volume (Azevedo and Rodrigues, 1999; Minceva and Rodrigues, 2002; Rodrigues and Pais, 2004) and the method based on consideration of velocity of propagation of species concentrations (Mata and Rodrigues, 2001).
The operating conditions for the linear binary system separation in the current work were calculated by using the triangle theory, an important methodology in the SMB design field. It allows one to find a feasible zone where separation is obtained for both non-linear and linear isotherms. Although equilibrium models are powerful design tools, the conditions may not fully apply in the design of real SMB units, because mass transfer and axial dispersion effects are frequently present (Azevedo and Rodrigues, 1999). Henceforth, the correct adjustment of the internal flow rates is the key in the design of a SMB process. The flow rates may be set in a way that the simultaneous functioning of all the zones is guaranteed. Hence, these effects have been taken into account by using a safety margin factor
(β) in the equilibrium models, whose value is
endorsed randomly and may lead to over-or underestimation errors (Azevedo and Rodrigues, 1999). In this regard, in several previous studies, the safety margin method was effectively used for the design of SMB with mass transfer resistance (Ruthven and Ching, 1989; Yun et al., 1997a; Wang et al., 2005; Jo et al., 2007).
To calculate explicit operating conditions, the corresponding external feed stream was fixed. Moreover, equimolar feed compositions were assumed and, for the determination of other flow rates, the equilibrium theory in combination with a
safety factor (β) value is used. In addition, the
advantage of this approach is that the flow rate ratio is a dimensional group bringing together information
about unit flow rates, Qj, switching time, t
*
, and column volume, V, and thus can be applied whatever the configuration and size of the SMB unit in both non-linear and linear systems.
SIMULATION
Simulation Assessment of Continuous Simulating Moving Bed Chromatography Process 599
and Ching (1989) and Pais et al. (1997b). Hidajat et al. (1986a) consider linear isotherm to study the transient evaluation of an SMB process. Equilibrium-dispersion model was used by Yun et al. (1997b) and by Hashimoto et al. (1983), Chu and Hashim (1995) and Hotier (1996), consider a finite mass transfer rate. Furthermore, Hidajat et al. (1986b), Storti et al. (1989) and Bauer et al. (1996) consider the effect of subdivision of the adsorbent bed on the performance of an SMB unit.
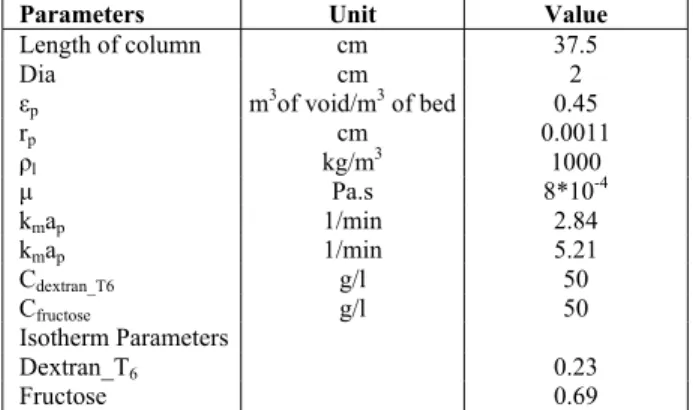
Table 1: Physical properties and column
specifications for Dextran T6-Fructose System
base cases for SMB and Partial Feed.
Parameters Unit Value
Length of column cm 37.5
Dia cm 2
εp m3of void/m3 of bed 0.45
rp cm 0.0011
ρl kg/m3 1000
μ Pa.s 8*10-4
kmap 1/min 2.84
kmap 1/min 5.21
Cdextran_T6 g/l 50
Cfructose g/l 50
Isotherm Parameters
Dextran_T6 0.23
Fructose 0.69
In the current work, the Aspen Chromatography 2004 simulator is used to simulate both the SMB operations, that is, Partial Feed and total feed. The binary separation studied here is of a linear system,
dextran T6 (component A) and fructose (component
B). The physical parameters used are listed in Table 1 (Zhong and Guiochon, 1996; Abunasser et al., 2003). The simulation model consists of the mass balance equation for the mobile phase and the mass transfer equation between stationary phase and mobile phase. For mobile phase within each zone, the single porosity model (Wankat, 1990) is used for the mass balance of component i as follows.
2 j j i i i i
o b,i 2
C q C C
P E u
t t z z
∂ + ∂ = ∂ − ∂
∂ ∂ ∂ ∂ (7)
where Ci is the fluid phase concentration of species i
at time t and axial position z, P is the phase ratio, defined as (1-ε) / ε, where ε is total void fraction, Eb,ij
is the axial dispersion coefficient of component i in zone j and ujo is the fluid phase interstitial velocity in
zone j.
For the mass transfer equation, a linear lumped resistance model is used as follows:
* i
m p i i q
k a (C C )
t
∂ = −
∂ (8)
where km is the mass transfer coefficient, ap is the
external surface area per particle volume and ap =
3/rp for a spherical particle and C*i is the equilibrium
liquid concentration corresponding to the solid concentration.
The aforementioned model equations are solved for the product purity values; an upwind differencing scheme (USDI) was employed in conjunction with Implicit Euler Integration. All the numerical computations were carried out in the Aspen Chromatography simulator, which has been validated in several previous studies (Zang and Wankat, 2002; Abunasser et al., 2003; Kim et al., 2005; Jo et al., 2007).
RESULTS AND DISCUSSION
Four-Zone SMB
The four-zone SMB with one column per zone is designed by varying the magnitude of the safety factor (β) value. The simulation results are presented in Figure 3, where the product purity values are plotted as a function of β value.
Figure 3 shows that the purity value of A in the
raffinate stream increases with an increase in β
value. As expected from equation 5(b) and 5(c), an increase in β value decreases the zone-III flow rate and increases the zone-II flow rate, which in turn affects the solute velocity of A and B as follows. The adsorption wave of B in zone-III migrates slower and thus ends up further away from the raffinate port, which helps to prevent its possible contamination with solute A, resulting in higher purity of A in the raffinate stream. In contrast, the solute wave velocity of A in zone-II increases as the value of β increases, which causes the adsorption wave of solute A to diffuse quickly towards the zone-II column end. The port switching time decreases with increase in the
value of β. Thus, on port switching upstream from
the feed port, the solute wave of A reaches earlier the column end in zone-III and the increase in its purity occurs in the raffinate product stream. Similarly, the purity value of solute B also increases in the extract stream with increase in β value. As anticipated from
equation 5(a) and 5(d), an increase in β value
desorption wave of solute B migrates faster towards the extract port in zone-I and the adsorption wave of A in zone-IV migrates slower, thus ends up further away from the extract port. Both these factors help to enhance the purity of solute B in the extract stream. In addition, the solute wave velocity of A increases in zone-II and, as given by equation 5(b), an increase in β value cause the adsorption wave of solute A to migrate faster towards the column end and thus further away from the extract-I port. This helps to prevent a possible contamination of A with B, resulting in its high purity in the extract-I stream. Figure 3 also shows another phenomenon, the increase in purity of both component A and B
occurs only up to a certain value of β. Further
increase in the β value causes a sharp decrease in
the purity, which may be due to mass transfer and axial dispersion effects. The separation performance between the components become difficult due to mass transfer resistance, which
results in the dispersion of the species concentration waves, allowing species to enter into unwanted sections (Borges da Silva and Rodrigues, 2008) and consequently reducing the separation efficiency (Pais et al., 1997; Kurup et al., 2006). The purity trend shows that, at a β value of 1.5, the purity value of dextran T6 in the raffinate stream is
97.93% and for fructose in the extract stream is
95.29%; after this value of β, a sharp decrease in
product purity values occurs because the axial dispersion and mass transfer resistance become dominant, which in turn affect the solutes linear velocities among the different zones. The changes in the solute linear velocities are related to product purity values, so the zone flow rates have to be modified (Ma and Wang, 1997). Moreover, the corresponding operating points for the product purity are also plotted in a triangular diagram (mIII
Vs mII) as shown in Figure 4, which is drawn under
the constraints discussed earlier.
82 84 86 88 90 92 94 96 98 100
1 1.1 1.2 1.3 1.4 1.5 1.6 1.7 1.8 1.9 2 Safety Factor
P
u
ri
ty
(%)
Fructose Dextran_T6
0 0.2 0.4 0.6 0.8 1
0 0.2 0.4 0.6 0.8 1
m2
m3
Figure 3: Effect of change in safety factor (β) value on the separation performance of the four-zone SMB.
Figure 4: Complete separation region in the (m3,
m2) for fructose and dextran T6 in four-zone SMB.
Fructose
86 88 90 92 94 96 98 100
0 0.2 0.4 0.6 0.8 1
Feed lenght
P
u
ri
ty
(%
)
β = 1
β = 1.1
β =1.2
β = 1.3
β =1.4
β = 1.5
β = 1.6
Dextran_T6
80 82 84 86 88 90 92 94 96 98 100
0 0.2 0.4 0.6 0.8 1
Feed lenght
Pu
ri
ty
(
%
)
β = 1
β = 1.1
β =1.2
β = 1.3
β =1.4
β = 1.5
β = 1.6
(a) (b) Figure 5: Influence of feed length on product purity with respect to β value based on Aspen
Simulation Assessment of Continuous Simulating Moving Bed Chromatography Process 601
PARTIAL FEED SMB
Like four-zone SMB with one column, the effect of the β value on the product purity in the raffinate and extract stream for Partial Feed SMB is illustrated in Figure 5. Partial Feed operation shows a significant improvement in the product purities compared to total feed operation. Both product components A and B are significantly purer (contain less of the impurity). The improved separation with Partial Feed results because the diffusion of the solute wave of B in zone-III towards the column end decreases (ends up further away from the raffinate port) resulting in high purity of A. In zone-I, the leading edge of B reaches the extract port earlier. This is due to the higher solute velocity as compared to total feed operation, resulting in higher purity of the extract product stream. Figure 5 also demonstrates that, as the magnitude of the feed length decreases, the purity of both the raffinate and extract product streams increases as a result of the increase in solute wave velocities, resulting in faster migration towards their respective product outlets ports. However, the pressure drop in the column increases upon decreasing feed length (Zang and Wankat, 2002), which limits the extent to which the feed length can be decreased.
INFLUENCE OF INCREASE IN NUMBER OF FEED LENGTH PER CYCLE
The results shown in Table 2 and Figure 7 illustrate the influence of an increase in number of feed length in the operation cycle on the product
purity values for a β value of 1.5 in Partial Feed
operation. At this value of β, the conventional four-zone SMB gives maximum product purity, as mentioned earlier. The product purity for both solutes A and B decreases as the number of feed length increases per cycle in Partial Feed operation. This decrease in product purity for both the raffinate and extract streams can be explained from the column profile study shown in Figure 7. The diffusion of the solute B wave increases towards the raffinate port in zone-III, with an increase in number of feed length steps in the operation cycle. This
causes the raffinate product purity to decrease. Similarly, the bandwidth of the solute A wave increases with increase in number of feed length. The tail of the solute A wave in zone-II becomes thinner towards the extract port, which may cause solute B to contaminate, thus decreasing its purity in the extract stream.
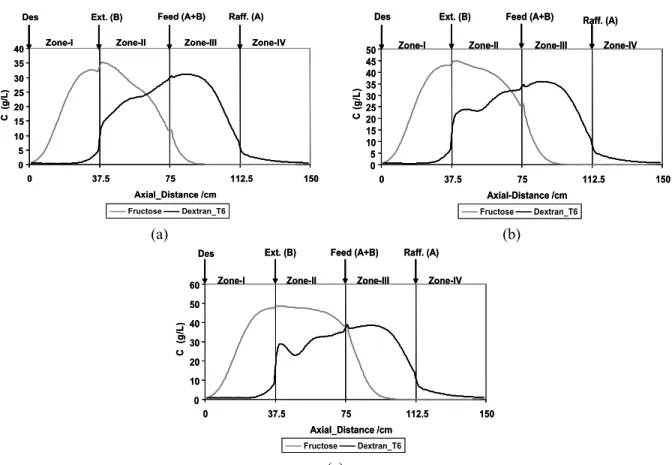
INFLUENCE OF LATE AND EARLY FEED PULSE INTRODUCTION ON
Partial Feed Operation
The influence on product purity of late or early feed pulse (Figures 6 and 8) introduction in the operation cycle for Partial Feed is demonstrated in Tables 2 and 3, respectively. An early feed pulse in the operating cycle for Partial Feed results in lower product purity than with the late feed pulse. The reason for the improved separation with a late feed pulse as compared to an early feed pulse can be explained from the column concentration profiles illustrated in Figures 7 and 9. With an early feed pulse, the tailing edge of the solute A wave diffuses more towards the extract product port as compared to a late feed pulse, which may cause more contamination of solute B. In addition, in zone-III, the leading edge of the solute B wave moves further towards the raffinate port than with a late feed pulse. Such wave migration results in greater contamination of the raffinate product stream and consequently decreases the purity of solute A. Moreover, in Partial Feed with an early feed pulse, as the number of feed length steps increases for a constant feed time, the feed flow rate in the feed introduction step during the operation cycle increases as result of decrease in
(tsw)feed. This may enhance the solute migration
Table 2: Effect of increase in number of feed length on product purity and recovery values for Partial Feed SMB based on Aspen chromatography simulation (late feed pulse in operation cycle, Figure 6), β =
1.5, productivity = 2.122, desorbent consumption = 0.07 l/g, tsw = 7.45154.
Number of feed length steps 1 2 3 4 1 2 3 4
Step size for feed length 0.2 0.2 0.2 0.2 0.1 0.1 0.1 0.1
Raffinate purity ( % ) Dextran T6 99.58 94.81 84.29 64.13 99.58 94.96 84.42 74.63
Extract purity (%) Fructose 97.48 97.30 96.74 95.96 97.54 97.52 97.21 96.64
Recovery (%) Dextran T6 99.59 97.37 97.24 97.19 97.5 97.61 97.65 97.67
Fructose 97.42 94.66 81.88 66.79 99.59 94.81 81.98 66.8
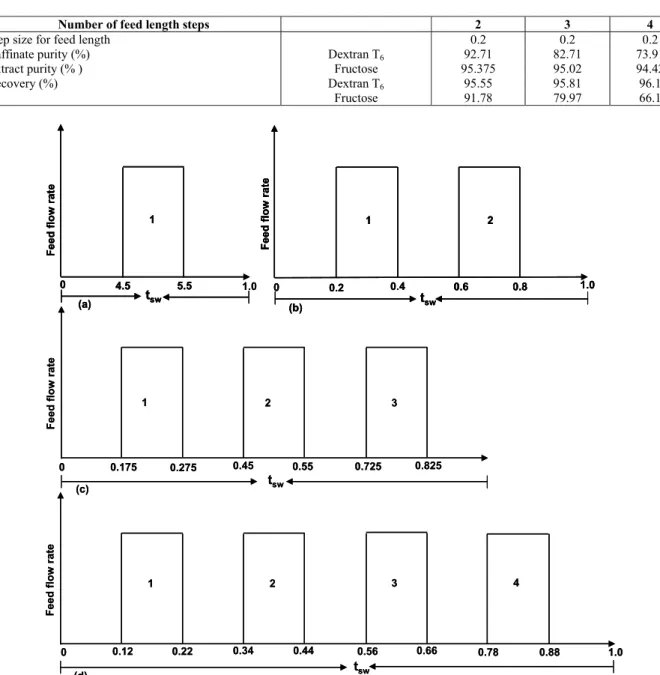
Table 3: Effect of increase in number of feed length on product purity and recovery for Partial Feed SMB based on Aspen chromatography simulation (early feed pulse in operation cycle, Fig. 8), β = 1.5,
productivity = 2.122, desorbent consumption = 0.07 l/g, tsw = 7.45154.
Number of feed length steps 2 3 4
Step size for feed length 0.2 0.2 0.2
Raffinate purity (%) Dextran T6 92.71 82.71 73.91
Extract purity (% ) Fructose 95.375 95.02 94.42
Recovery (%) Dextran T6 95.55 95.81 96.1
Fructose 91.78 79.97 66.1
tsw
Feed flo
w
r
a
te
0.175 0.275 0.45 0.55 0.725 0.825
0
1 2 3
(c)
tsw
Feed f
lo
w
rate
1 2 3 4
0.12 0.22 0.34 0.44 0.56 0.66 0.78 0.88
0 1.0
(d)
1.0
Feed
flow
rat
e
tsw
0 4.5 5.5
1
(a) (b)
1.0
F
e
e
d
fl
o
w r
a
te
tsw
0 0.2 0.4 0.6 0.8
1 2
tsw
Feed flo
w
r
a
te
0.175 0.275 0.45 0.55 0.725 0.825
0
1 2 3
(c)
tsw
Feed f
lo
w
rate
1 2 3 4
0.12 0.22 0.34 0.44 0.56 0.66 0.78 0.88
0 1.0
(d)
1.0
Feed
flow
rat
e
tsw
0 4.5 5.5
1
(a)
Feed
flow
rat
e
tsw
0 4.5 5.5
1
(a) (b)
1.0
F
e
e
d
fl
o
w r
a
te
tsw
0 0.2 0.4 0.6 0.8
1 2
(b)
1.0
F
e
e
d
fl
o
w r
a
te
tsw
0 0.2 0.4 0.6 0.8
1 2
Figure 6: Number of feed length per cycle, late feed pulse, (a) Numbers of feed length (0.1 tsw) = 1, (b) Numbers
Simulation Assessment of Continuous Simulating Moving Bed Chromatography Process 603
0 10 20 30
0 37.5 75 112.5 150
Axial-Distance /cm
C
(
g
/L)
Fructose Dextran-T6
Zone-I Zone-II Zone-III Zone-IV
Des Ext. (B) Feed (A+B) Raff. (A) (a)
0 10 20 30
0 37.5 75 112.5 150
Axial-Distance /cm
C
(
g
/L)
Fructose Dextran-T6
Zone-I Zone-II Zone-III Zone-IV
Des Ext. (B) Feed (A+B) Raff. (A) (a)
0 10 20 30 40
0 37.5 75 112.5 150
Axial_Distance /cm
C (
g
/L
)
Fructose Dextran_T6
Zone-I Zone-II Zone-III Zone-IV
Des Ext. (B) Feed (A+B) Raff. (A)
0 10 20 30 40
0 37.5 75 112.5 150
Axial_Distance /cm
C (
g
/L
)
Fructose Dextran_T6
Zone-I Zone-II Zone-III Zone-IV
Des Ext. (B) Feed (A+B) Raff. (A)
(a) (b)
0 10 20 30 40 50
0 37.5 75 112.5 150
Axial_Distance /cm
C (
g
/L
)
Fructose Dextran_T6
Zone-I Zone-II Zone-III Zone-IV
Des Ext. (B) Feed (A+B) Raff. (A)
0 10 20 30 40 50
0 37.5 75 112.5 150
Axial_Distance /cm
C (
g
/L
)
Fructose Dextran_T6
Zone-I Zone-II Zone-III Zone-IV
Des Ext. (B) Feed (A+B) Raff. (A)
0 10 20 30 40 50 60
0 37.5 75 112.5 150
Axial_Distance /cm
C (
g
/L)
Fructose Dextran_T6
Zone-I Zone-II Zone-III Zone-IV
Des Ext. (B) Feed (A+B) Raff. (A)
0 10 20 30 40 50 60
0 37.5 75 112.5 150
Axial_Distance /cm
C (
g
/L)
Fructose Dextran_T6
Zone-I Zone-II Zone-III Zone-IV
Des Ext. (B) Feed (A+B) Raff. (A)
(c) (d) Figure 7: Column concentration profile for late feed pulse introduction during entire switching period at cyclic
steady state based on Aspen chromatography simulation, (a) Numbers of feed length = 1, (b) Numbers of feed length = 2, (c) Numbers of feed length = 3, (d) Numbers of feed length = 4.
tsw
F
eed
f
low
rat
e
0 0.1 0.3 0.4 0.6 0.7 0.9 1.0
1 2 3 4
(c)
tsw
Feed f
low
rate
0 0.4 0.6 1.0
1 2
(a)
tsw
Feed fl
o
w
rat
e
0 0.2 0.4 0.6 0.8 1.0
1
2 3
(b)
tsw
F
eed
f
low
rat
e
0 0.1 0.3 0.4 0.6 0.7 0.9 1.0
1 2 3 4
(c)
tsw
Feed f
low
rate
0 0.4 0.6 1.0
1 2
(a)
tsw
Feed fl
o
w
rat
e
0 0.2 0.4 0.6 0.8 1.0
1
2 3
(b)
Figure 8: Number of feed length steps, early feed pulse, (a) Numbers of feed length (0.4tsw) = 2,
0 5 10 15 20 25 30 35 40
0 37.5 75 112.5 150
Axial_Distance /cm
C
(g/L)
Fructose Dextran_T6
Zone-I Zone-II Zone-III Zone-IV Des Ext. (B) Feed (A+B) Raff. (A)
0 5 10 15 20 25 30 35 40
0 37.5 75 112.5 150
Axial_Distance /cm
C
(g/L)
Fructose Dextran_T6
Zone-I Zone-II Zone-III Zone-IV Des Ext. (B) Feed (A+B) Raff. (A)
0 5 10 15 20 25 30 35 40 45 50
0 37.5 75 112.5 150
Axial-Distance /cm
C (
g
/L
)
Fructose Dextran_T6
Zone-I Zone-II Zone-III Zone-IV Des Ext. (B) Feed (A+B) Raff. (A)
0 5 10 15 20 25 30 35 40 45 50
0 37.5 75 112.5 150
Axial-Distance /cm
C (
g
/L
)
Fructose Dextran_T6
Zone-I Zone-II Zone-III Zone-IV Des Ext. (B) Feed (A+B) Raff. (A)
(a) (b)
0 10 20 30 40 50 60
0 37.5 75 112.5 150
Axial_Distance /cm
C
(g
/L
)
Fructose Dextran_T6
Zone-I Zone-II Zone-III Zone-IV Des Ext. (B) Feed (A+B) Raff. (A)
0 10 20 30 40 50 60
0 37.5 75 112.5 150
Axial_Distance /cm
C
(g
/L
)
Fructose Dextran_T6
Zone-I Zone-II Zone-III Zone-IV Des Ext. (B) Feed (A+B) Raff. (A)
(c)
Figure 9: Column concentration profile for early feed introduction during entire switching period at cyclic steady state based on Aspen chromatography simulation, (a) Numbers of feed length (0.4tsw) = 2,
(b) Numbers of feed length (0.2tsw) = 3, (c) Numbers of feed length (0.1tsw) = 4.
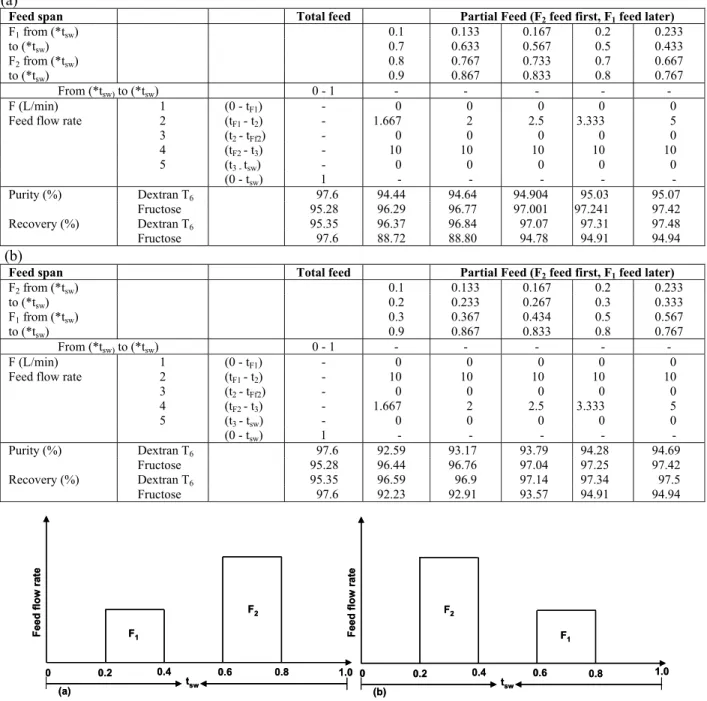
NEW STRATEGY WITH PARTIAL FEED
A novel strategy with Partial Feed has been developed with two feed pulses per operating cycle of different feed flow rate, as shown in Figure 10. In
mode-I, a low feed flow rate pulse (F1) enters the
operating cycle before the high feed flow rate pulse (F2). In contrast, in mode-II, a high feed flow rate
pulse enters the cyclic operation before the lower
feed flow rate pulse. In both modes, F2 is kept
constant, that is, 10 L/min. The results obtained in operating the Partial Feed cycle in mode-I are
illustrated in Table 4(a). The dextran T6 purity
decreases as compared to total feed operation, while showing significant improvements in the recovery. On the contrary, for the extract product, fructose purity increases with a decrease in recovery, when compared to the total feed operation. Additionally it is observed that, with this new strategy in Partial Feed, an overall increase in purity and recovery is obtained for both raffinate and extract product
streams with an increase in F1 feed flow rate.
Similarly, in mode-II, almost the same phenomenon is observed as with mode-I. However, in mode-II
(Table 4(b)), the product purity for dextran T6 is
lower than that obtained in mode-I. In conclusion, of the new strategies for Partial Feed operation, mode-I is more profitable in terms of both product purities and recoveries as compared to mode-II.
Simulation Assessment of Continuous Simulating Moving Bed Chromatography Process 605
propagation of A towards the extract product port is high for total feed, causing possible contamination of solute B and decreasing its purity in the extract product stream as compared to Partial Feed in either mode I or II.
Figure 12 illustrates the change in flow rate of both F1 and F2 under the constraint of fixed feed time and
the results are shown in Table 5. The recovery and purity of both dextran T6 and fructose increase with an
increase in feed length step for F1 and a decrease in
feed length for F2. The leading edge of fructose departs
further from the raffinate product, as does the trailing edge of fructose from the extract product, resulting in increased purity of both the products, respectively.
Table 4 (a) and (b): Comparison of product purities and recoveries for four-zone SMB both for total feed and new strategies for Partial Feed based on Aspen chromatography simulations. β = 1.5, productivity =
2.122, desorbent consumption = 0.07 l/g, tsw = 7.745154. (a) Mode-I, (b) Mode-II, Fig. 10, respectively.
(a)
Feed span Total feed Partial Feed (F2 feed first, F1 feed later)
F1 from (*tsw) 0.1 0.133 0.167 0.2 0.233
to (*tsw) 0.7 0.633 0.567 0.5 0.433
F2 from (*tsw) 0.8 0.767 0.733 0.7 0.667
to (*tsw) 0.9 0.867 0.833 0.8 0.767
From (*tsw) to (*tsw) 0 - 1 - - - - -
F (L/min) 1 (0 - tF1) - 0 0 0 0 0
Feed flow rate 2 (tF1 - t2) - 1.667 2 2.5 3.333 5
3 (t2 - tFf2) - 0 0 0 0 0
4 (tF2 - t3) - 10 10 10 10 10
5 (t3 - tsw) - 0 0 0 0 0
(0 - tsw) 1 - - - - -
Purity (%) Dextran T6 97.6 94.44 94.64 94.904 95.03 95.07
Fructose 95.28 96.29 96.77 97.001 97.241 97.42
Recovery (%) Dextran T6 95.35 96.37 96.84 97.07 97.31 97.48
Fructose 97.6 88.72 88.80 94.78 94.91 94.94
(b)
Feed span Total feed Partial Feed (F2 feed first, F1 feed later)
F2 from (*tsw) 0.1 0.133 0.167 0.2 0.233
to (*tsw) 0.2 0.233 0.267 0.3 0.333
F1 from (*tsw) 0.3 0.367 0.434 0.5 0.567
to (*tsw) 0.9 0.867 0.833 0.8 0.767
From (*tsw) to (*tsw) 0 - 1 - - - - -
F (L/min) 1 (0 - tF1) - 0 0 0 0 0
Feed flow rate 2 (tF1 - t2) - 10 10 10 10 10
3 (t2 - tFf2) - 0 0 0 0 0
4 (tF2 - t3) - 1.667 2 2.5 3.333 5
5 (t3 - tsw) - 0 0 0 0 0
(0 - tsw) 1 - - -
Purity (%) Dextran T6 97.6 92.59 93.17 93.79 94.28 94.69
Fructose 95.28 96.44 96.76 97.04 97.25 97.42
Recovery (%) Dextran T6 95.35 96.59 96.9 97.14 97.34 97.5
Fructose 97.6 92.23 92.91 93.57 94.91 94.94
Fe
ed f
lo
w
r
a
te
tsw
0 0.2 0.4 0.6 0.8
(b)
F2
F1
1.0
Fe
e
d
f
lo
w
r
a
te
tsw
0 0.2 0.4 0.6 0.8
(a)
F1
F2
1.0
Fe
ed f
lo
w
r
a
te
tsw
0 0.2 0.4 0.6 0.8
(b)
F2
F1
1.0
Fe
e
d
f
lo
w
r
a
te
tsw
0 0.2 0.4 0.6 0.8
(a)
F1
F2
1.0
Figure 10: Partial Feed with new strategy, (a) Mode-I: F1 (low feed flow rate) pulse earlier than F2
(high feed flow rate) pulse in operation cycle, (b) Mode-II: F2 (high feed flow rate)
0 5 10 15 20 25
0 37.5 75 112.5 150
Axial_Distance /cm
C (g
/L
)
Fructose Dextran_T6
Zone-I Zone-II Zone-III Zone-IV Des Ext. (B) Feed (A+B) Raff. (A)
0 5 10 15 20 25
0 37.5 75 112.5 150
Axial_Distance /cm
C (g
/L
)
Fructose Dextran_T6
Zone-I Zone-II Zone-III Zone-IV Des Ext. (B) Feed (A+B) Raff. (A)
0 5 10 15 20 25 30 35 40
0 37.5 75 112.5 150
Axial-Distance /cm
C
(g/
L)
Fructose Dextran_T6
Zone-I Zone-II Zone-III Zone-IV Des Ext. (B) Feed (A+B) Raff. (A)
0 5 10 15 20 25 30 35 40
0 37.5 75 112.5 150
Axial-Distance /cm
C
(g/
L)
Fructose Dextran_T6
Zone-I Zone-II Zone-III Zone-IV Des Ext. (B) Feed (A+B) Raff. (A)
(a) (b)
0 5 10 15 20 25 30 35 40
0 37.5 75 112.5 150
Axial_Distance /cm
C (
g
/L
)
Fructose Dextran_T6
Zone-I Zone-II Zone-III Zone-IV Des Ext. (B) Feed (A+B) Raff. (A)
0 5 10 15 20 25 30 35 40
0 37.5 75 112.5 150
Axial_Distance /cm
C (
g
/L
)
Fructose Dextran_T6
Zone-I Zone-II Zone-III Zone-IV Des Ext. (B) Feed (A+B) Raff. (A)
(c)
Figure 11: Column concentration profile during entire switching period at cyclic steady state based on Aspen chromatography simulation. (a) total-feed, (b) Partial Feed with mode-I, (c) Partial Feed with mode-II.
Fe
e
d
fl
o
w
r
a
te
tsw
0 0.1 0.3 0.4 0.9
(b)
F2
F1
1.0
Fe
e
d
fl
o
w
r
a
te
tsw
0 0.1 0.2 0.3 0.9
(a)
F1
F2
1.0
Fe
e
d
fl
o
w
r
a
te
tsw
0 0.1 0.3 0.4 0.9
(b)
F2
F1
1.0
Fe
e
d
fl
o
w
r
a
te
tsw
0 0.1 0.2 0.3 0.9
(a)
F1
F2
1.0
Figure 12: Partial Feed with new strategy, changing F1 and F2 at fixed feed time.
Table 5: Product Purities and Recoveries of Partial Feed with new Strategy with changing F1 and F2 based on Aspen Chromatography simulations, β = 1.5,
productivity = 2.122, desorbent consumption = 0.07 l/g, tsw = 7.745154
Feed span Partial Feed (F1 feed first, F2 feed later)
F1 from (*tsw) 0.1 0.1 0.1
to (*tsw) 0.15 0.2 0.3
F2 from (*tsw) 0.25 0.3 0.4
Simulation Assessment of Continuous Simulating Moving Bed Chromatography Process 607
Continuation Table 5
Feed span Partial Feed (F1 feed first, F2 feed later)
QF (L/min) 1 (0-tF1) 0 0 0
feed flow rate 2 (tF1-t2) 20 10 5
3 (t2-tFf2) 0 0 0
4 (tF2-t3) 1.538 1.667 2
5 (t3-tsw) 0 0 0
(0-tsw) - - -
Purity (%) Dextran T6 91.922 92.597 94.263
Fructose 96.292 96.443 97.253
Recovery (%) Dextran T6 96.476 96.277 94.097
Fructose 91.522 96.596 97.343
CONCLUSION
The separation performance of a four-zone simulating moving bed for binary separation of dextran T6 and fructose is investigated for both total
feed and Partial Feed operations. Prior to the comparative study, the four-zone SMB for this separation is designed by the safety margin method and optimum operating parameters for simulation are calculated with triangle theory. The results illustrate that Partial Feed operation led to much better separation performance in terms of purity and recovery than total feed operation. Further investigation into the Partial Feed strategy showed that, with increase in number of feed length in cyclic operation, the product purity of both A and B decreases. In addition, early feed pulse with an increased number of feed length in a cycle caused lower product purity than a late feed pulse.
Furthermore, a novel strategy for Partial Feed is developed with two feed pulses per operation cycle with different flow rates. In the mode-I strategy, a
low feed flow rate pulse (F1) enters the cyclic
operation earlier than the high feed flow rate pulse (F2). In the mode-II strategy, a high feed flow rate
pulse enters the operation cycle before the lower feed
flow rate pulse; in both strategies, F2 is kept
constant. The results of these new strategies show greater improvements in fructose purity and
recovery, and also for dextran T6 recovery, as
compared to the classical four-zone SMB with total feed operation and, in some aspects, from single feed length in Partial Feed. In another strategy, the flow rate of both F1 and F2 was varied, while the feed time
remained fixed. As a result, improvement in both raffinate and extract product purity and recovery occurs. Further investigations with more concentrated systems that have non-linear isotherms is the goal of future research.
ACKNOWLEDGEMENT
“This research work was sponsored by ‘Higher Education Commission (HEC), Govt. Of Pakistan’ under the scholarship program titled: MS Level Training in Korean Universities/Industry, bearing GRE type Test Roll Number”. The author is also grateful to Sa Hee Jo (Ph.D scholar), Department of Chemical Engineering Hanyang University, Seoul Korea for his assistance and guidance with the simulation software.
NOMENCLATURE
A Dextran T6
B Fructose
aP surface-to-volume ratio 1/m
Ci Concentration of
component i
g/L
C* Equilibrium
concentration
g/L
F Feed flow rate L/min
F1 Low feed flow rate pulse L/min
F2 High feed flow arte pulse L/min
j i b
E . Axial dispersion
coefficient of component i in zone j,
cm2/min
Ki Linear equilibrium
parameter
L/g of solute
km Mass-transfer coefficient cm
2
/s
mj Ratio of liquid flow rate
to solid flow rate in zone j.
P Phase ratio
qi Amount of solute i
adsorbed
g/g of solute SMB
j
Q Internal flow rate in each
rp Radius of particle
tsw Column switch time min
j o
u Mobile phase interstitial
velocity in zone j
cm/min.
V Volume of column.
z Axial distance (cm)
Productivity (Feed volume/time) / (total adsorbent volume) = F / (Nos. of columns)* Ac * L
Desorbent consumption
(Fextract + Ffeed) / Ffeed
( CAfeed + CBfeed)
Greek Letters
β Safety factor
εp Intraparticle void
ε* Total void fraction
ρl Liquid density (g/cm3)
μ viscosity (Pa-s)
REFERENCES
Abel, S., Mazzotti, M., and Morbidelli, M., Solvent gradient operation of simulating moving beds I. Linear isotherm, J. Chromatogr. A., 944, 23–39 (2002).
Abunasser, N., Wankat, P. C., Kim, Y. S., and Koo, Y. M., One-column chromatograph with recycle analogous to simulating moving bed absorbers: analysis and application, Ind. Eng. Chem. Res., 42, 5268-5279 (2003).
Adam, P. R., Nicoud, N., Bailly, M., and Ludemann-Hombourger, US. Patent No., 6136198, (2002). Antos, D. and Seidel-Morgenstern, A., Application
of gradient in the simulated moving bed process, Chem. Eng. Sci., 56, 6667-6682 (2001).
Azevedo, D.C.S. and Rodrigues, A.E., Design of a simulating moving bed in the presence of mass transfer resistances, AIChE J., 45, 956-966 (1999).
Azevedo, D.C.S. and Rodrigues, A.E., Design and optimization of new simulating moving bed plants, Braz. J. Chem. Eng., 23, 171-181 (2006). Bauer, J., Priegnitz, J., Chandhok, A., and Wilcher,
S., UOP sorbex simulating moving bed performance, Int. Symp. On preparative and industrial chromatography and related techniques, Basel (1996).
Blehaut, J. and Nicoud, R.M., Recent aspects in simulating moving bed. Preparative chromatography, Wiley-VCH, 26, 60-70 (1998).
Borges da Silva, E. A. and Rodrigues, A. E., Methodology for the design of chromatographic multicomponent separation by a pseudo-simulating moving bed, AIChE J., 52, 3794-3812 (2006).
Borges da Silva, E. A. and Rodrigues, A. E., Design methodology and performance analysis of pseudo-simulating moving bed for ternary separation, Sep. Sci. Tech., 43, 533-566 (2008). Chu, K. H. and Hashim, M. A., Simulated
countercurrent adsorption processes: A comparison of modeling strategies, Chem. Eng. J., 56, 59-65 (1995).
Cremasco, M. A. and Wang, N-H. L., A design of the effect of selectivity on binary separation in the four zone simulating moving bed for systems with linear isotherms, Braz. J. Chem. Eng., 20, 181-190 (2003).
Dentet, F., Hauck, W., Nicoud, R.M., Di Giovanni, O., Mazzotti, M., Jaubert, J.N., and Morbidalli, M., Enantiseparation through supercritical fluid simulating moving bed (SF-SMB) chromatography, Ind. Chem. Res., 40, 4603-4609 (2001).
Di Giovanni, O., Mazzotti, M., Morbidalli, M., Dent, F., Hauck, W., and Nicoud, R. M., Super critical fluid simulating moving bed chromatography II. Langmuir isotherm, J. Chromatogr. A., 919, 1-12 (2001).
Hashimoto, K., Adachi, S., Noujima, H., and Maruyama, H., Models for the separation of glucose-fructose mixture using a simulated moving bed absorber, J. Chem. Eng. Japan, 16, 400 (1983).
Hidajat, K., Ching, C. B., and Ruthven, D. M., Numerical simulation of a semi-continuous counter-current adsorption unit for fructose-glucose separation, Chem, Eng. J., 33, 55-61 (1986a).
Hidajat, K., Ching, C. B., and Ruthven, D. M., Simulated countercurrent adsorption processes: A theoretical analysis of the effect of subdividing the adsorption bed, Chem. Eng. Sci., 41, 2953-2956 (1986b).
Hombourger, O. L., Pigorini, G., Nicoud, R. M., Ross, D. S., and Terfloth, G., Application of Varicol process to the separation of the isomers of the SB-553261 racemate, J. Chromatogr. A., 947, 59-68 (2002).
Hotier, G., Physically meaningful modeling of the 3-zone and 4-3-zone simulating moving bed processes, AlChE J., 42, 154-160 (1996).
Simulation Assessment of Continuous Simulating Moving Bed Chromatography Process 609
Billiet, H. A. H., and Van der Wielen, L.A.M., Positioning of salt gradient in ion exchange SMB, AIChE J., 49, 665-674 (2003).
Jensen, T. B., Reijns, T. G. P., Billiet, H. A. H., and Van der Wielen, L.A.M., Noval simulating moving bed method for reduced solvent consumption, J. Chromatogr. A., 873, 149 –162 (2000).
Jo. S-H., Kim, J. K., Yoo, C. C., Kim, J-II., Koo, Y. M., and Mun, M., Comparative analysis of single-cascade five-zone and two-zone SMB systems for the separation of a ternary amino acids mixture, Canadian. J. Chem. Eng., 85, 874-882 (2007). Kearney, M. M. and Hieb, K. L., US patent No, 5102
(1992).
Keßler, L. C. and Morgenstern, A. S., Theoretical study of multicomponent continuous counter chromatography based on connected 4-zone units, J. Chromatogr. A., 1126, 323-337 (2006). Kim. J. K., Abunasser, N., and Wankat, P. C., Use of
two feed in simulating moving bed for binary separation, Korean J. Chem. Eng., 22, 619-627 (2005).
Kloppenburg, E. and Gilles, E. D., A new concept for operating simulating moving bed processes, Chem. Eng. Technol., 22, 813-817 (1999).
Kurup, A. S., Hidajat, K., and Ray, A. K., Comparative study of modified simulated moving bed systems at optimal conditions, ternary mixtures under nonideal conditions, Ind. Eng. Chem. Res., 45, 3902-3915 (2006).
Ludemann-Hombourger, O. A., Nicoud, R. M., and Bailly, M., The Varicol process: A new multicolumn continuous chromatographic process, Sep. Sci. Technol., 35, 1829-1862 (2000).
Ma, Z. and Wang, N.-H. L., Standing wave analysis of SMB chromatography : Linear systems, AIChE J., 43, 2488-2509 (1997).
Mata, V. G. and Rodrigues, A. E., Separation of ternary mixture by pseudo-simulating moving bed chromatography, J. Chromatogr. A., 939, 23-40 (2001).
Mazzotti, M., Storti, G., and Morbidelli, M., Optimal operation of simulating moving bed units for nonlinear chromatographic separation, J. Chromatogr. A., 769, 3-24 (1997a).
Mazzotti, M., Storti, G., and Morbidelli, M., Supercritical fluid simulating moving bed chromatography, J. Chromatogr. A., 786, 309-320 (1997b).
Migliorini, C., Wendlinger, M., Mazzotti, M., and Morbidelli, M., Temperature gradient operation
of a simulating moving bed unit, Ind. Eng. Chem. Res., 40, 2606 – 2617 (2001).
Minceva, M. and Rodrigues, A. E., Modeling and simulation of a simulated moving bed for the separation of p-xylene, Ind. Chem. Eng. Res., 41, 3454-3461 (2002).
Morgenstern, A. S., Keßler, L. C., and Kaspereit, M., New development in simulating moving bed chromatography, Chem. Eng. Technol., 31, 826-837 (2008).
Mun, S., Wang, N.-H. L., Koo, M. Y., and Yi, C. S., Pinched wave design of a four-zone simulated moving bed for linear adsorption systems with significant mass-transfer effects, Ind. Eng. Chem. Res., 45, 7241-7250 (2006).
Nicoud, R.M. and Perrut, M., French patent No, 9205 (1992).
Pais, L. S., Loureiro. J. M., and Rodrigues. A.E., Modeling, simulation and operation of a simulated moving bed for continuous chromatographic separation of 1,1-bi-2-Naphthol enantiomers, J. Chromatogr. A., 796, 25-35 (1997a).
Pais, L. S., Loureiro. J. M., and Rodrigues. A. E., Separation of 1,1-bi-2-Napthnol enantiomers by continuous chromatography in simulating moving bed, Chem. Eng. Sci., 52, 245-257 (1997b). Pais, L. S. and Rodrigues, A. E., Design of
simulating moving bed and Varicol processes for preparative separation with a lower number of columns, J. Chromatogr. A., 1006, 33-44 (2003). Paredes, G., Rhee, H. K., and Mazzotti. M., Design
of simulating moving bed chromatography with enriched extract operation (EE-SMB): Langmuir isotherm, Ind. Eng. Res., 45, 6289-6301 (2006). Rodrigues, A. E. and Pais, L. S., Design of SMB
chiral separations units using the concept of separation volume, Sep. Sci. and Tech., 39, 245-270 (2004).
Ruthven, D. M. and Ching, C. B., Counter-current and simulating counter-current adsorption separation processes, Chem. Eng. Sci,. 44, 1011-1038 (1989). Sa Gomes, P. and Rodrigues, A. E., Outlet stream
swing (OSS) and multifeed (MF) Operation of simulating moving beds, Sep. Sci. Technol., 42, 223-252 (2006).
Schramn, H., Kaspereit, M., Kienle, A., and Morgenstern, A.S., Improving simulating moving bed process by cyclic modulation of the feed concentration, Chem. Eng. Technol., 25, 1151-1155 (2002).
cyclic modulation of the feed concentration, J.
Chromatogr. A.,1006, 77-86 (2003).
Storti, G., Mazzotti, M., Morbidelli, M., and Carra, S., Robust design of binary countercurrent adsorption separation processes, AIChE J., 39, 471-492 (1993).
Storti, G., Masi, M., Carra, S., and Morbidelli, M., Simulating moving bed adsorption separation unit with a small number of ports, Proc. Int. Conf. on fundamental of adsorption, Southofen, pp. 845 (1989).
Toumi, A., Engell, S., Ludemann-Hombourger, O., Nicoud, R. M., and Bailly, M., Optimization of simulating moving bed and Varicol processes, J. Chromatogr. A., 1006, 15-31 (2003).
Wang, X. and Ching, C. B., Chiral separation of β–
blocker drug (nadolol) by five-zone simulating moving bed chromatography, Chem. Eng. Sci., 60, 1337-1347 (2005).
Wang, X. and Ching, C. B., Pore diffusion and solid diffusion models: Application in counter current chromatographic separation process, Korean J. Chem. Eng., 24, 121-126 (2007).
Wankat, P. C., Rate controlled separation. Kluwer, Amsterdam, The Netherlands, pp. 268-272 (1990). Yun, T., Zhong G., and Guiochon, G., Experimental
study of the influence of the flow rate in SMB chromatography, AIChE J., 43, 2970-2983 (1997a). Yun, T., Zhong G., and Guiochon, G., Simulating
moving bed under linear conditions: experimental vs. calculated results, AIChE J., 43, 935-945 (1997b).
Zang, Y. and Wankat, P. C., SMB Operation strategy –
Partial feed, Ind. Eng. Chem. Res., 41,
2504-2511 (2002a).
Zang, Y. and Wankat, P. C., Three zone simulating moving bed with partial feed and selective withdrawal, Ind. Eng. Chem. Res., 41, 5283-5289 (2002b).
Zhang, Z., Mazzotti, M., and Morbidelli, M., PowerFeed operation of SMB units: Changing the fluid flow rate during the switching interval, J. Chromatogr. A., 1006, 87-99 (2003a).
Zhang, Z., Hidajat, K., Ray, A. K., and Morbidelli, M., Multiobjective optimization of SMB and varicol process for chiral separation, AIChE J., 48, 2800-2816 (2002).
Zhang, Z., Mazzotti, M., and Morbidelli, M., Multiobjective optimization of simulating moving bed and varicol processes using genetic algorithm, J. Chromatogr. A., 989, 95-108 (2003b).
Zhang, Z., Mazzotti, M., and Morbidelli, M., Continuous chromatographic processes with a small number of columns: Comparison of simulated moving bed with Varicol, PowerFeed and ModiCon, Korean J. Chem. Eng., 21, 454-464 (2004a).
Zhang, Z., Morbidelli, M., and Mazzotti, M., Experimental assessment of Power Feed chromatography, AIChE J., 50, 625-632 (2004b). Zhong, G. M. and Guiochon, G., Analytical solution
for the linear ideal model of simulating moving bed chromatography, Chem. Eng. Sci., 51, 4307-4319 (1996).