Regulation of bacterioplankton density and
biomass in tropical shallow coastal lagoons
Regulação da densidade e biomassa bacterioplanctônica em lagoas costeiras tropicais rasas
Fabiana MacCord1, Fernanda Dall Ara Azevedo1, Francisco de Assis Esteves1,2 and Vinicius Fortes Farjalla1
1Instituto de Biologia, Departamento de Ecologia,Universidade Federal do Rio de Janeiro – UFRJ, Ilha do Fundão, CP 68020, CEP 21941-590, Rio de Janeiro, RJ, Brazil
e-mail: fabianamaccord@gmail.com; fdallara.azevedo@gmail.com; farjalla@biologia.ufrj.br 2Núcleo de Pesquisas em Ecologia e Desenvolvimento Sócio-ambiental de Macaé – NUPEM,
Universidade Federal do Rio de Janeiro – UFRJ, Av. Rotary Club, s/n, São José do Barreto, CEP 28970-000, Macaé, RJ, Brazil
e-mail: festeves@biologia.ufrj.br
Abstract:Aim: Estimating bacterioplankton density and biomass and their regulating factors is important in order to evaluate aquatic systems’ carrying capacity, regarding bacterial growth and the stock of matter in the bacterial community, which can be consumed by higher trophic levels. We aim to evaluate the limnological factors which regulate - in space and time - the bacterioplankton dynamics (abundance and biomass) in five tropical coastal lagoons in the state of Rio de Janeiro, Brazil. Method: The current study was carried out at the following lagoons: Imboassica, Cabiúnas, Comprida, Carapebus and Garças. They differ in morphology and in their main limnological factors. The limnological variables as well as bacterioplankton abundance and biomass were monthly sampled for 14 months. Model selection analyses were performed in order to evaluate the main variables regulating the bacterioplankton’s dynamics in these lagoons.
Result: The salt concentration and the “space” factor (i.e. different lagoons) explained great part of the bacterial density and biomass variance in the studied tropical coastal lagoons. When the lagoons were analyzed separately, salinity still explained great part of the variation of bacterial density and biomass in the Imboassica and Garças lagoons. On the other hand, phosphorus concentration was the main factor explaining the variance of bacterial density and biomass in the distrophic Cabiúnas, Comprida and Carapebus lagoons. There was a strong correlation between bacterial density and biomass (r2 = 0.70, p < 0.05), indicating that bacterial biomass variations are highly dependent on bacterial density variations. Conclusion: (i) Different limnological variables regulate the bacterial density and biomass in the studied coastal lagoons, (ii) salt and phosphorus concentrations greatly explained the variation of bacterial density and biomass in the saline and distrophic lagoons, respectively, and (iii) N-nitrate and chlorophyll-a concentrations, water color and mean depth are important factors to explain bacterial density and biomass variance in some specific lagoons.
Keywords: bacterioplankton, bottom-up regulation, phosphorus limitation, salinity, tropical coastal lagoons, model selection analysis.
precipitation to evaporation balance, surface heat balance and respond differently to these forcing functions (Kjerfve, 1994). The geomorphometry of the lagoon (type and form) reflects the rates of sea–freshwater exchanges and the influence of surrounding terrestrial ecosystems: shore-parallel oriented lagoons are usually more influenced by marine water than shore-perpendicular oriented ones and lagoons with small area have a great perimeter/volume ratio and are strongly influenced by surrounding terrestrial ecosystem (Wetzel, 1990; Kjerfve, 1994). These differences among lagoons result in a wide spectrum of limnological features (see review at Esteves et al., 2008) which, in turn, influence the microbial community. For instance, pollution and salt concentrations are the major regulating factors of the structure of bacterial communities in coastal lagoons (Fontes and Abreu, 2009; Laque et al., 2010; Salloto et al., 2012; They et al., 2013). Bacterial density is related to salinity, water temperature and light in a Brazilian subtropical coastal lagoon (Fontes and Abreu, 2009), while the input of nutrients indirectly influenced the bacterial biomass in a Colombian hypertrophic lagoon (Gocke et al., 2004). In an experimental study, Farjalla et al. (2002a) observed that phosphorus and the quality of dissolved organic matter limit bacterial production is coastal lagoons of Rio de Janeiro State, but, so far, no study was performed relating the temporal changes in the bacterial density and biomass to the environmental characteristics of the tropical coastal lagoons of the Rio de Janeiro State, Brazil.
The current study evaluated bacterial density and biomass as well as several limnological variables of 5 tropical costal lagoons in the state of Rio de Janeiro during a 14 month period of time. These lagoons are different in terms of geomorphology, river inputs, sewage disposal and connectivity to the ocean; resulting in broad ranges
1. Introduction
Bacterioplankton are historically related to dead organic matter decomposition and to inorganic nutrients release in the environment. More recently, bacterioplankton were also incorporated to planktonic food webs, through the microbial loop concept (Pomeroy, 1974; Azam et al. 1983). According to such concept, planktonic bacteria incorporate dissolved organic matter into bacterial biomass, which is consumed by higher trophic level organisms, such as protozoa, rotifers and cladocerans. Estimating bacterial numbers and biomass is important in order to evaluate aquatic ecosystems’ carrying capacity regarding bacterial growth and the stock of matter and energy in the bacterial community. For instance, it is well established that bacteria hold most of the planktonic biomass in the aquatic oligotrophic ecosystems (e.g.
del Giorgio and Gasol, 1995; Gasol et al., 1997). However, just some studies on such subject were performed in tropical inland aquatic ecosystems (e.g. Roland et al., 2010) and only a few of them were done in coastal lagoons (Abreu et al., 1992; Farjalla et al., 2002a; Gocke et al., 2004; Fontes and Abreu, 2009; Hsieh et al., 2012; They et al., 2013). In a recent review, Amado et al. (2013) observed that bacterioplankton respiration is higher in tropical inland ecosystems than it is in temperate ones, suggesting that there are differences of bacterial dynamics between tropical and temperate aquatic ecosystems. Amado et al. (2013) also highlighted the need for more studies focusing on bacterioplankton dynamics in tropical ecosystems in order to better understand the role played by such community in the aquatic ecosystems.
Coastal lagoons are shallow inland water bodies wholly or partly sealed off from the adjacent coastal ocean by a narrow sand barrier. Coastal lagoons are influenced by river input, ties, wind stress,
da variação da densidade e biomassa bacterianas nas lagoas Imboassica e Garças. Por outro lado, a concentração de fósforo foi o principal fator regulador da densidade e biomassa bacterianas nas lagoas Cabiúnas, Comprida e Carapebus. Houve uma forte correlação entre a densidade a biomassa bacterianas (r2 = 0,70, p < 0,05), indicando que variações na biomassa bacteriana são altamente dependentes das variações na densidade bacteriana. Conclusão: (i) Diferentes variáveis limnológicas regulam a densidade e biomassa bacterianas nas lagoas costeiras estudadas, (ii) as concentrações de sais e fósforo explicaram a maior parte da variação da densidade e biomassa e bacterianas nas lagoas salinas e distróficas, respectivamente, (iii) As concentrações de N-nitrato e clorofila-a, a coloração da água e a profundidade média da lagoa são importantes fatores que explicam a variação na densidade e abundância bacterianas em alguns casos específicos.
2.2. Sampling and analytical procedures
Sub-surface water samples (10-20 cm depth) were monthly collected with acid-cleaned plastic bottles in the central limnetic region of all lagoons, from June 2002 up to July 2003. Basic limnological variables were measured immediately in the field, such as depth and Secchi Disc depth, temperature, salinity and electrical conductivity (digital sensor Thermistor YSI-30). Water samples were collected to determine pH (pHmeter Analion PM-630), alkalinity by the method of Carmouze (1994) and dissolved oxygen concentration by the Winlkler method modified by Golterman et al. (1978).
Sub-samples were filtered on Whatman GF/C filters (0.7 µm pore size), which were used to measure chlorophyll-a, after extraction with ethanol and absorbance measurements (Nusch and Palme, 1975). The filtered water was used to evaluate the water color and nutrient concentrations. Absorbance measures at 430 nm were performed as an indicator of water color characteristics. Soluble reactive phosphorous (SRP) and total dissolved phosphorus concentrations were determined by the ascorbic acid-molybdate reaction before and after acid-digestion and autoclavation, respectively (Golterman et al., 1978). Dissolved nitrogen concentrations were obtained through digestion and distillation by using the Kjeldahl method (Mackereth et al., 1978). N-nitrate concentrations were determined by a Flow Injection Analysis System (FIA – Asia Ismatec) (Zagatto et al., 1980) and the N-ammonium was determined by a spectrophotometer after applying a blue indophenol method (Koroleff, 1978). Rainfall data were obtained from a meteorological station located in a local farm located nearby the lagoons.
In order to determine bacterial numbers, 18 mL sub-samples were fixed with 3.7% buffered formaline in-site (Hobbie et al., 1977). 1 mL replication aliquots were filtered on 0.2 µm Nucleopore membranes in the laboratory, which were stained for 10 minutes using 0.01% acridine orange. By using a Zeiss epifluorescence microscopy, bacteria were counted in 40 chosen fields and separated in three classes (rods, cocci and vibrius) for measurements and estimation of biovolume (Fry, 1990) and conversion to biomass through the factor of 0.0056 g C µm–3 proposed by Bratbak (1985).
2.3. Data analysis
All data, except pH, were log transformed in order to meet homoscedasticity requirements and a normal distribution (Shapiro-Wilks test). of limnological conditions. Model selection analyses
were performed in order to assess what variables could better predict bacterial density and biomass variances in the studied lagoons. We hypothesized that different factors would regulate the variation of bacterial density and biomass among the lagoons.
2. Material and Methods
2.1. Study area
The current study was carried out at Imboassica, Cabiúnas, Comprida, Carapebus and Garças lagoons, which are located on the coastal sand plain of northern Rio de Janeiro State, Brazil (22°-22° 30’ S and 41° 30’-42° W). Those are shallow lagoons (depths below 3 m) with surface areas of 3.26, 0.34, 0.13, 6.50 and 0.96 km2, respectively, and are separated from the sea by a ~ 20 m length sandbar. A detailed map of the region can be at Di Dario et al. (in press - this volume). The climate in the region is warm and humid, with mean annual temperatures of 26.6 °C and rainfall concentration between October and March.
Cabiúnas, Comprida and Carapebus lagoons have a dendritic shape (resulting in a high surface/ volume ratio) with their main axis perpendicular to the sea. These lagoons are much influenced by natural surrounding bushy vegetation (Restinga
3. Results
The limnological parameters varied between lagoons and within lagoons throughout time (Table 1). Cabiúnas lagoon was the deepest, while Garças was the shallowest lagoon. The lagoons showed a strong salt concentration gradient, in which Garças lagoon showed the greatest values and Cabiúnas e Comprida the lowest ones. Garças lagoon also showed the highest concentrations of total dissolved phosphorous, soluble reactive phosphorus (SRP) and N-nitrate. Imboassica presented the highest chlorophyll-a concentration while Comprida lagoon showed the darkest color (Table 1).
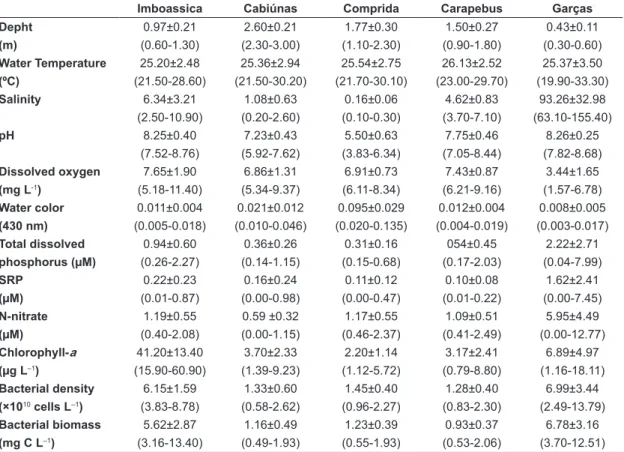
Bacterioplankton abundance varied around ×1010 cells L–1 in all lagoons with the highest values in Garças (maximum value of 13.79 ×10¹⁰ cells L–1, March/2003) and Imboassica lagoons (maximum value of 8.73 ×10¹⁰ cells L–1, December/2002) and the lowest values in Cabiúnas (minimum value of 0.58 ×10¹⁰ cells L–1, October/2002) Comprida (minimum value of 0.96 ×10¹⁰ cells L–1, November/2002) and Carapebus lagoons (minimum value of 0.83 ×10¹⁰ cells L–1, A simple linear regression was performed aiming
to relate bacterial density and biomass data from the five lagoons. A model selection test (Akaike’s Information Criterion) was used to investigate the relations between bacterial abundance and biomass with explanatory variables, and spatial and temporal categorical factors. Spatial and temporal categorical factors were based on samples from different lagoons (named as “space”) and different sampling months (named as “time”). We also performed model selection tests for data sets from each lagoon in order to evaluate specific dynamics for each ecosystem. AIC objectively identifies the model which holds more information while still being parsimony. AIC values, by themselves, are relatively uninformative, so AIC values differences among the best-fitting model and all other models (Δ) and their AIC weights (Wi) were also calculated. Models with Δ < 2 are likely to be the best model, once higher Wi values indicate models that hold more data support. We used SAM v3.0 (Spatial Analysis in Macroecology - Rangel et al., 2006), and 95% confidence level to set statistical significance.
Table 1. Mean±standard deviation, (minimum-maximum) value of the limnological variables, bacterial density and biomass in Imboassica, Cabiúnas, Comprida, Carapebus and Garças lagoons. Only limnological variables selected by the AIC models (see Tables 2 and 3) are shown.
Imboassica Cabiúnas Comprida Carapebus Garças Depht 0.97±0.21 2.60±0.21 1.77±0.30 1.50±0.27 0.43±0.11
(m) (0.60-1.30) (2.30-3.00) (1.10-2.30) (0.90-1.80) (0.30-0.60)
Water Temperature 25.20±2.48 25.36±2.94 25.54±2.75 26.13±2.52 25.37±3.50
(ºC) (21.50-28.60) (21.50-30.20) (21.70-30.10) (23.00-29.70) (19.90-33.30)
Salinity 6.34±3.21 1.08±0.63 0.16±0.06 4.62±0.83 93.26±32.98
(2.50-10.90) (0.20-2.60) (0.10-0.30) (3.70-7.10) (63.10-155.40)
pH 8.25±0.40 7.23±0.43 5.50±0.63 7.75±0.46 8.26±0.25
(7.52-8.76) (5.92-7.62) (3.83-6.34) (7.05-8.44) (7.82-8.68)
Dissolved oxygen 7.65±1.90 6.86±1.31 6.91±0.73 7.43±0.87 3.44±1.65
(mg L-1) (5.18-11.40) (5.34-9.37) (6.11-8.34) (6.21-9.16) (1.57-6.78)
Water color 0.011±0.004 0.021±0.012 0.095±0.029 0.012±0.004 0.008±0.005
(430 nm) (0.005-0.018) (0.010-0.046) (0.020-0.135) (0.004-0.019) (0.003-0.017)
Total dissolved 0.94±0.60 0.36±0.26 0.31±0.16 054±0.45 2.22±2.71
phosphorus (µM) (0.26-2.27) (0.14-1.15) (0.15-0.68) (0.17-2.03) (0.04-7.99)
SRP 0.22±0.23 0.16±0.24 0.11±0.12 0.10±0.08 1.62±2.41
(µM) (0.01-0.87) (0.00-0.98) (0.00-0.47) (0.01-0.22) (0.00-7.45)
N-nitrate 1.19±0.55 0.59 ±0.32 1.17±0.55 1.09±0.51 5.95±4.49
(µM) (0.40-2.08) (0.00-1.15) (0.46-2.37) (0.41-2.49) (0.00-12.77)
Chlorophyll-a 41.20±13.40 3.70±2.33 2.20±1.14 3.17±2.41 6.89±4.97
(µg L–1) (15.90-60.90) (1.39-9.23) (1.12-5.72) (0.79-8.80) (1.16-18.11)
Bacterial density 6.15±1.59 1.33±0.60 1.45±0.40 1.28±0.40 6.99±3.44
(×1010 cells L–1) (3.83-8.78) (0.58-2.62) (0.96-2.27) (0.83-2.30) (2.49-13.79)
Bacterial biomass 5.62±2.87 1.16±0.49 1.23±0.39 0.93±0.37 6.78±3.16
variables: water depth, salinity, water color, total dissolved phosphorous and N-nitrate concentrations as well as the “space” categorical factor (model 1d; Table 2). Other models with similar explanation power (models 2d, 3d and 7d; Table 3) included SRP and chlorophyll-a concentrations and “time” and “space cross time” categorical factors. Particularly, salinity and the “space” factor showed maximum importance rates (1.00) among a full set of models.
The best AIC selected model for bacterial biomass in all lagoons accounted for 82.6% of bacterial biomass variation, and included the following variables: water depth, water color, salinity and the “space” categorical factor (model 1b; Table 3). Other models holding similar explanation power (models 2b, 3b, 4b, 7b, 9b, 10b and 14b; Table 2) August/2002) (Figure 1A). Bacterioplankton
biomass showed the highest values in Imboassica (13.40 mg C L–1, June/2002) and Garças lagoons (12.51 mg C L–1, April/2003) (Figure 1B) and the lowest values in Cabiúnas (0.49 mg C L–1, October/2002), Comprida (0.55 mg C L–1, November/2002) and Carapebus lagoons (0.53 mg C L–1, June/2003) (Figure 1B). Finally, bacterial biomass was related with bacterial density among lagoons (r2 = 0.70, p < 0.05) and this relation was particularly strong for the three dendritic-shaped lagoons (Cabiúnas, Comprida and Carabepus, pers. obser. Figure 1A and B).
The best AIC selected model for bacterial density in all lagoons accounted for 88.9% of bacterial density variation and included the following
Figure 1. Bacterioplankton density (A) and biomass (B) in the five lagoons studied during fourteen consecutive months (June/2002 to July/2003). Legend: ○ = Imboassica lagoon, ■ = Cabiúnas lagoon, ▲= Comprida lagoon, ♦ = Carapebus lagoon,*= Garças lagoon.
Table 2. Akaike’s models for bacterial density and biomass in all five lagoons together. The explanatory variables used for the analysis were the limnological variables plus the categorical factors “space”, “time” and “space cross time”. The analysis generated 7 and 14 substantial models, for bacterial density and biomass respectively, according to the Δi criterion (Δi ≤ 2 have high level of empirical support), but in this table the models with repeated combinations were omitted. The importance values of variables of the best model are given below the table in decreasing order of impor-tance. Legend: r2 = coefficient of determination, AICc = second-order Akaike Information Criterion, ΔAICc = AICc differences, wi = Akaike’s weight.
Response variable Model Variables r2 AICc ∆AICc w
i
Bacterial densityA
1d Depth, Sal, Color, P-dis, Nitrate, space 0.889 –151.17 0 0.050
2d Depth, Sal, Color, P-dis, Nitrate, space× time 0.889 –151.11 0.055 0.049
3d Depth, Sal, Color, P-dis, Nitrate, space 0.884 –150.55 0.619 0.037
7d Depth, Sal, Color, Nitrate, SRP, Chlo-a, time 0.890 –149.17 1.998 0.018
Bacterial biomassB
1b Depth, Sal, Color, space 0.826 –122.40 0 0.025
2b Depth, Sal, Color, P-dis, space 0.831 –121.91 0.491 0.020
3b Depth, Sal, Color, space, space × time 0.831 –121.86 0.541 0.019
4b Depth, Sal, Color, P-dis, OD, space 0.837 –121.85 0.550 0.019
7b Depth, Sal, Color, Chlo-a, space 0.829 –120.96 1.442 0.012
9b Depth, Sal, Color, P-dis, SRP, space 0.835 –120.82 1.584 0.012
10b Depth, Sal, Color, Nitrat, space 0.829 –120.79 1.600 0.011
14b Depth, Sal, Color, Chlo-a, space, time 0.834 –120.42 1.979 0.009
indicating less, or secondary, influence on bacterial dynamics in this system.
Regarding the Cabiúnas lagoon, the best models included water color and SRP concentration, accounting for 64% of bacterial density variation (model C1
d; Table 3), and water color accounting for 41.2% of bacterial biomass variation (models D1
b; Table 3). The second-best model to explain the bacterial biomass variance (indistinguishable from the first one, according to the Akaike’s weight) also included SRP concentration and accounted for 55.1% of bacterial biomass variation (models D2
b; Table 3). Water color presented the highest importance in order to explain both bacterial density and biomass (0.63 and 0.61, respectively), and was followed by the SRP concentration (0.50 and 0.42, respectively). The N-nitrate concentration and “time” factor also appeared in other selected models, but presenting lower importance rates (Table 3).
also included the concentration of total dissolved phosphorous, dissolved oxygen, SRP and the “time” and “space cross time” factors. Salinity showed the maximum importance rate (1.00) among a full set of models, followed by the “space” factor (0.99).
Different variables explained the bacterial density and biomass variation among different lagoons (Table 3), which was expected because of the great importance of the “space” factor, when analyzing the full data set (Table 2). Regarding the Imboassica lagoon, the best models included salinity, accounting for 64.3% of bacterial density variation (model A1
d; Table 3), as well as salinity and N-nitrate, accounting for 53.5% of bacterial biomass variation (models B1
b; Table 3). For both bacterial density and biomass, salinity appeared in all the selected models and showed the highest importance rates (0.96 and 0.74). Other variables, such as N-nitrate, total dissolved phosphorous and chlorophyll-a showed low importance rates,
Table 3. Akaike’s models for bacterial density and biomass in individual lagoons. The explanatory variables used for the analysis were the limnological variables plus the categorical factor “time”. The importance values of variables of the best model are given below the table in decreasing order of importance. Legend: r2 = coefficient of determination, AICc = second-order Akaike Information Criterion, ΔAICc = AICc differences, wi = Akaike’s weight.
Lagoon Response variable Model Variables r2 AICc ∆AICc w i
Imboassica
Bacterial densityA
1d Sal 0.643 -36.06 0 0.259
2d Sal, P-dis 0.710 –34.89 1.165 0.145
3d Sal, Chlo-a 0.693 –34.12 1.930 0.099
Bacterial biomassB 1b Sal, Nitrate 0.535 –15.15 0 0.105
2b Sal, P-dis 0.518 –14.65 0.508 0.081
Cabiúnas
Bacterial densityC 1d Color, SRP 0.640 –35.78 0 0.160
2d Color, time 0.599 –34.26 1.521 0.075
Bacterial biomassD
1b Color 0.412 –35.98 0 0.185
2b Color, SRP 0.551 –35.72 0.261 0.182
3b Nitrate 0.345 –34.49 1.498 0.088
Comprida Bacterial density
E 1
d SRP 0.304 –42.15 0 0.207
Bacterial biomassF 1
b SRP 0.170 –37.47 0 0.202
Carapebus
Bacterial densityG 1d P-dis, SRP, time 0.750 –46.28 0 0.222
2d P-dis, time 0.609 –45.04 1.234 0.120
Bacterial biomassH 1b P-dis, SRP, time 0.791 –54.60 0 0.295
2b P-dis, SRP, Sal, Nitrate 0.905 –54.05 0.555 0.224
Garças
Bacterial densityI 1d Sal 0.435 –12.17 0 0.177
2d Sal, Depht, P-dis, Nitrate 0.661 –10.21 1.953 0.067
Bacterial biomassJ 1b Sal, Depht, time 0.809 –20.34 0 0.452
2b Sal, Depht, P-dis, time 0.869 –19.16 1.183 0.250
Salt concentration is a strong ecological filter, structuring aquatic communities and regulating ecosystem processes in coastal ecosystems (Mouillot et al., 2007). For instance, salt concentration was a main driven factor for bacterial, zooplankton, benthic and fish community compositions and CH4 production in tropical coastal lagoons (Laque et al., 2010; Setubal et al., in press - this volume; Di Dario et al., in press - this volume; Petruzzella et al., in press - this volume). Estuarine and coastal organisms cope with salt concentration changes through energy-costly osmoregulation. Each organism presents a salt concentration optimum; concentration much lower or higher than this optimum will inhibit organism reproduction, growth or even the establishment in the aquatic system. Species found in a saline ecosystem would be influenced by their own capabilities and the capability of their possible competitors and predators to deal with the stress caused by temporal and spatial changes in the salt concentration (Rodríguez-Climent et al., 2013). Organism dispersal capability and phenotypic plasticity are usually correlated to size: the smallest organisms have greater dispersal capability and greater phenotypic plasticity in comparison to the biggest ones (Fenchel and Finlay, 2004). Therefore, in aquatic ecosystems experiencing temporal fluctuations in their salt concentration, it is expected: 1) great changes in the community composition throughout time (or space); 2) extinction of species that hold low tolerance (or low phenotypic plasticity); 3) species colonization in accordance to the species’ size in the aquatic ecosystems experiencing changes in their salt concentration.
Tropical coastal lagoons studied here experience temporal and/or spatial changes in salt concentration (Caliman et al., 2010). Underground saltwater intrusion in high tide periods, aboveground saltwater intrusion via wave action during ocean storms and natural or anthropic sandbar openings provide unpredictable temporal and spatial changes in salt concentrations within and among tropical coastal lagoons (Esteves et al., 2008). Either aquatic bacteria tolerate small changes in salt concentrations due to their great trait plasticity or colonization of bacterial cells adapted to new salt concentrations is usually fast due to their small size. On the other hand, bacterial predators, such as flagellates, ciliates and microcrustaceans, are less tolerant to changes in salt concentration and have a smaller dispersal capability. Therefore, the The bacterial density and biomass variance
in Comprida lagoon were better related to SRP concentration in the water column (models E1
d and F1
b; Table 3), despite the fact that the total variance explained by both models was low (30.4% and 17%, respectively). Regarding the Carapebus lagoon, the best AIC model to explain the bacterial density and biomass variance (models G1
d and H1b; Table 3) included the SRP and total dissolved phosphorous concentrations as well as the “time” categorical factor, and accounted for 75% and 79.1% of total bacterial density and biomass variance, respectively. The dissolved phosphorous rated the highest importance rates (0.84 and 0.99) in order to explain bacterial density and biomass, respectively. It was followed by “time” (0.62) and SRP concentration (0.46) for bacterial density and by SRP concentration (0.82) for bacterial biomass. N-nitrate and salinity appeared in other selected models aiming to explain bacterial biomass in Carapebus lagoon (model H2
b; Table 3), but rating low importance rates.
Salinity accounted for 43.5% of bacterial density variation (model I1
d; Table 3), and salinity, water depth and “time” accounted for 80.9% of bacterial biomass variation in Garças lagoon (model J1
b; Table 3). Salinity showed the highest importance rates (0.99 and 0.93), followed by water depth (0.61 and 0.99), in explaining bacterial density and biomass, respectively (Table 3). The “time” factor also showed a high importance rate (0.98) to explain bacterial biomass in Garças lagoon.
4. Discussion
phosphorus from the water (Panosso and Esteves, 1999).
Besides phosphorus concentration, N-nitrate concentration and water color were included in additional models to explain bacterial density and biomass in Carapebus and Cabiúnas lagoons, respectively. Low concentrations of nitrogen seldom limit bacterial growth in freshwater ecosystems, but there are some exceptions (e.g. Rejas et al., 2005; Haubrich et al., 2009). Most of the nitrogen in an aquatic ecosystem is observed in its organic form (dissolved or particulate) and only a small fraction of it is readily available for bacterial growth (Stepanauskas et al., 2000). Therefore, despite the fact that the nitrogen concentration not usually limits bacterial growth, nitrogen availability may limit bacterial growth in some systems, explaining the importance of N-nitrate concentration on the bacterial density and biomass variance in Carapebus lagoon.
The water color indicates the amount of colored organic matter in the aquatic systems. Colored organic matter is mostly composed by humic substances that are characterized by long and complex carbon molecules with limited availability to bacterial growth (Steinberg et al., 2006). Humic substances are particularly abundant in the coastal lagoons in the state of Rio de Janeiro, rating concentrations above 200 mg L–1 (Farjalla et al., 2009a). In some previous experiments, bacterial growth was observed to be limited by the quality of the carbon bulk (Farjalla et al. 2002a) and by additions of labile substrates or by carbon exposure to sunlight, enhance the consumption of humic substances by bacteria (Amado et al., 2007; Farjalla et al., 2009b). Thus, the quality of carbon bulks - represented here by the water color - might be a major factor limiting the bacterial growth in these coastal lagoons in some specific situations, explaining the presence of the water color in some predicting models of bacterial density and biomass.
In general, we observed high bacterial abundance and biomass in these tropical coastal lagoons (Table 1; Figure 1) in comparison to other bacterial dynamic surveys in tropical aquatic ecosystems (e.g. Roland et al., 2010). Bacterial abundance and biomass were particularly high in the brackish Imboassica lagoon and in the hypersaline Garças lagoon, rating numbers 10 to 100 times higher than values commonly observed in the literature (Roland et al., 2010). We suggest that such high bacterial abundance and biomass are related to high nutrient concentration in the ecosystems (sewage predation pressure on bacterial communities should
be lower in aquatic ecosystems that experience changes in the salt concentration, so bacteria should keep higher densities and biomass, as observed in Garças and Imboassica lagoons (Table 1, Figure 1). This latter hypothesis was not evaluated here and needs further investigation in these lagoons. In addition, temporal changes in salt concentration is related to water evaporation (decrease in water depth) in shallow lagoons if no significant seawater input is observed (see Laque et al., 2010). Besides increasing salt concentrations, water evaporation also concentrates inorganic nutrients, carbon substrates and organisms, what explains the secondary importance of water depth and N-nitrate over the bacterial density and biomass variation in Garças lagoon.
Sewage is disposed in Imboassica lagoon which results in higher chlorophyll-a (mean value of 41.20 µg L–1), dissolved oxygen concentrations (maximum of 11.40 mg L–1) and alkaline pH (mean value 8.25) among the five lagoons. Such great phytoplankton abundance would explain the “normal” dissolved nutrients concentration in the water column, despite the sewage disposal in the system. Chlorophyll-a and nutrient concentrations partially explained the bacterial density and biomass variance in Imboassica lagoon (Table 3). On one hand, phytoplankton competes with bacterial cells for inorganic nutrients (Rejas et al., 2005) but on the other hand, phytoplankton exudates great amounts of labile organic molecules in the water column, which can stimulate bacterial growth (Romero-Castillo et al., 2011), explaining the importance of chlorophyll-a and nutrients to the bacterial density and biomass variance in this high chlorophyll-a system. Such relation between phytoplankton and bacterial abundance was previously observed in tropical inland aquatic ecosystems using a large data set (Roland et al., 2010).
ecosystems. Aquatic Microbial Ecology, vol. 49, no. 1, p. 25-34.
AMADO, AM., MEIRELLES-PEREIRA, F., VIDAL, LO., SARMENTO, H., SUHETT, AL., FARJALLA, VF., COTNER, JB. and ROLAND, F. 2013. Tropical freshwater ecosystems have lower bacterial growth efficiency than temperate ones. Frontiers in Microbiology, vol. 4, p. 167.
AZAM, F., FENCHEL T., FIELD J.G., GRAY, JS., MEYER-REIL LA. and THINGSTASD, F. 1983. The ecological role of water microbes in the sea.
Marine Ecology Progress Series, vol. 10, p. 257-263. http://dx.doi.org/10.3354/meps010257
BRATBAK, G. 1985. Bacterial biovolume and biomass estimations. Applied and Environmental Microbiology. vol. 49, no. 6, p. 1488-1493.
CALIMAN, A., CARNEIRO, LS., SANTANGELO, JM., GUARIENTO, RD., PIRES, APF., SUHETT, AL., QUESADO, LB., SCOFIELD,V., LOPES,PM., SANCHES,LF., AZEVEDO, FD., MARINHO, CC., BOZELLI, RL., ESTEVES, FA. and FARJALLA, VF. 2010. Temporal coherence among tropical coastal lagoons: a search for patterns and mechanisms. Brazilian Journal of Biology, vol. 70, no. 3, p 803-814. http://dx.doi.org/10.1590/S1519-69842010000400011
CARMOUZE, JP. 1994. O metabolismo dos ecossistemas aquáticos: fundamentos teóricos, métodos de estudo e análises químicas. São Paulo: Ed. Edgard Blücher. DEL GIORGIO PA. and GASOL, JM. 1995. Biomass
distribution in freshwater plankton communities. The American Naturalist, vol. 146, p. 135-152. http:// dx.doi.org/10.1086/285790
DI DARIO, F., PETRY, AC., PEREIRA, MMS., MINCARONE, MM., AGOSTINHO, LS., CAMARA, ES., CARAMASCHI, EP. and BRITTO, MR. In press. An update on the fish composition (Teleostei) of the coastal lagoons of the Restinga de Jurubatiba National Park and the Imboassica Lagoon, northern Rio de Janeiro State. Acta Limnologica Brasiliensia.
ELSER, JJ., STABLER, LB. and HASSET, RP. 1995. Nutrient limitation of bacterial growth and rates of bacteriovory in lakes and oceans: a comparative study.
Aquatic Microbial Ecology, vol. 9, p. 105-110. http:// dx.doi.org/10.3354/ame009105
ESTEVES, FA., CALIMAN, A., SANTANGELO, JM., GUARIENTO, RD., FARJALLA, VF. and BOZELLI, RL. 2008. Neotropical coastal lagoons: An appraisal of their biodiversity, functioning, threats and conservation management. Brazilian Journal of Biology, vol. 68, no. 4, p. 967-981. http://dx.doi. org/10.1590/S1519-69842008000500006
FARJALLA, VF., FARIA, BM. and ESTEVES, FA. 2002a. The relationship between DOC and planktonic bacteria in tropical coastal lagoons. Archiv
input in Imboassica lagoon and concentration by evaporation in Garças lagoon) and to the possible predation pressure decrease due to salinity changes.
We are aware that some other factors yet not evaluated in this study could have influenced bacterial density and biomass in the studied lagoons. For instance, carbon concentration was not evaluated by the present study but it was pointed out as an important factor to regulate bacterial growth in some aquatic ecosystems. It seems not to be the case of these particular lagoons, once carbon concentration has been extensively measured in these ecosystems and rates are always high (> 8 mg C–1
, see review in Farjalla et al., 2009a). Bacterial density and biomass was sampled along with the limnological variables but there may be some time elapsed between the influence of some factors (e.g. nutrient concentration) and the organism response (acclimatization to new conditions and physiological response).
In summary, our results showed for these coastal lagoons that: (i) salt concentration and the spatial variation, linked to some individual limnological characteristics of each lagoon, can be considered the main source of variation in bacterial density and biomass, (ii) phosphorus concentrations explained great part of the variance of bacterial density and biomass in dendritic coastal lagoons and (iii) concentrations of N-nitrate and chlorophyll-a, water color and water depth are important factors explaining part of the variance bacterial density and biomass of some specific lagoons.
Acknowlegments
This research was supported by subsidies from the Brazilian Research Council (CNPq) and PETROBRAS. CAPES provided post-graduation scholarships to the F.M. and the F.D.A. CNPq productivity grants to V.F.F and F.A.E are gratefully acknowledged.
References
ABREU, PC., BIDDANDA, BB. and ODEBRECHT, C. 1992. Bacterial dynamics of the Patos Lagoon estuary, southern Brazil (32°S, 52°W): Relationship with phytoplankton production and suspended material. Estuarine, Coastal and Shelf Science, vol. 35, no. 6, p. 621-635. http://dx.doi.org/10.1016/S0272-7714(05)80043-5
Community metabolism in a tropical lagoon: carbon cycling and autotrophic ecosystem induced by a natural nutrient pulse. Environmental Engineering Science, vol. 29, no. 8, p. 776-782. http://dx.doi. org/10.1089/ees.2011.0252
JANSSON, M., BERGSTRÖM, AK., LYMER, D., VREDE, K. and KARLSSON, J. 2006. Bacterioplankton growth and nutrient use efficiencies under variable organic carbon and inorganic phosphorous rations. Microbial Ecology, vol. 52, p. 358-364. http://dx.doi.org/10.1007/s00248-006-9013-4
KJERFVE, B. 1994, Coastal lagoons. In KJERFVE, B., ed. Coastal Lagoon Processes. Amsterdam: Elsevier Science. p. 1-8. http://dx.doi.org/10.1016/S0422-9894(08)70006-0
KOROLEFF, F. 1978. Determination of ammonia. In GRASSHOFF, K., EHRHARDT, M. and REMLING, K., eds. Methods of Seawater Analysis. Verlag Chemie, Republic of Germany. p. 151-157. LAQUE, T., FARJALLA, VF., ROSADO, AS. and
ESTEVES, FA. 2010. Spatiotemporal variation of bacterial community composition and possible controlling factors in tropical shallow lagoons.
Microbial Ecology, vol. 59, no. 4, p. 819-829. http:// dx.doi.org/10.1007/s00248-010-9642-5
MACKERETH, FJH., HERON, J. and TALLING, JF. 1978. Water analysis: some revised methods for limnologists. Freshwater Biological Association, Scientific Publication. no. 36.
MOUILLOT, D., DUMAY, O. and TOMASIS, JA. 2007. Limiting similarity, niche filtering and functional diversity in coastal lagoon fish communities. Estuarine, Costal and Shelf Science, vol. 71, p. 443-456. http://dx.doi.org/10.1016/j. ecss.2006.08.022
NUSCH, EA. and PALME, G. 1975. Biologische
Methoden für die Praxis der Gewässeruntersuchung.
Gewässer/Abwässer, vol. 116, p. 562-565.
PANOSSO, R. and ESTEVES, FA. 1999. Phosphatase activity and plankton dynamics in two tropical coastal lagoons. Archiv Für Hydrobiologie, vol. 146, no. 3, p. 341-354.
PETRUZZELLA, A., MARINHO CC., SANCHES, LF., MINELLO, M. and ESTEVES, FA. In press. Methane in tropical coastal lagoons: an appraisal of their variability and magnitude. Acta Limnologica Brasiliensia.
POMEROY, LR. 1974. The ocean’s food web, a changing paradigm. Bioscience, vol. 24, p. 499-504. http:// dx.doi.org/10.2307/1296885
RANGEL, TFLVB., DINIZ-FILHO, JAF. and BINI, LM. 2006. Towards an integrated computational tool for spatial analysis in marcoecology and biogeography. Global Ecology and Biogeography,
Für Hydrobiologie, vol. 156, p. 97-119. http://dx.doi. org/10.1127/0003-9136/2002/0156-0097
FARJALLA, VF., ESTEVES, FA., BOZELLI, RL. and ROLAND, F. 2002b. Nutrient limitation of bacterial production in clear water Amazonian ecosystems.
Hydrobiologia, vol. 498, p. 197-205.
FARJALLA, VF., AMADO, AM., SUHETT, AL. and MEIRELLES-PEREIRA, F. 2009a. DOC removal paradigms in highly humic aquatic ecosystems.
Environmental Science and Pollution Research, vol. 16, no. 5, p. 531-538. http://dx.doi.org/10.1007/ s11356-009-0165-x
FARJALLA, VF., MARINHO, CC., FARIA, BM., AMADO, AM., ESTEVES, FD., BOZELLI, RL. and GIROLDO, D. 2009b. Synergy of fresh and accumulated organic matter to bacterial growth.
Microbial Ecology, vol. 57, no.4, p. 657-666. http:// dx.doi.org/10.1007/s00248-008-9466-8
FENCHEL, T. and FINLAY, J. 2004. The ubiquity of small species: patterns of local and global diversity.
American Institute of Biological Sciences, vol. 54, no. 8, p. 777-784.
FONTES, MLS. and ABREU, PC. 2009. Spatiotemporal variation of bacterial assemblages in a shallow subtropical coastal lagoon in Southern Brazil.
Microbial Ecology, vol. 58, no. 1, p. 140-152. http:// dx.doi.org/10.1007/s00248-008-9454-z
FRY, JC. 1990. Direct and biomass estimation. Methods in Microbiology, vol. 22, p. 41-85.
GASOL, JM., DEL GIORGIO, PA. and DUARTE, CM. 1997. Biomass distribution in marine planktonic communities. Limnolog y and Oceanography, vol. 42, p. 1353-1363. http://dx.doi.org/10.4319/ lo.1997.42.6.1353
GOCKE, K., HERNÁNDEZ, C., GIESENHAGEN, H. and HOPPE H. 2004. Seasonal variations of bacterial abundance and biomass and their relation to phytoplankton in the hypertrophic tropical lagoon Ciénaga Grande de Santa Marta, Colombia. Journal of Plankton Research, vol. 26, no. 12, p. 1429-1439. http://dx.doi.org/10.1093/plankt/fbh131
GOLTERMAN HL., CLIMO RS. and OHNSTAD MAM. 1978. Methods for Physical and Chemical Analysis of Freshwaters. Oxford: Blackwell Scientific Publications. I. B. P. Handbook no. 8.
HAUBRICH, CS., PIRES, APF., ESTEVES, FA. and FARJALLA, VF. 2009. Bottom-up regulation of bacterial growth in tropical phytotelm bromeliads.
Hydrobiologia, vol. 632, no. 1, p. 347-353. http:// dx.doi.org/10.1007/s10750-009-9841-6
HOBBIE, JE., DALEY, RJ. and JASPER, S. 1977. Use of nucleopore filters counting bacteria by fluorescence microcopy. Applied and Environmental Microbiology, vol. 33, no. 5, p. 1225-1228.
openings on the zooplankton community of coastal lagoons with different conservation status. Acta Limnologica Brasiliensia.
STEINBERG, CEW., KAMARA, S., PROKHOTSKAYA, VY., MANUSADZIANAS, L., KARASYOVA, TA., TIMOFEYEV, MA., JIE, Z., PAUL, A., MEINELT, T., FARJALLA, VF., MATSUO, AYO., BURNISON, BK. and MENZEL, R. 2006. Dissolved humic substances - ecological driving forces from the individual to the ecosystem level? Freshwater Biology, vol. 51, no. 7, p. 1189-1210. http://dx.doi. org/10.1111/j.1365-2427.2006.01571.x
STEPANAUSKAS, R., FARJALLA, VF., TRANVIK, LJ., SVENSSON, JM., ESTEVES, FA. and GRANELI, W. 2000. Bioavailability and sources of DOC and DON in macrophyte stands of a tropical coastal lake.
Hydrobiologia, vol. 34, no. 1-3, p. 241-248. http:// dx.doi.org/10.1023/A:1026537905947
THEY, NH., FERREIRA, LMH., MARINS, LF., ABREU, PC. 2013. Stability of bacterial composition and activity in different salinity waters in the dynamic Patos Lagoon Estuary: evidence from a Lagrangian-like approach. Microbial Ecology, vol. 66, no. 3, p.551-562. http://dx.doi.org/10.1007/s00248-013-0259-3
WETZEL, RG. 1990. Land-water interfaces: metabolic and limnological regulators. Verhandlungen des Internationalen Verein Limnologie, vol. 24, p. 6- 24. ZAGATTO, EAG., JACINTHO, OA., MORTATTI,
J. and BERGAMIN, HF. 1980. An improved flow injection determination of nitrite in waters by using intermittent flows. Analytica Chimica Acta, vol. 120, p. 399-403. http://dx.doi.org/10.1016/S0003-2670(01)84388-9
Received: 03 May 2013 Accepted: 19 November 2013 vol. 15, p. 321-327. http://dx.doi.org/10.1111/
j.1466-822X.2006.00237.x
REJAS, D., MUYLAERT, K. and DE MEESTER, L. 2005. Phytoplankton-bacterioplankton interactions in a neotropical floodplain lake (Laguna Bufeos, Bolivia). Hydrobiologia, vol. 543, p. 91-99. http:// dx.doi.org/10.1007/s10750-004-6824-5
RODRÍGUEZ-CLIMENT, S., CAIOLA, N. and IBÁÑEZ, C. 2013. Salinity as the main factor structuring small-bodied fish assemblages in hydrologically altered Mediterranean coastal lagoons.
Scientia Marina, vol. 77, no. 1, p. 37-45. http:// dx.doi.org/10.3989/scimar.03698.26B
ROLAND, F., LOBÃO, LM., VIDAL, LO., JEPPESEN, E., PARANHOS, R. and HUSZAR, VLM. 2010. Relationships between pelagic bacteria and phytoplankton abundances in contrasting tropical freshwaters. Aquatic Microbial Ecology, vol. 60, no. 3, p. 261-272. http://dx.doi.org/10.3354/ame01429 ROMERO-CASTILLO, C., SARMENTO, H.,
ÁLVAREZ-SALGADO, AX., GASOL, JM. and MARRASÉ, C. 2011. Net production and consumption of fluorescent colored dissolved organic matter by natural bacterial assemblages growing on marine phytoplankton exudates. Applied and Environmental Microbiology, vol. 77. no. 21, p. 7490-7498. http://dx.doi.org/10.1128/AEM.00200-11 SALLOTO, GRB., CARDOSO, AM., COUTINHO,
FH., PINTO, LH., VIERIA, RP., CHAIA, C., LIMA, JL., ALBANO, RM., MARTINS, OB. and CLEMENTINO, MM. 2012. Pollution impacts on bacterioplankton diversity in a tropical urban coastal lagoon system. Plos One, vol. 7, no. 11.