Effects of a small natural barrier on the spatial distribution of the fish
assemblage in the Verde River, Upper Paraná River Basin, Brazil
J. C. Silva
a, É. A. Gubiani
a,b*, P. A. Piana
a,band R. L. Delariva
a,caPrograma de Pós-graduação em Conservação e Manejo de Recursos Naturais, Universidade Estadual do Oeste do Paraná
– UNIOESTE, Rua Universitária, 2069, Jardim Universitário, CEP 85819-110, Cascavel, PR, Brazil
bPrograma de Pós-graduação em Recursos Pesqueiros e Engenharia de Pesca, Grupo de Pesquisas em Recursos Pesqueiros
e Limnologia, Instituto Neotropical de Pesquisas Ambientais, Universidade Estadual do Oeste do Paraná – UNIOESTE, Rua da Faculdade, 645, Jardim La Salle, CEP 85903-000, Toledo, PR, Brazil
cCentro de Ciências Biológicas e da Saúde, Universidade Estadual do Oeste do Paraná – UNIOESTE, Rua Universitária,
2069, Jardim Universitário, CEP 85819-110, Cascavel, PR, Brazil *e-mail: [email protected]
Received: January 16, 2015 – Accepted: July 22, 2015 – Distributed: November 30, 2016 (With 3 figures)
Abstract
Geographical barriers influence species distribution and play an important role in the segregation of fish assemblages. The present study aims to test the influence of a small natural barrier on the spatial distribution of fish species in the Verde River, Upper Paraná River Basin, Brazil, considering two biotopes: upstream and downstream of the Branca Waterfall. We observed the highest species richness downstream of the Branca Waterfall, which also had the highest number of exclusive species. Richness, evenness, and abundance varied significantly among biotopes. The composition and structure of the fish assemblage differed between biotopes, which were characterized by different indicator species, mainly downstream of the Branca Waterfall. Physical and chemical variables and geographical distance between sites were not responsible for the differences observed. Hence, the present study shows that small barriers can also be crucial in structuring fish fauna and play a key role in the segregation of fish assemblages.
Keywords: community ecology, fish fauna, segregation, spatial distribution, waterfalls.
Efeitos de uma pequena barreira natural sobre a distribuição espacial da
assembleia de peixes no rio Verde, bacia do alto rio Paraná, Brasil
Resumo
As barreiras geográficas influenciam a distribuição das espécies e desempenham um papel importante na segregação das assembleias de peixes. Dessa forma, o objetivo deste estudo foi avaliar mudanças espaciais na assembleia de peixes do rio Verde, sob a influência de uma pequena barreira geográfica natural, bacia do alto rio Paraná, Mato Grosso do Sul, Brasil. Para isso, seis locais foram amostrados e agrupados em dois biótopos: montante e jusante da cachoeira Branca. Maior riqueza e número de espécies exclusivas foram observadas a jusante da cachoeira Branca. A riqueza, equitabilidade e abundância diferiram significativamente entre os biótopos. Além disso, a composição e a estrutura da assembleia de peixes também diferiram entre os biótopos, os quais foram caracterizados por distintas espécies indicadoras, especialmente a jusante da cachoeira Branca. As variáveis físicas e químicas da água e as distâncias geográficas, entre os locais, não foram responsáveis pelas diferenças observadas. Dessa forma, este estudo demonstrou que pequenas barreiras geográficas podem ser cruciais na estruturação da ictiofauna e desempenhar um papel-chave
na segregação de assembleias de peixes.
Palavras-chave: ecologia de comunidades, ictiofauna, segregação, distribuição espacial, corredeiras.
1. Introduction
Understanding species distribution is one of the main
challenges in ecology. In most situations, species have
their distribution determined by a series of historical and environmental factors. The knowledge of how these factors affect species distribution is important to build predictive
models (Jackson et al., 2001; Teixeira et al., 2005; Súarez
and Petrere Junior, 2007) and to understand spatial and
temporal organization patterns of fish assemblages. Fish assemblages are expected to change along stretches of the same river, as a result of evolutionary processes and adaptations of each species. These processes and adaptations
influences, and human activities (e.g., removal of riparian vegetation, construction of dams, canalization, and pollution;
Meador and Goldstein, 2003).
Several factors that operate at different spatial and
temporal scales determine which species can colonize
and persist in specific habitats (Hoeinghaus et al., 2007; Rahel, 2007). Hence, regional characteristics may influence
the composition and diversity of local fish assemblages
(Angermeier and Winston, 1998). These characteristics
act as a series of ecological screens or filters (Jackson and Harvey, 1989; Poff, 1997; Quist et al., 2005; Hugueny et al., 2010), such as food resource availability (Uieda and Pinto, 2011), habitat complexity (Alexandre and Almeida, 2010; Felipe and Súarez, 2010), and natural barriers (Robinson and Rand, 2005; Torrente-Vilara et al., 2011; Dias et al., 2013).
Cascades, rapids, and waterfalls are potential geographical barriers for the dispersion of aquatic organisms, through the decrease of habitat connectivity; thus, they are crucial
in determining species distribution (Rahel, 2007).
Differences in freshwater assemblages among sites may
be determined by connectivity (Miranda and Raborn, 2000; Rahel, 2007; Cote et al., 2009) or isolation of the aquatic systems (Torrente-Vilara et al., 2011). Connectivity is one
of the main forces that shapes fish population dynamics
and leads to changes in the community (Olden et al., 2001; Petry et al., 2003). According to the serial discontinuity
concept of lotic ecosystems (Ward and Stanford, 1983;
Stanford and Ward, 2001), artificial barriers disrupt the longitudinal gradient of the river. Artificial barriers alter the
river biotic and abiotic conditions and lead to variations in
the composition and structure of the fish assemblage between upstream and downstream stretches. Likewise, natural barriers may cause faunal discontinuities and increase dissimilarities in the ichthyofauna, as changes in landscape characteristics
cause habitat alterations and increase species turnover along the longitudinal gradient (Balon and Stewart, 1983; Rahel
and Hubert, 1991).
This study aims at accessing the spatial distribution of fish species in two biotopes: upstream and downstream of the Branca Waterfall, Verde River, Upper Paraná River Basin, Brazil. We assessed the effect of a small natural barrier on the spatial distribution of fish. We expected most of the differences between fish assemblages to be better explained
by the small natural barrier than by local environmental
conditions. Therefore, we aimed at answering the following questions: (i) Are fish assemblage structure and composition different upstream and downstream of the waterfall?; (ii) Are those differences in composition and structure related to the presence of a small natural barrier?; (iii) Do the composition and structure of fish assemblages in the area influenced by physical and chemical variables of the water?
2. Material and Methods
2.1. Study area
The Verde River Water Basin is located in the Brazilian Cerrado, the second largest biome in the country and one
of the world’s biodiversity hotspots (Klink and Machado,
2005; Abell et al., 2008). It comprises the northeastern part
of the state of Mato Grosso do Sul, with the municipalities
of Camapuã, Costa Rica, Água Clara, Ribas do Rio Pardo,
Brasilândia, and Três Lagoas. Its mouth is located in the
Paraná River, in the reservoir of the Engenheiro Sérgio Motta Hydropower Plant (locally known as Porto Primavera Dam), state of São Paulo.
The Branca Waterfall is located in the middle stretch of the Verde River close to Água Clara. It is a small obstacle,
with approximately 1.5 m in height, characterized by a
gradient of intense flow, with several cascades, turbulent
waters, and extensive rapids. In this stretch, the substrate
is rocky and the waterfall surroundings are composed of marginal native shrubby vegetation and rocks.
2.2. Sampling
We sampled fish species in six sites along the Verde
River (Figure 1). In the spatial variation analysis, aiming at
identifying the effects of the natural barrier on fish dispersal,
we grouped the sites into two biotopes: upstream (1-3; Figure 1) and downstream of the Branca Waterfall (4-6; Figure 1). The physical characteristics of each biotope are described in Table 1.
Sampling was carried out monthly during the fish reproductive season (from November 2010 to March 2011 and from October 2011 to February 2012) and quarterly from
May to August 2011, summing up 12 samples. We used as
fishing devices gillnets (mesh sizes of 2.4, 3, 4, 5, 6, 7, 8, 9, 10, 12, 14, and 16 cm between opposite knots) and trammel nets (with inner mesh sizes of 6, 7 and 8 cm between opposite knots), locally known as feiticeiras, with 1.5 m in height and
20 m in length. We let nets set for 24 h and checked them at every 8 h. After capturing fish specimens, we anesthetized them with a benzocaine solution (250 mg/l) following AVMA
(2001), fixed them in plastic bags containing formaldehyde
10% and placed them in polyethylene containers. In the
laboratory, we identified the fish following Graça and Pavanelli
(2007), measured (total and standard length in cm), and weighed them (g). We preserved vouchers of each species in alcohol 70% and deposited them in the fish collection of Nupélia (Núcleo de Pesquisas em Limnologia, Ictiologia e Aquicultura) at Universidade Estadual de Maringá (available at http://peixe.nupelia.uem.br).
2.3. Environmental variables
Concomitantly with fish sampling, we measured water
physical and chemical variables, such as temperature (°C;
mercury bulb thermometer), electrical conductivity (µS/cm;
portable conductivity meter Digimed DM-3P; Digimed – Analytical Instrumentation – Santo Amaro, São Paulo State,
Brazil), dissolved oxygen (mg/L; portable oxymeter YSI 550A), pH (portable phmeter Digimed DM-2P), turbidity
(NTU, Turbidimeter LaMotte 2020e), and transparency
(Secchi disk), to describe the environmental conditions.
2.4. Data analysis
2.4.1. Assemblage attributes
We estimated species abundance based on catch per
unit effort (CPUE) in terms of number of individuals
For each month and site (per sample), we calculated species richness (number of fish species), Shannon
diversity index (H’ = -∑ s
i=1pi x ln(pi), where: s = number of species and pi = proportion of species i), and evenness
(E = H’/lnS, where: H’ = Shannon diversity index and
S = species richness) (Magurran, 1988).
We used a t-test for independent samples to evaluate spatial differences between biotopes relative to species
Figure 1. Spatial location of sampling sites in the Verde River, Upper Paraná River Basin, state of Mato Grosso do Sul,
richness, Shannon diversity index, evenness, CPUE (number
and biomass), and environmental variables.
2.4.2. Fish assemblage distribution patterns
To summarize composition and structure of the fish
assemblage, we applied a nonmetric multidimensional scaling (NMDS; Kruskal, 1964). We computed Bray-Curtis
distances and we followed the general NMDS procedure
outlined by McCune and Grace (2002). We used random
starting configurations, the number of runs with the real data
was 100, and the stability criterion was standard deviations
≤ 0.005 in stress over 100 iterations. This analysis was performed using the CPUE data matrix in number (square root transformed to remove the effect of high values) in different months and sampling sites (by sample).
We assessed the variation in assemblage composition
and structure in relation to position of sites relative to Branca Waterfall (biotopes; “a” component), geographic distances between sites (“b” component), and environmental variables (“c” component) using variation partitioning
routine (Varpart; Peres-Neto et al., 2006). We chose the
Varpart routine because it divides the variation of a response matrix into two, three, or four explanatory matrices and assesses the individual contributions of each one, and its interactions. We used Hellinger transformation (Legendre and Gallagher, 2001) on CPUE data (in number of each
species) of assemblage structure to preserve Euclidian metric distances. The matrix of geographic distances was composed of site coordinates in UTM and was included in
the analysis because close sites probably have more similar assemblages than distant ones (Tobler, 1970; Nekola and White, 1999). So, varpart partitioning out this variation to
test the effects of other matrices. We applied significance tests for each contribution matrix with redundancy analysis (RDA function), followed by an analysis of
variance (ANOVA with 999 permutations), as suggested
by Oksanen et al. (2015).
We used the indicator value analysis (IndVal; Dufrêne and Legendre, 1997) to detect how strongly each species
contributed to the differences between biotopes. To test the significance of the indicator value we used a Monte
Carlo procedure with 1,000 permutations.
Assemblage attributes (species richness, Shannon
diversity index, and evenness), NMDS, and IndVal were all calculated in the software PC-Ord 5.0 (McCune and Mefford, 2006). The t-test was calculated in the software Statistica™ 7.0 and the Varpart in the software R
(R DEVELOPMENT CORE TEAM, 2012) with the Vegan
package (Oksanen et al., 2015). The level of significance
used in all analyses was p < 0.05.
3. Results
3.1. Ichthyofauna survey
We caught 5,964 fishes of 82 species, 21 families, and five orders (Appendix A). The orders Characiformes (38 species) and Siluriformes (34 species) comprised 88% of all species collected. In addition, we collected specimens of the orders Gymnotiformes (six species), Perciformes (three species), and Myliobatiformes (one specie).
The species with highest abundance in number (CPUE) upstream of the Branca Waterfall were Leporinus friderici,
Astyanax altiparanae, Astyanax aff. fasciatus, and Leporinus
obtusidens. The most abundant species downstream of the Branca Waterfall were Schizodon borellii, L. friderici,
A. altiparanae, and L. obtusidens. In addition, this biotope
also showed the largest number of long-distance migratory species (13). Among the migratory species, the most abundant and frequent was L. obtusidens, captured in the three
downstream sites (Appendix A). Five fish species recorded
Table 1. Physical characteristics of the sampling sites in the Verde River, Upper Paraná River Basin, state of Mato Grosso
do Sul, mid-western Brazil.
Site Biotope Predominant
substrate
Riparian vegetation
Channel
physiography Surrounding
1, 2 and 3 Upstream of the
Branca Waterfall Rocky/sandy
Preserved region with native riparian vegetation
(shrubby) with 20
to 30 m in width on both margins.
Width between 40 and 150 m, with
fast and turbulent waters, few backwater, and
shelter sites. Some marginal lagoons and floodplain areas. Extensive livestock farming and eucalyptus plantation.
4, 5 and 6 Downstream of the
Branca Waterfall Rocky/sandy
Native riparian vegetation
(shrubby) with
10 m in width, on average.
Width between 40 and 60 m, with
fast and turbulent waters, backwater
areas, shelters on the margins, and
large floodplain
regions.
Extensive
(Myloplus tiete, Brycon orbignyanus, Pseudoplatystoma
corruscans, Salminus hilarii, and Salminus brasiliensis)
are on the list of endangered or vulnerable species (IUCN, 2014). In the present study these species showed expressive
frequencies in both biotopes.
3.2. Assemblage attributes
Total abundance (CPUE) differed significantly between biotopes, both in number (t = –2.56; p = 0.01) and biomass (t = –6.06; p < 0.01) (Figure 2a and b, respectively). Higher
mean values of CPUE, in number and weight, were registered downstream of Branca Waterfall (216.73 individuals and 78.00 kg. 1000m–2 of nets in 24h, respectively). We recorded the highest species richness downstream of the Branca Waterfall (70 species). Among those, 32 species were exclusive of this site (Appendix A), including some
large-bodied (see Vazzoler, 1996) Siluriformes: Auchenipterus
osteomystax, Hemisorubim platyrhynchos, Megalonema platanum, Pterodoras granulosus, Pimelodus ornatus and
Sorubim lima. Upstream of the Branca Waterfall, we recorded
50 species, including 12 exclusive species (Appendix A). We observed significant differences in species richness
(t = –3.61; p < 0.01) and evenness (t = 2.06; p < 0.05;
Figure 2c and d, respectively).
3.3. Fish assemblage distribution patterns
The NMDS showed that the composition and structure
of the fish assemblage segregated between biotopes. In this analysis, we reached a final stress of 0.23 (Monte Carlo test; p < 0.01) for a two dimensional solution. The spatial
variability was evidenced by the axis 1, showing that
the composition and structure of the fish assemblage are strongly influenced by changes along the longitudinal
gradient (Figure 3).
As pointed out by the IndVal, the two biotopes were
characterized by different sets of indicator species. We identified fourteen species as indicators downstream of the Branca Waterfall, including mainly large migratory species (five; as mentioned by Vazzoler, 1996). Four species
were considered indicators upstream of the Branca Waterfall (Table 2).
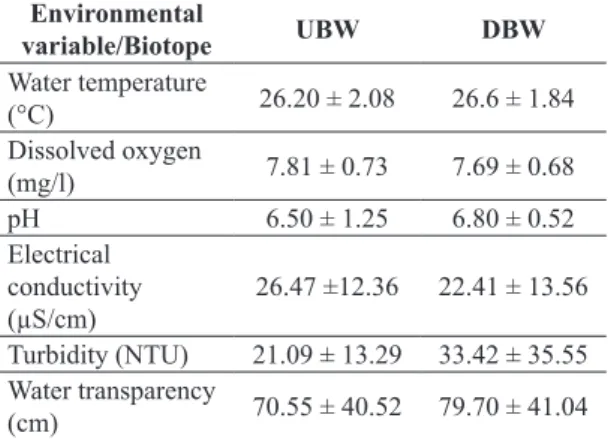
Concerning environmental variables, we found significant spatial differences between biotopes, only in electrical conductivity (t = –2.10; p < 0.05) and turbidity
Figure 2. Results of t-test for independent samples comparing the abundance in number (a) and weight (b) of individuals
Figure 3. Scores of the axes (two dimensional solution: axis 1 and axis 2) of the nonmetric multidimensional scaling
(NMDS) used for the analysis of spatial patterns, ordered by biotope: upstream (UBW) and downstream (DBW) of the Branca Waterfall, Verde River, Upper Paraná River Basin, Brazil, from November 2010 to February 2012.
Table 2. Analysis of species indicator value, showing relative abundance (RA%), relative frequency (RF%), and indicator
value (Indval) of each species in each biotope: upstream (UBW) and downstream of the Branca Waterfall (DBW), in the Verde River, Upper Paraná River Basin, Brazil, from November 2010 to February 2012. Only the species with p < 0.05 in the Monte Carlo test are listed.
Biotope Specie RA% RF% IndVal p
UBW A. aff. fasciatus 80 92 73 0.00
A. lacustris 71 53 37 0.03
E. trilineata 86 39 33 0.00
M. tiete 95 69 66 0.00
DBW A. osteomystax* 100 44 44 0.00
G. knerii 98 83 81 0.00
H. cf. cochliodon 100 47 47 0.00
H. orthonops 100 69 69 0.00
H. platyrhynchos* 100 53 53 0.00
M. platanum* 100 17 17 0.02
P. corruscans* 94 25 24 0.01
P. galeatus 100 22 22 0.00
P. gracilis 90 36 33 0.00
R. descalvadensis 100 19 19 0.00
R. vulpinus* 100 39 39 0.00
S. borellii 100 83 83 0.00
S. maculatus 100 19 19 0.01
S. marginatus 100 22 22 0.00
(t = –2.58; p < 0.05; Table 3). We found higher mean
values of electrical conductivity upstream of the Branca Waterfall. On the other hand, we recorded higher mean values of turbidity downstream of the waterfall.
Composition and structure of fish assemblages was weakly, but significantly associated with biotopes, spatial
distances and environmental variables (varpart individual
contributions of “a” component: adjusted R2 = 0.06, p < 0.01; “b” component: adjusted R2 = 0.04, p < 0.01; and “c” component: adjusted R2 = 0.03, p < 0.01, respectively).
4. Discussion
A small natural geographical barrier led to marked differences in the fish assemblages between biotopes.
According to Robinson and Rand (2005), who studied
changes in the fish assemblage along an altitudinal gradient in a southern Appalachian watershed in the U.S., fish
assemblages in areas with barriers to dispersal should
differ from those in areas with no barriers. In addition, local differences in abundance and richness may indicate that potential barriers limit fish dispersal (Nislow et al., 2011).
The spatial structure of the ichthyofauna pointed to marked differences between downstream and upstream stretches of the Branca Waterfall. The downstream biotope
has a particular species composition, which may be
explained by the influence of the natural barrier. The role of biogeographic barriers, such as waterfalls, cascades, and large rapids, in the isolation of freshwater fish is well
documented (Robinson and Rand, 2005; Rahel, 2007; Júlio Júnior et al., 2009; Olden et al., 2010; Torrente-Vilara et al., 2011; Vitule et al., 2012; Dias et al., 2013), but this is not
the case for small natural barriers. Barriers constitute a determining factor in the composition of regional faunas and ichthyofauna dissimilarity. The Branca Waterfall causes a disruption in the longitudinal gradient of the river. It possibly acts as an ecological filter that limits the ascendant and descendant movement of fish between the sites located upstream and downstream of the waterfall.
The absence of migratory species upstream of barriers
is attributed to geographic isolation, as barriers impede the
dispersal needed to complete the life cycle of fish (Britto and Sirol, 2005). In the present study, the small natural barrier has apparently isolated not only the small-sized species with
low dispersal capacity, but also large migratory Siluriformes
(as mentioned in Vazzoler, 1996), which were considered
indicator species downstream of the Branca Waterfall. However, records of species in the upper stretches also
suggest bidirectional movements, as some long-distance migratory species were recorded in both biotopes. Most
of these species belong to the order Characiformes, such
as L. elongatus, S. brasiliensis, and S. hilarii. Our data
suggest that these species transpose the Branca Waterfall and possibly use upstream areas for their reproductive activities. In order to migrate upstream of a river, a fish should swim faster than the water velocity, which requires a large amount of energy. As Characiformes are thought to be more efficient swimmers than the Siluriformes
(Santos et al., 2007; Makrakis et al., 2010), they would have better capacity to transpose barriers. These results indicate
that the Branca Waterfall is not a completely unbridgeable barrier (a small barrier), especially in periods of flood. However, the Verde River’s barrier plays a selective role in the passage of fish upstream.
As previously reported, Verde River has its mouth in the
reservoir of Porto Primavera. According to Agostinho et al. (2007, 2008), there is a high reduction in diversity and productivity in reservoirs, which compels species to
search for alternative sites for survival and reproduction. Therefore, the Verde River is an important alternative route for migratory species. The importance of the maintenance of free stretches in tributaries upstream reservoirs it is
well documented in the literature (Hoffmann et al., 2005; Agostinho et al., 2008; Gubiani et al., 2010). In addition, according to Olden et al. (2010), biogeographic processes that increase habitat isolation and limit dispersal resulted in
high diversity of freshwater fish. Hence, the high diversity, mainly of migratory species, observed downstream of the Branca Waterfall suggests that the ichthyofauna is under the influence of both the Porto Primavera reservoir and the waterfall itself, and is highly isolated and diverse.
Physical and chemical factors are pointed as important for determining the distribution and composition of fish
assemblages (Matthews, 1998; Jackson et al., 2001;
Oberdorff et al., 2001; Barros et al., 2013). However, in
the present study we observed a weak correlation between
selected environmental variables and geographical distance
with the spatial structure of the ichthyofauna. In addition to the abiotic factors and geographical distance, several other factors may influence the structuring of fish assemblages, such as biotic factors (e.g. predation and competition), regional factors (e.g. climatic variables) (Jackson et al.,
2001). It is clear, though, that dispersal barriers, such as
the small barrier of Branca Waterfall, played an important role promoting spatial variations in fish assemblages.
Table 3. Environmental variables (mean ± standard deviation) for the two biotopes: upstream (UBW) and downstream of the Branca Waterfall (DBW), in the Verde River, Upper Paraná River Basin, Brazil, from November 2010 to February 2012.
Environmental
variable/Biotope UBW DBW
Water temperature
(°C) 26.20 ± 2.08 26.6 ± 1.84
Dissolved oxygen
(mg/l) 7.81 ± 0.73 7.69 ± 0.68
pH 6.50 ± 1.25 6.80 ± 0.52
Electrical conductivity
(µS/cm) 26.47 ±12.36 22.41 ± 13.56 Turbidity (NTU) 21.09 ± 13.29 33.42 ± 35.55 Water transparency
Therefore, small barriers should be assessed in detail not
only in the Verde River, but also in other rivers.
There is no consensus on the waterfall height that would constitute a threshold to prevent freshwater fish from dispersing upstream (i.e., an insurmountable barrier,
sensu Dias et al., 2013). However, our study showed
that small barriers may be crucial in structuring fish assemblages. The Branca Waterfall has a strong influence on the spatial distribution of the fish fauna of the Verde River. It plays a key role in the segregation of assemblages, and provides the stretch downstream of Branca Waterfall with a rich and diverse fauna. In conclusion, conservation and management strategies of aquatic organisms should consider that even small barriers may cause differences in
community structure or even isolate communities (Rahel, 2007; Júlio Júnior et al., 2009; Torrente-Vilara et al., 2011;
and results reported herein).
Acknowledgements
We thank the Research Group on Fishing Resources and Limnology (GERPEL) for the help in fieldwork. Eletrosul - Centrais Elétricas SA funded our research. Capes granted us a research fellowship. E. A. Gubiani received a scientific productivity fellowship from the Brazilian Research Council (CNPq; process 302143/2011-4) and acknowledges this agency for the grants received.
References
ABELL, R., THIEME, M.L., REVENGA, C., BRYER, M., KOTTELAT, M., BOGUTSKAYA, N., COAD, B., MANDRAK, N., BALDERAS, S.C., BUSSING, W., STIASSNY, M.L.J., SKELTON, P., ALLEN, G.R., UNMACK, P., NASEKA, A., NG, R., SINDORF, N., ROBERTSON, J., ARMIJO, E., HIGGINS, J.V., HEIBEL, T.J., WIKRAMANAYAKE, E., OLSON, D., LÓPEZ, H.L., REIS, R.E., LUNDBERG, J.G., SABAJ PÉREZ, M.H. and PETRY, P., 2008. Freshwater ecoregions of the World: a new map of biogeographic units for freshwater biodiversity conservation. Bioscience, vol. 58, no. 5, pp. 403-414. http:// dx.doi.org/10.1641/B580507.
AGOSTINHO, A.A., GOMES, L.C. and PELICICE, F.M., 2007. Ecologia e manejo de recursos pesqueiros em reservatórios do Brasil. Maringá: EDUEM. 501 p.
AGOSTINHO, A.A., PELICICE, F.M. and GOMES, L.C., 2008. Dams and the fish fauna of the Neotropical region: impacts and management related to diversity and fisheries. Brazilian Journal of Biology = Revista Brasileira de Biologia, vol. 68, no. 4, suppl., pp. 1119-1132. http://dx.doi.org/10.1590/S1519-69842008000500019. PMid:19197482.
ALEXANDRE, C.M. and ALMEIDA, P.R., 2010. The impact of small physical obstacles on the structure of freshwater fish assemblages. River Research and Applications, vol. 26, pp. 977-994. AMERICAN VETERINARY MEDICAL ASSOCIATION – AVMA, 2001. Report of the AVMA panel on euthanasia. Journal of the American Veterinary Medical Association, vol. 218, no. 5, pp. 669-696. http://dx.doi.org/10.2460/javma.2001.218.669. PMid:11280396.
ANGERMEIER, P.L. and WINSTON, M.R., 1998. Local vs. regional influences on local diversity in stream fish communities of Virginia. Ecology, vol. 79, no. 3, pp. 911-927. http://dx.doi. org/10.1890/0012-9658(1998)079[0911:LVRIOL]2.0.CO;2.
BALON, E.K. and STEWART, D.J., 1983. Fish assemblages in a river with unusual gradient (Luongo, Africa – Zaire system), reflections on river zonation, and description of another new species. Environmental Biology of Fishes, vol. 9, no. 3-4, pp. 225-252. http://dx.doi.org/10.1007/BF00692373.
BARROS, D.F., ALBERNAZ, A.L.M., ZUANON, J., ESPÍRITO SANTO, H.M.V., MENDONÇA, F.P. and GALUCH, A.V., 2013. Effects of isolation and environmental variables on fish community structure in the Brazilian Amazon Madeira-Purus interfluve. Brazilian Journal of Biology = Revista Brasileira de Biologia, vol. 73, no. 3, pp. 491-499. http://dx.doi.org/10.1590/ S1519-69842013000300005. PMid:24212688.
BRITTO, S.G.C. and SIROL, R.N., 2005. Transposição de peixes como forma de manejo: as escadas do Complexo Canoas, médio Paranapanema, bacia do Alto Paraná. In: M.G. NOGUEIRA, R. HENRY and A. JORCIN, eds. Ecologia de reservatórios: impactos potenciais, ações de manejo e sistemas em cascata. São Carlos: Rima, pp. 285-304.
COTE, D., KEHLER, D.G., BOURNE, C. and WIERSMA, Y.F., 2009. A new measure of longitudinal connectivity for stream networks. Landscape Ecology, vol. 24, no. 1, pp. 101-113. http:// dx.doi.org/10.1007/s10980-008-9283-y.
DIAS, M.S., CORNU, J.F., OBERDORFF, T., LASSO, C.A. and TEDESCO, P.A., 2013. Natural fragmentation in river networks as a driver of speciation for freshwater fishes. Ecography, vol. 35, pp. 1-7.
DUFRÊNE, M. and LEGENDRE, P., 1997. Species assemblages and indicator species: the need for a flexible asymmetrical approach. Ecological Monographs, vol. 67, pp. 345-366.
FELIPE, T.R. and SÚAREZ, Y.R., 2010. Caracterização e influência dos fatores ambientais nas assembleias de peixes de riachos em duas microbacias urbanas, alto rio Paraná. Biota
Neotropica, vol. 10, no. 2, pp. 143-151. http://dx.doi.org/10.1590/ S1676-06032010000200018.
GRAÇA, W.J. and PAVANELLI, C.S., 2007. Peixes da planície de inundação do alto rio Paraná e áreas adjacentes. Maringá: EDUEM. 241 p.
GUBIANI, É.A., GOMES, L.C., AGOSTINHO, A.A. and BAUMGARTNER, G., 2010. Variations in fish assemblages in a tributary of the Upper Paraná River, Brazil: a comparison between pre and post-closure phases of dams. River Research and Applications, vol. 26, no. 7, pp. 848-865. http://dx.doi. org/10.1002/rra.1298.
HOEINGHAUS, D.J., WINEMILLER, K.O. and BIRNBAUM, J.S., 2007. Local and regional determinants of stream fish assemblage structure: inferences based on taxonomic vs. functional groups. Journal of Biogeography, vol. 34, no. 2, pp. 324-338. http:// dx.doi.org/10.1111/j.1365-2699.2006.01587.x.
HUGUENY, B., OBERDORFF, T. and TEDESCO, P.A., 2010. Community ecology of river fishes: a large-scale perspective. American Fisheries Society Symposium, vol. 73, pp. 1-34. INTERNATIONAL UNION FOR CONSERVATION OF NATURE – IUCN, 2014 [viewed 15 May 2014]. IUCN Red List of Threatened Species. Version 2014.1 [online]. Available from: http://www.iucnredlist.org
JACKSON, D.A. and HARVEY, H.H., 1989. Biogeographic associations in fish assemblages: local vs. regional processes. Ecology, vol. 70, no. 5, pp. 1472-1485. http://dx.doi.org/10.2307/1938206.
JACKSON, D.A., PERES-NETO, P.R. and OLDEN, J.D., 2001. What controls who is where in freshwater fish communities - the roles of biotic, abiotic, and spatial factors. Canadian Journal of Fisheries and Aquatic Sciences, vol. 58, pp. 157-170.
JÚLIO JÚNIOR, H.F., TÓS, C.D., AGOSTINHO, Â.A. and PAVANELLI, C.S. 2009. A massive invasion of fish species after eliminating a natural barrier in the upper rio Paraná basin. Neotropical Ichthyology, vol. 7, no. 4, pp. 709-718. http://dx.doi. org/10.1590/S1679-62252009000400021.
KING, M., 1995. Fisheries biology, assessment and management. Oxford: Fishing News Books. 341 p.
KLINK, C.A. and MACHADO, R.B., 2005. A conservação do Cerrado brasileiro. Megadiversidade, vol. 1, no. 1, pp. 147-155. KRUSKAL, J.B., 1964. Nonmetric multidimensional scaling: a numerical method. Psychometrika, vol. 29, no. 2, pp. 115-129. http://dx.doi.org/10.1007/BF02289694.
LEGENDRE, P. and GALLAGHER, E.D., 2001. Ecologically meaningful transformations for ordination of species data. Oecologia, vol. 129, no. 2, pp. 271-280. http://dx.doi.org/10.1007/ s004420100716.
MAGURRAN, A.E., 1988. Ecological diversity and its measurement. London: Croom Helm. 192 p.
MAKRAKIS, S., MIRANDA, L.E., GOMES, L.C., MAKRAKIS, M.C. and JUNIOR, H.M.F., 2010. Ascent of Neotropical migratory fish in the Itaipu reservoir fish pass. River Research and Applications, vol. 1, pp. 5-18.
MATTHEWS, W.J., 1998. Patterns in freshwater fish ecology. New York: Chapman & Hall. 756 p.
MCCUNE, B. and GRACE, J.B., 2002. Analysis of ecological communities. Oregon: Gleneden Beach. 300 p.
MCCUNE, B. and MEFFORD, M.J., 2006. PC-ORD, version 5.0, multivariate analysis of ecological data. Gleneden Beach: MjM Solfware Desing. 40 p.
MEADOR, M.R. and GOLDSTEIN, R.M., 2003. Assessing water quality at large geographic scales: relations among land use, water physicochemistry, riparian condition, and fish community structure. Environmental Management, vol. 31, no. 4, pp. 504-517. http://dx.doi.org/10.1007/s00267-002-2805-5. PMid:12677296.
MIRANDA, L.E. and RABORN, S.W., 2000. From zonation to connectivity: fluvial ecology paradigms of the 20th century. Polskie
Archiwum Hydrobiologii, vol. 47, no. 1, pp. 5-19.
NEKOLA, J.C. and WHITE, P.S., 1999. The distance decay of similarity in biogeography and ecology. Journal of Biogeography, vol. 26, no. 4, pp. 867-878. http://dx.doi.org/10.1046/j.1365-2699.1999.00305.x.
NISLOW, K.H., HUDY, M., LETCHER, B.H. and SMITH, E.P., 2011. Variation in local abundance and species richness of stream fishes in relation to dispersal barriers: implications for management and conservation. Freshwater Biology, vol. 56, no. 10, pp. 2135-2144. http://dx.doi.org/10.1111/j.1365-2427.2011.02634.x.
OBERDORFF, T., PONT, D., HUGUENY, B. and CHESSEL, D., 2001. A probabilistic model characterizing fish assemblages of French rivers: a framework for environmental assessment. Freshwater Biology, vol. 46, no. 3, pp. 399-415. http://dx.doi. org/10.1046/j.1365-2427.2001.00669.x.
OKSANEN, J., BLANCHET, F.G., KINDT, R., LEGENDRE, P., MINCHIN, P.R., O’HARA, R.B., SIMPSON, G.L., SOLYMOS, P., HENRY, M., STEVENS, H. and WAGNER, H., 2015 [viewed 16 January 2015]. Vegan: Community Ecology Package version 2.2-1 [online]. Available from: http://CRAN.R-project.org/ package=vegan
OLDEN, J.D., JACKSON, D.A. and PERES-NETO, P.R., 2001. Spatial isolation and fish communities in drainage lakes. Oecologia, vol. 127, no. 4, pp. 572-585. http://dx.doi.org/10.1007/ s004420000620.
OLDEN, J.D., KENNARD, M.J., LEPRIEUR, F., TEDESCO, P.A., WINEMILLER, K.O. and GARCÍA-BERTHOU, E., 2010. Conservation biogeography of freshwater fishes: recent progress and future challenges. Diversity & Distributions, vol. 16, no. 3, pp. 496-513. http://dx.doi.org/10.1111/j.1472-4642.2010.00655.x.
PERES-NETO, P., LEGENDRE, P., DRAY, S. and BORCARD, D., 2006. Variation partitioning of species data matrices: estimation and comparison of fractions. Ecology, vol. 87, no. 10, pp. 2614-2625. http://dx.doi.org/10.1890/0012-9658(2006)87[2614:VPO SDM]2.0.CO;2. PMid:17089669.
PETRY, A.C., AGOSTINHO, A.A. and GOMES, L.C., 2003. Fish assemblages of tropical floodplain lagoons: exploring the role of connectivity in a dry year. Neotropical Ichthyology, vol. 1, no. 2, pp. 111-119. http://dx.doi.org/10.1590/S1679-62252003000200005.
POFF, N.L., 1997. Landscape filters and species traits: towards mechanistic understanding and prediction in stream ecology. Journal of the North American Benthological Society, vol. 16, no. 2, pp. 391-409. http://dx.doi.org/10.2307/1468026.
QUIST, M.C., RAHEL, F.J. and HUBERT, W.A., 2005. Hierarchical faunal filters: an approach to assessing effects of habitat and nonnative species on native fishes. Ecology Freshwater Fish, vol. 14, no. 1, pp. 24-39. http://dx.doi.org/10.1111/j.1600-0633.2004.00073.x.
R DEVELOPMENT CORE TEAM., 2012 [viewed 26 October 2012]. R: a language and environment for statistical computing [online]. Vienna: R Foundation for Statistical Computing. Available from: http://www.R-project.org
RAHEL, F.J. and HUBERT, W.A., 1991. Fish assemblages and habitat gradients in a rocky Mountain–Great plains stream: biotic zonation and additive patterns of community Change. Transactions of the American Fisheries Society, vol. 120, no. 3, pp. 319-332. http://dx.doi.org/10.1577/1548-8659(1991)120<0319:FAAHG I>2.3.CO;2.
RAHEL, F.J., 2007. Biogeographic barriers, connectivity and homogenization of freshwater faunas: it’s a small world after all. Freshwater Biology, vol. 52, no. 4, pp. 696-710. http://dx.doi. org/10.1111/j.1365-2427.2006.01708.x.
watershed, USA. Ecology Freshwater Fish, vol. 14, no. 1, pp. 14-23. http://dx.doi.org/10.1111/j.1600-0633.2005.00063.x.
SANTOS, H.A., POMPEU, P.S. and MARTINEZ, C.B., 2007. Swimming performance of the migratory Neotropical fish Leporinus reinhardti (Characiformes: Anostomidae). Neotropical Ichthyology, vol. 5, no. 2, pp. 139-146. http://dx.doi.org/10.1590/ S1679-62252007000200007.
STANFORD, J.A. and WARD, J.V., 2001. Revisiting the serial discontinuity concept. Regulated Rivers: Research and Management, vol. 17, no. 4-5, pp. 303-310. http://dx.doi.org/10.1002/rrr.659.
SÚAREZ, Y.R. and PETRERE JUNIOR, M., 2007. Environmental factors predicting fish community structure in two neotropical rivers in Brazil. Neotropical Ichthyology, vol. 5, no. 1, pp. 61-68. http://dx.doi.org/10.1590/S1679-62252007000100008.
TEIXEIRA, T.P., PINTO, B.C.T., TERRA, B.F., ESTILIANO, E.O., GRACIA, D. and ARAÚJO, F.G., 2005. Diversidade das assembleias de peixes nas quatro unidades geográficas do rio Paraíba do Sul. Iheringia: Série Zoologia, vol. 95, no. 4, pp. 347-357. TOBLER, W.R., 1970. A computer movie simulating urban growth in the Detroit Region. Economic Geography, vol. 46, pp. 234-240. http://dx.doi.org/10.2307/143141.
TORRENTE-VILARA, G., ZUANON, J., LEPRIEUR, F., OBERDORFF, T. and TEDESCO, P.A., 2011. Effects of natural rapids and waterfalls on fish assemblage structure in the Madeira River (Amazon Basin). Ecology Freshwater Fish, vol. 20, no. 4, pp. 588-597. http://dx.doi.org/10.1111/j.1600-0633.2011.00508.x.
UIEDA, V.S. and PINTO, T.L.F., 2011. Feeding selectivity of ichthyofauna in a tropical stream: space-time variations in trophic plasticity. Community Ecology, vol. 12, no. 1, pp. 31-39. http:// dx.doi.org/10.1556/ComEc.12.2011.1.5.
VAZZOLER, A.E.A.M., 1996. Biologia da reprodução de peixes teleósteos: teoria e prática. Maringá: EDUEM. 169 p. VITULE, J.R.S., SKÓRA, F. and ABILHOA, V., 2012. Homogenization of freshwater fish faunas after the elimination of a natural barrier by a dam in Neotropics. Diversity & Distributions, vol. 18, no. 2, pp. 111-120. http://dx.doi.org/10.1111/j.1472-4642.2011.00821.x.
Appendix A. Taxonomic nomenclature following Reis et al. (2003) and Graça and Pavanelli (2007) and abundance in
number (CPUE) for the species collected in each biotope: upstream (UBW) and downstream of the Branca Waterfall (DBW), in the Verde River, Upper Paraná River Basin, Brazil, from November 2010 to February 2012.
Voucher NUP
Abundance - number of individuals (CPUE)
by Biotope
UBW DBW
Class Chondrichthyes
ORDER MYLIOBATIFORMES
Family Potamotrygonidae
Potamotrygon cf. falkneri Castex & Maciel, 1963 10918 0.05* Class Osteichthyes
ORDER CHARACIFORMES
Family Paradontidae
Apareiodon affinis (Steindachner, 1879) 14457 0.11 0.16
Parodon nasus Kner, 1859 6194 0.85 0.53
Family Curimatidae
Steindachnerina insculpta (Fernández-Yápez, 1948) 1424 0.11*
Steindachnerina brevipinna (Eigenmann & Eigenmann, 1889) 2372 0.05* Family Prochilodontidae
Prochilodus lineatus (Valenciennes, 1836) 6151 1.06 2.07 Family Anostomidae
Leporinus sp. 0.05*
Leporellus vittatus (Valenciennes, 1850) 1902 1.06 0.64
Leporinus amblyrhynchus Garavello & Britski, 1987 14468 0.21*
Leporinus obtusidens (Valenciennes, 1836) 277 10.7 15.2
Leporinus friderici (Bloch, 1794) 1180 27.59 41.36
Leporinus lacustris Campos, 1945 3308 0.11*
Leporinus piavussu Britski, Birindelli & Garavello, 2012 14070 0.11 0.37
Leporinus octofasciatus Steindachner, 1915 11867 1.22 0.37
Leporinus striatus Kner, 1858 3810 0.16*
Schizodon altoparanae Garavello & Britski, 1990 2020 0.48*
Schizodon borellii (Boulenger, 1900) 1925 0.05 78.54
Schizodon nasutus Kner, 1858 2495 0.21*
Family Characidae
Astyanax aff. fasciatus (Cuvier, 1819) 32 17 4.34
Astyanax aff. paranae Eigenmann, 1914 133 0.37*
Astyanax altiparanae Garutti & Britski, 2000 6149 20.87 16.21
Moenkhausia aff. intermedia Eigenmann, 1908 3208 0.11*
Moenkhausia aff. sanctaefilomenae (Steindachner, 1907) 371 0.58 0.05
Piabina argentea Reinhardt, 1867 6209 0.05* Subfamily Salmininae
Salminus brasiliensis (Cuvier, 1816) 1865 3.23 1.85
Salminus hilarii Valenciennes, 1850 1893 0.69 0.26 Subfamily Bryconinae
Brycon orbignyanus (Valenciennes, 1850) 12174 0.32 0.37 Subfamily Serrasalminae
Myloplus tiete (Eigenmann & Norris, 1900) 2484 2.81 0.16
Serrasalmus maculatus Kner, 1858 396 0.42*
Serrasalmus marginatus Valenciennes, 1837 439 0.42* Subfamily Characinae
Galeocharax knerii (Steindachner, 1879) 263 0.16 6.94
Appendix A. Continued...
Voucher NUP
Abundance - number of individuals (CPUE)
by Biotope
UBW DBW
Family Acestrorhynchidae
Acestrorhynchus lacustris (Lütken, 1875) 14483 3.18 1.32 Family Cynodontidae
Rhaphiodon vulpinus Spix & Agassiz, 1829 11153 1.17* Family Erythrinidae
Erythrinus Erythrinus (Bloch & Schneider, 1801) 11197 0.11*
Hoplias sp. 1 292 2.38 1.54
Hoplias sp. 2 3457 0.53 0.21
Hoplias sp. 3 3458 0.16*
Family Hemiodontidae
Hemiodus orthonops Eigenmann & Kennedy, 1903 10609 12.18* ORDER SILURIFORMES
Family Callichthyidae
Callichthys callichthys (Linnaeus, 1758) 1722 0.05* Family Cetopsidae
Cetopsis gobioides Kner, 1858 2476 0.11*
Family Loricariidae Subfamily Ancistrinae
Megalancistrus parananus (Peters, 1881) 9111 0.05* Subfamily Loricariinae
Loricariichthys platymetopon Isbrücker & Nijssen, 1979 13632 0.26*
Loricariichthys rostratus Reis & Pereira, 2000 4730 0.11*
Rineloricaria latirostris (Boulenger, 1900) 13669 0.11 0.05
Rineloricaria sp. 0.05 0.05
Subfamily Hypostominae
Hypostomus ancistroides (Ihering, 1911) 332 0.05*
Hypostomus cf. cochliodon Kner, 1854 2556 2.86*
Hypostomus margaritifer (Regan, 1908) 1766 0.05*
Hypostomus microstomus Weber, 1987 1725 0.53 0.05
Hypostomus cf. nigromaculatus (Schubart, 1967) 12462 0.58 0.05
Hypostomus cf. regani (Ihering, 1905) 2286 1.85 0.37
Hypostomus cf. strigaticeps (Regan, 1908) 3190 2.54 0.95
Pterygoplichthys anisitsi Eigenmann & Kennedy, 1903 1529 0.16* Family Heptapteridae
Pimelodella avanhandavae Eigenmann, 1917 3455 0.05*
Pimelodella gracilis (Valenciennes, 1835) 3118 0.16 1.48
Pimelodella sp. 0.11*
Rhamdia quelen (Quoy & Gaimard, 1824) 2501 0.05* Family Pimelodidae
Hemisorubim platyrhynchos (Valenciennes, 1840) 2506 3.23*
Iheringichthys labrosus (Lütken, 1874) 671 0.42 0.64
Megalonema platanum (Günther, 1880) 1729 0.42*
Pimelodus cf. argenteus Perugia, 1891 3230 0.11*
Pimelodus maculatus La Cepède, 1803 420 0.05 0.32
Pimelodus microstoma Steindachner, 1877 14465 2.44 1.75
Pimelodus ornatus Kner, 1858 2492 0.16*
Appendix A. Continued...
Voucher NUP
Abundance - number of individuals (CPUE)
by Biotope
UBW DBW
Sorubim lima (Bloch & Schneider, 1801) 2494 0.26*
Family Doradidae
Pterodoras granulosus (Valenciennes, 1821) 4722 0.21*
Rhinodoras dorbignyi (Kner, 1855) 11151 0.32 0.11
Trachydoras paraguayensis (Eignmann & Ward, 1907) 9185 0.48* Family Auchenipteridae
Auchenipterus osteomystax (Miranda-Ribeiro, 1918) 2627 1.80*
Tatia neivai (Ihering, 1930) 2080 0.69 0.05
Parauchenipterus galeatus (Linnaeus, 1766) 3302 1.32*
ORDER GYMNOTIFORMES
Family Gymnotidae
Gymnotus inaequilabiatus (Valenciennes, 1839) 14327 0.05*
Gymnotus sylvius Albert & Fernandes-Matioli, 1999 13301 0.16 0.11 Family Sternopygidae
Eigenmannia trilineata López & Castello, 1966 14372 1.59 0.26
Eigenmannia virescens (Valenciennes, 1847) 14466 0.21 0.16 Family Apteronotidae
Sternopygus macrurus (Bloch & Schneider, 1801) 2096 0.21 0.16
Porotergus ellisi Arámburu, 1957 2092 0.21*
ORDER PERCIFORMES Family Cichlidae
Cichla kelberi Kullander & Ferreira, 2006 1746 0.11 0.05
Crenicichla britskii Kullander, 1982 14329 0.11*
Cichla piquiti Kullander & Ferreira, 2006 3379 0.05*
Species richness 50 70
*Species exclusive of each biotope.
References
GRAÇA, W.J. and PAVANELLI, C.S., 2007. Peixes da planície de inundação do alto rio Paraná e áreas adjacentes. Maringá: EDUEM. 241 p.