Television viewing and
abdominal obesity in women
according to smoking status:
results from a large
cross-sectional population-based
study in Brazil
Hábito de assistir televisão e
obesidade abdominal entre
mulheres fumantes: resultados
de um estudo transversal de base
populacional no Brasil
Taísa Rodrigues Cortes
IMichael Maia Schlussel
IIAna Beatriz Franco-Sena
IIFernanda Rebelo
IIGilberto Kac
II,IIII Graduate Program in Epidemiology, Rio de Janeiro State University, Rio de
Janeiro, Brazil.
II Graduate Program in Nutrition, Institute of Nutrition Josué de Castro, Federal
University of Rio de Janeiro, Rio de Janeiro, Brazil.
IIIDepartment of Social and Applied Nutrition, Institute of Nutrition Josué de
Castro, Federal University of Rio de Janeiro, Rio de Janeiro, Brazil.
Corresponding author: Gilberto Kac. Departamento de Nutrição Social e Aplicada do Instituto de Nutrição Josué de Castro da Universidade Federal do Rio de Janeiro – UFRJ. Avenida Carlos Chagas Filho, 367 – CCS – Bloco J – 2º andar, sala 29, Cidade Universitária – 21941-902 Ilha do Fundão, Rio de Janeiro, RJ, BRAZIL. E-mail: gilberto.kac@gmail.com
Abstract
Objective: To investigate the associations between television viewing and abdominal obesity (AO) in Brazilian women,
accord-ing to smokaccord-ing status. Methods: Data of
13,262 adult women (18-49 years) from the 2006’s Demographic Health Survey, a cross-sectional household study with complex probabilistic sample and national representativeness, were analyzed. AO,
de-fined as waist circumference ≥ 80.0 cm, was
the outcome. Television viewing frequency
(≥ 5 times/week, 1-4 times/week, < 1 time/
week) was the main exposure variable, and smoking status (yes or no) the main co-variable. Prevalence ratios were estimated using Poisson regression models separately
for smokers and non-smokers. Results: A
statistically significant interaction term was observed between smoking status and television viewing (p < 0.05). Prevalence of AO among smokers who reported
televi-sion viewing ≥ 5 times/week amounted to
59.0%, higher than the 35.0% for those with < 1 time/week television viewing (p-value = 0.020). The values for non-smokers were 55.2% and 55.7%, respectively. Smokers with
television viewing ≥ 5 times/week were 1.7
times (95% CI: 1.1–2.5) more likely to pre-sent AO, compared to those who reported a frequency < 1 time/week. There was no significant association among non-smokers.
Conclusions: Television viewing ≥ 5 times/ week may increase the prevalence of AO among women who smoke. More detailed information on media use, as hours per day, may offer better estimates.
Resumo
Objetivo: Investigar a associação entre a frequência assistindo televisão e obesidade abdominal (OA) entre mulheres
brasilei-ras, segundo o hábito de fumar. Métodos:
Foram analisados os dados de 13.262 mul-heres adultas (18-49 anos) estudadas na Pesquisa Nacional de Demografia e Saúde (PNDS-2006), um estudo transversal, com amostragem probabilística complexa, de representatividade nacional. OA, definida
como circunferência da cintura ≥ 80.0 cm,
foi considerada como desfecho. A
frequên-cia assistindo televisão (≥ 5 vezes/semana,
1-4 vezes/semana, < 1 vez/semana) foi a principal variável de exposição e o hábito de fumar (sim ou não) a principal covariável. Foram estimadas razões de prevalência por meio de modelos de regressão de Poisson, para fumantes e não fumantes
separada-mente. Resultados: Observou-se interação
estatisticamente significante entre frequên-cia assistindo televisão e hábito de fumar (p < 0,05). A prevalência de OA entre mulheres
fumantes que assistiam televisão ≥ 5 vezes/
semana foi de 59,0%, e maior do que 35,0% entre aquelas que assistiam televisão < 1 vez/semana (p-valor = 0,02). Os valores de OA para não fumantes foram 55,2% e 55,7%, respectivamente. Fumantes que assistiam
televisão ≥ 5 vezes/semana apresentaram
chance 1,7 (1,1–2,5) vezes maior de ter OA, comparadas aquelas que relataram assistir televisão < 1 vez/semana. Não se observou associação significante para não fumantes.
Conclusão: Assistir televisão ≥ 5 vezes/se-mana pode aumentar a prevalência de OA entre as mulheres fumantes. Informações mais detalhadas sobre a frequência de as-sistir televisão, como o número de horas por dia, podem oferecer melhores estimativas.
Palavras-chave: Circunferência da cin-tura. Obesidade abdominal. Televisão. Tabagismo. Estudo de base populacional. Saúde da mulher.
Introduction
The World Health Organization (WHO)
recognizes obesity as a global epidemic1.
In Brazil, the increase in prevalence of overweight and obesity in the population has been associated primarily with the nutritional transition, characterized by an increase in the consumption of refined car-bohydrates and saturated and trans fats, and a reduction in the intake of complex
carbo-hydrates, fibers, and polyunsaturated fats2.
Reduction in energy expenditure is considered one important determinant of
the obesity epidemic3. Time spent watching
television is the most investigated sedentary practice and some studies have reported a positive association between
televi-sion viewing, overweight and obesity4-6.
The probable explanation consists in the decrease in expenditure and increase in energy intake during time spent on
televi-sion viewing7.
Television viewing is a leisure activity
accessible to all. According to the Pesquisa
Nacional por Amostra de Domicílios (PNAD – National Household Sample Survey), the proportion of Brazilian households with
television was 94.5% in 20078. In this same
year, in the United States, watching televi-sion was the most frequent leisure activity, occupying approximately three hours per day9.
Smokers frequently present lower
BMI when compared to non-smokers10-12,
although smoking may favor abdominal
obesity (AO) accumulation13-15. Smoking
and AO are primary risk factors for several
chronic diseases16-17 and the presence of
these two conditions simultaneously leads to an increase in the risk for unfavorable
outcomes18-19. The conceptual framework
of the present study is based on the as-sumption that an increased number of smoked cigarettes is positively associated with a higher television viewing frequency, which in turn is associated with increased risk of AO20.
smoking as a modifier of the relationship between television viewing and AO. In this regard, the present study undertook as its objective to investigate the association be-tween television viewing frequency and AO among smoking and non-smoking Brazilian women aged 18-49 years.
Methods
The data were derived from the third edition of the Demographic Health Survey (DHS), conducted in 2006-07, in Brazil. This was a population-based household survey targeting women of reproductive age, including mothers of children younger than five years of age. DHS was a nationally representative cross-sectional study with a complex sampling design. Ten sampling strata were defined, based on a combination of the five Brazilian geographical regions
and urban vs. rural areas. The respondents’
sampling weights were derived from the household sampling weights and took into account the possibility that there may be more than one eligible woman in each household. The weights were adjusted due to non-response within households and were calibrated based on official population estimates released by the Instituto Brasileiro de Geografia e Estatística (IBGE – Brazilian Institute of Geography and Statistics).
Data from 15,575 women living in 13,056 households were collected, including infor-mation from households that contained at least one eligible woman. For the present analysis, data from 13,262 adult women aged 18-49 years, who were not pregnant at the time of the interview and with available waist circumference (WC) measurements, were considered. Structured questionnaires were applied through in-person interviews and anthropometric measures were taken. Data collected included socioeconomic status, lifestyle and reproductive history.
AO was evaluated using WC measure-ments (cm) collected according to WHO recommendations. WC was measured twice at the point between the last rib and the iliac crest with an inelastic measuring tape. The
mean value was used as the final estimation. Subjects were classified in two categories:
WC < 80 cm (adequate); WC ≥ 80.0 cm (AO)21.
The frequency of television viewing was considered the main exposure variable and was collected through the question “do you usually watch television?” Originally, the following frequency options were available: everyday, almost every day, at least once a week, less than once a month, and does not watch. According to the original categories, 80% of women watched TV every day, 10% almost every day, 5% at least once a week, 1% less than once a month and 4% did not watch TV. Participants were regrouped into the following categories of television frequency, aiming to avoid categories with
a small number of subjects: ≥ 5 times/week
(90%), 1-4 times/week (5%) and < 1 time/ week (5%).
The main co-variable was smoking habit; assessed through the question “do you currently smoke?” Individuals were classified as smokers and non-smokers. The other co-variables were included in the analysis aiming to control confounding in the relationship between television viewing, smoking, and AO: age group (18-19, 20-29, 30-39, 40-49 years), ethnicity (white, black,
mixed and others), parity (zero, 1, 2, ≥ 3
chil-dren), marital status (married, cohabiting, not cohabiting), family income (quartiles), and geographical region (North, Northeast, Southeast, South, Midwest).
Statistical analyses were conducted considering the complex sample design. Initially, the samples’ characteristics were
described according to WC (≥ 80 / < 80 cm)
AO were conducted separately for smokers and non-smokers, because a statistically significant interaction effect on the preva-lence of AO was found between television viewing and smoking status. Analyses were performed using the STATA 9.2 software.
Results
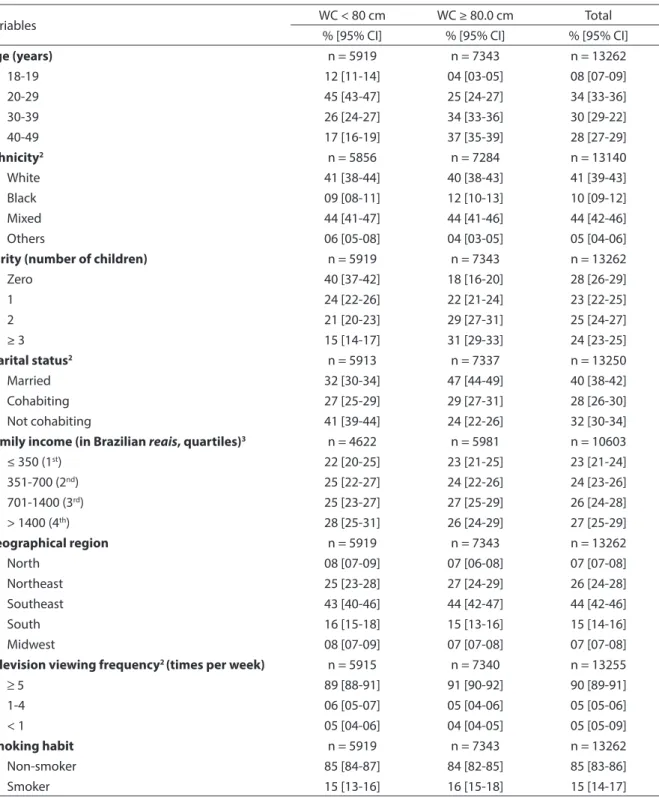
Women with AO were more likely to be-long to older age groups, to be married and to have three or more children. Approximately
90% of women watched television ≥ 5 times/
week. The overall prevalence of AO amounted to 55% (Table 1). Non-smoker women were younger and had lower parity when com-pared with smoking women. Comparisons between smokers and non-smokers revealed significant differences in geographical region and marital status (results not shown).
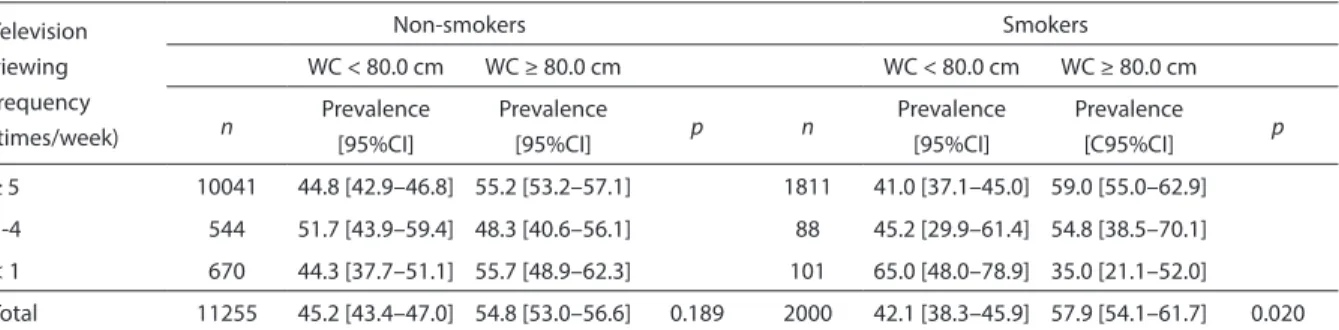
The prevalence of AO amounted to 59% among smoking women with the high-est frequency of television viewing when compared to 35% for those with < 1 time/ week (p-value=0.020). Among non-smoking women, there was only a slight difference in the prevalence of AO when comparing frequencies of television viewing (55.2% vs. 55.7%, p-value=0.189) (Table 2).
Prevalence ratios showed that AO among smokers was 1.7 (95%CI: 1.1–2.5) times more frequent for women with a
televi-sion viewing frequency ≥ 5 times/week,
when compared to smoking women with a frequency < 1 times/week. The results were adjusted for age, parity, ethnicity, and marital status. The relationship between television viewing frequency and AO was not significant among non-smoking women (PR=1.1; 95%CI: 0.9–1.2) (Table 3).
Discussion
The results of the present investigation revealed an interaction between television viewing and smoking status in a sample of Brazilian women aged 18-49 years, the reason why the multiple adjusted Poisson regression models were stratified accord-ing to smokaccord-ing status. Among smokers,
television viewing five or more times per week represented an increase of 70% in the prevalence of AO, in comparison with smok-ers who reported watching television less than once a week. These results remained significant in the adjusted analysis, when confounding factors such as age, ethnicity, parity, and marital status were controlled. Among non-smokers, the prevalence ratio of obesity for those with a television viewing frequency of five or more times per week (1.1; 95% CI: 0.9-1.2), in comparison to those who reported watching television less than once a week, was not statically significant. It is important to note, however, that despite the lower prevalence of AO among smokers who watched television less than once a week, the prevalence of AO was high and al-most identical among those with the highest television viewing frequency, independently of the smoking status.
To our knowledge, no study has consid-ered the effect of modification of smoking on media use frequency, including the amount of time of daily television viewing and AO. The present discussion is based on a hypothesis that follows a previously established conceptual framework. The first part considers the relationship among smoking intensity, television exposure and a higher likelihood of developing AO, which might explain how smoking is capable of modifying the effect of media exposure on AO. The second part relies on studies which revealed that smokers had a lower qualita-tive dietary intake, fewer healthy habits,
and an increased risk for central obesity22,23,
when compared to non-smokers.
A recent study revealed that excessive television exposure and smoking intensity were positively related, meaning that more television exposure is associated to more
smoking 20. Although the relationship
Table 1 - Characteristics of the women studied according to waist circumference (WC) – National Survey of Women and Child Demography and Health1 (2006)
Tabela 1 - Características das mulheres estudadas, segundo circunferência da cintura (CC) – Pesquisa Nacional de Demograia
e Saúde da Criança e da Mulher1 (2006).
Variables WC < 80 cm WC ≥ 80.0 cm Total
% [95% CI] % [95% CI] % [95% CI]
Age (years) n = 5919 n = 7343 n = 13262
18-19 12 [11-14] 04 [03-05] 08 [07-09]
20-29 45 [43-47] 25 [24-27] 34 [33-36]
30-39 26 [24-27] 34 [33-36] 30 [29-22]
40-49 17 [16-19] 37 [35-39] 28 [27-29]
Ethnicity2 n = 5856 n = 7284 n = 13140
White 41 [38-44] 40 [38-43] 41 [39-43]
Black 09 [08-11] 12 [10-13] 10 [09-12]
Mixed 44 [41-47] 44 [41-46] 44 [42-46]
Others 06 [05-08] 04 [03-05] 05 [04-06]
Parity (number of children) n = 5919 n = 7343 n = 13262
Zero 40 [37-42] 18 [16-20] 28 [26-29]
1 24 [22-26] 22 [21-24] 23 [22-25]
2 21 [20-23] 29 [27-31] 25 [24-27]
≥ 3 15 [14-17] 31 [29-33] 24 [23-25]
Marital status2 n = 5913 n = 7337 n = 13250
Married 32 [30-34] 47 [44-49] 40 [38-42]
Cohabiting 27 [25-29] 29 [27-31] 28 [26-30]
Not cohabiting 41 [39-44] 24 [22-26] 32 [30-34]
Family income (in Brazilian reais, quartiles)3 n = 4622 n = 5981 n = 10603
≤ 350 (1st) 22 [20-25] 23 [21-25] 23 [21-24]
351-700 (2nd) 25 [22-27] 24 [22-26] 24 [23-26]
701-1400 (3rd) 25 [23-27] 27 [25-29] 26 [24-28]
> 1400 (4th) 28 [25-31] 26 [24-29] 27 [25-29]
Geographical region n = 5919 n = 7343 n = 13262
North 08 [07-09] 07 [06-08] 07 [07-08]
Northeast 25 [23-28] 27 [24-29] 26 [24-28]
Southeast 43 [40-46] 44 [42-47] 44 [42-46]
South 16 [15-18] 15 [13-16] 15 [14-16]
Midwest 08 [07-09] 07 [07-08] 07 [07-08]
Television viewing frequency2 (times per week) n = 5915 n = 7340 n = 13255
≥ 5 89 [88-91] 91 [90-92] 90 [89-91]
1-4 06 [05-07] 05 [04-06] 05 [05-06]
< 1 05 [04-06] 04 [04-05] 05 [05-09]
Smoking habit n = 5919 n = 7343 n = 13262
Non-smoker 85 [84-87] 84 [82-85] 85 [83-86]
Smoker 15 [13-16] 16 [15-18] 15 [14-17]
1. Data refer to non-pregnant 18-49 year old women. 2. Variables with losses lower than 1%. 3. Variable with losses higher than 20%. Notes: Estimates were weighted and standard error was corrected to take into account the complex sampling design. Chi-square tests were significant (p < 0.01) for age category, ethnicity, parity and marital status.
The positive association between televi-sion viewing and obesity is well documented in the literature24,25. Cleland et al.26 observed
a greater prevalence of level-2 AO among Australian women who watched television for three hours a day, in comparison to those who watched only one hour a day. These
results are in line with our study.
The second part of the potential expla-nation considers the associated life style habits that smokers tend to have. Smokers show a reduced consumption of fruits,
veg-etables, fibers, vitamins, and minerals23,27,28.
Furthermore, smokers tend to consume Table 2 - Prevalence and conidence intervals (95%CI) of waist circumference (WC) categories according to the television viewing frequency and smoking status - National Survey of Women’s and Child Demography and Health1 (2006).
Tabela 2 - Prevalência e intervalos de coniança (IC 95%) de categorias de circunferência da cintura (CC) segundo frequência
assistindo televisão e hábito de fumar – Pesquisa Nacional de Demograia e Saúde da Criança e da Mulher1(2006).
Television viewing frequency (times/week)
Non-smokers Smokers
WC < 80.0 cm WC ≥ 80.0 cm WC < 80.0 cm WC ≥ 80.0 cm
n Prevalence
[95%CI]
Prevalence
[95%CI] p n
Prevalence [95%CI]
Prevalence
[C95%CI] p
≥ 5 10041 44.8 [42.9–46.8] 55.2 [53.2–57.1] 1811 41.0 [37.1–45.0] 59.0 [55.0–62.9]
1-4 544 51.7 [43.9–59.4] 48.3 [40.6–56.1] 88 45.2 [29.9–61.4] 54.8 [38.5–70.1]
< 1 670 44.3 [37.7–51.1] 55.7 [48.9–62.3] 101 65.0 [48.0–78.9] 35.0 [21.1–52.0]
Total 11255 45.2 [43.4–47.0] 54.8 [53.0–56.6] 0.189 2000 42.1 [38.3–45.9] 57.9 [54.1–61.7] 0.020
Notes: Estimates were weighted and standard error was corrected to take into account the complex sampling design. P values refer to Chi-square test for difference of proportions.
1. Data on this table refer to non-pregnant 18 to 49-year-old women.
Notas: As estimativas são ponderadas e o erro padrão foi corrigido para considerar o desenho amostral complexo. O valor de p se refere ao teste Qui-quadrado para diferença de proporções.
1. Os dados desta tabela são referentes a mulheres não grávidas com idade de 18 a 49 anos.
Table 3 - Crude and adjusted prevalence ratio (PR) with conidence intervals (95%CI) of abdominal obesity according to television viewing frequency and smoking status - National Survey of Women’s and Child Demography and Health1 (2006).
Tabela 3 - Razão de prevalências bruta e ajustada e intervalos de coniança (IC 95%) para obesidade abdominal, segundo frequência assistindo televisão e hábito de fumar - Pesquisa Nacional de
Demograia e Saúde da Criança e da Mulher1 (2006).
Television viewing frequency (times/week)
Abdominal Obesity (WC ≥ 80 cm)
n Crude PR [95% CI] n Adjusted* PR [95% CI]
Non-smokers 11255 11139
≥ 5 10041 1.0 [0.9-1.1] 9937 1.1 [0.9-1.2]
1-4 544 0.9 [0.7-1.1] 539 1.0 [0.8-1.2]
< 1 670 1.0 663 1.0
Smokers 2000 1982
≥ 5 1811 1.7 [1.1-2.7] 1796 1.7 [1.1-2.5]
1-4 88 1.6 [0.9-2.7] 86 1.5 [0.9-2.5]
< 1 101 1.0 100 1.0
Note: Prevalence ratios (PR) were obtained by Poisson regression model. Estimates were weighted and standard error correc-ted to take into account the complex sampling design. 1. Data refer to non-pregnant 18 to 49-year-old women. *Adjuscorrec-ted for age, parity, ethnicity, and marital status.
more alcoholic beverages and coffee and
practice less physical activities29. It is known
that smoking and inadequate eating habits can be related to a tendency to be involved
in other unhealthy behaviors30. The
accu-mulation of these unhealthy habits is more likely to occur when the number of
ciga-rettes smoked daily is greater31,32. Bowman
et al.7 described that individuals who spend
more time in front of the television have a greater energy intake and consume greater quantities of fat, protein, and carbohy-drates, including added sugars.
Our results corroborate with some stud-ies that have already described that smoking women tend to have greater central adipos-ity33. Troisi et al.13, confirmed the direct
ef-fect of smoking habit over the distribution of body fat, and verified that this relation was independent from other behavioral factors related to smoking, such as alcohol intake and physical activity. The evidences in regards to the biological mechanisms related to smoking and patterns of body fat
distribution are still inconclusive34. Some
results have indicated that abdominal fat accumulation is influenced by cortisol concentration. Smokers were shown to have higher cortisol levels compared to
non-smokers35,36. Apart from that, Carney
& Goldberg37 described that the smoking
habit may induce an increase in lipoprotein lipase activity, deregulating the uptake and storage of triglycerides and fatty acids by the adipocytes, consequently generating an increase in fat mass. In addition, evidences indicate that nicotine may have an
anti-estrogenic effect38.
One strength of this investigation is the fact of being a population-based study comprised of a representative sample of the Brazilian population of women aged 18-49 years, which is, therefore, an ex-pressive sample size. Moreover, this study
investigated an issue which is not well documented in the literature yet. However, it is also important to highlight some limi-tations. Ideally, the main co-variable of this study, television viewing frequency, should have been measured in terms of dura-tion as minutes or at least hours per day, considering that approximately 90% of the sample watches television on a daily basis. A more sensitive measure of smoking, such as number of cigarettes per day, would have provided better estimates as well. These limitations could bias the results, although the potential direction of bias cannot be predicted. Other limitations include the lack of data on food consumption and physical activity, important determinants of AO.
From the perspective of public health, it is important to accumulate evidences of the negative effects of smoking and unhealthy habits, such as high television viewing frequency, on the distribution of body fat. It is important to draw the atten-tion of internaatten-tional organizaatten-tions to the lack of clear regulation for advertisements on television. It is known that the absence of a more explicit control exposes children, men, and women to an expressive number of unhealthy products.
Conclusion
Among women who smoke, watching television five or more times per week may increase the prevalence of AO in comparison with those that watched television less than once a week. Television viewing had no effect on AO prevalence among non-smokers.
Ethical approval: The State of São Paulo Department of Health Research Ethics Committee approved this research project.
References
1. World Health Organization. Physical status: the use and interpretation of anthropometry. WHO Technical Report Series 1995, 854. Geneva: World Health Organization, 1995.
2. Levy-Costa RB, Sichieri R, Pontes NS, Monteiro CA. Household food availability in Brazil: distribution and trends (1974-2003). Rev Saúde Pública 2005; 39: 530-40.
3. Dietz WH. Health consequences of obesity in youth: childhood predictors of adult disease. Pediatrics 1998; 101: 518-25.
4. Tucker LA, Bagwell M. Television viewing and obesity in adult females. Am J Public Health 1991; 81: 908-911.
5. Salmon J, Bauman A, Crawford D, Timperio A, Owen N. The association between television viewing and overweight among Australian adults participating in varying levels of leisure-time physical activity. Int J Obes 2000; 24: 600-6.
6. Bowman SA. Television-viewing characteristics of adults: Correlations to eating practices and overweight and health status. Prev Chronic Dis 2006; 3(S2): 1-11.
7. Robinson TN. Does television cause childhood obesity? J Am Med Assoc 1998; 279: 959-60.
8. Instituto Brasileiro de Geografia e Estatística. Pesquisa Nacional por Amostra de Domicílios (PNAD) 2007. Available in: [http://www.ibge.gov.br/home/estatistica/ populacao/trabalhoerendimento/pnad2007/default. shtm]. [Accessed on February 1st, 2009]
9. Bureau of Labor Statistics. American Time Use Survey Summary. United States Department of Labor. Available in: http://www.bls.gov/news.release/atus.nr0.htm. [Accessed on January 30th, 2009]
10. Albanes D, Jones DY, Micozzi MS, Mattson M. Associations between smoking and body weight in the US population: Analysis of NHANES 11. Am J Public Health 1987; 77: 439-44.
11. Molarius A, Seidell JC, Kuulasmaa K, Dobson AJ, Sans S. Smoking and relative body weight: an international perspective from the WHO MONICA Project. J Epidemiol Community Health 1997; 51: 252-60.
12. Huot I, Paradis G, Ledoux M. Quebec Heart Health Demonstration Project Research Group. Factors associated with overweight and obesity in Quebec adults. Int J Obes Relat Metab Disord 2004; 28: 766–74.
13. Troisi RJ, Heinold JW, Vokonas PS, Weiss ST. Cigarette smoking, dietary intake, and physical activity: effects on body. Am J Clin Nutr 1991; 53: 1104-11.
14. del Arbol, JL, Raya Munoz, J, Ojeda L, Lopez Cascales A, Rico Irles J, Miranda MT et al. Plasma concentrations of beta-endorphin in smokers who consume different numbers of cigarettes per day. Pharmacol Biochem Behav 2000; 67: 25-28.
15. Canoy D, Wareham N, Luben R, Welch A, Bingham S, Day N et al. Cigarette smoking and fat distribution in 21,828 British men and women: a population-based study. Obes Res 2005; 13: 1466-1475.
16. Centers for Disease Control and Prevention (CDC): Cigarette smoking among adults - United States, 2002. MMWR Morb Mortal Wkly Rep 2004; 53: 427.
17. Vassale C, Maffei S, Ndreu R, Mercuri A. Age-related oxidative stress modulation by smoking habit and obesity. Clin Bioch 2009, doi:10.1016/j. clinbiochem.2008.11.017.
18. Peeters A, Barendregt JJ, Willekens F, Mackenbach JP, Al Mamun A, Bonneux L. NEDCOM, the Netherlands Epidemiology and Demography Compression of Morbidity Research Group. Obesity in adulthood and its consequences for life expectancy: a life-table analysis. Ann Intern Med 2003; 138: 24-32.
19. Healton CG, Vallone D, McCausland KL, Xiao H, Green MP. Smoking, obesity, and their co-occurrence in the United States: cross sectional analysis. BMJ 2006; 333: 24-6.
20. Gutschoven, K. and J. Van den Bulck. Television viewing and smoking volume in adolescent smokers: a cross-sectional study. Prev Med 2004; 39: 1093-8.
21. World Health Organization. Preventing and Managing the Global Epidemic. Report of a WHO Consultation on Obesity. Geneva: World Health Organization; 1998.
22. Delahanty JC, DiClemente CC, Havas S, Langenberg P. Smoking status and stages of change for dietary behaviors among WIC women. Am J Health Behav 2008; 32: 583-93.
23. Subar FA, Harlan CL, Mattson EM. Food and nutrient intake differences between smokers and non-smokers in the US. Am J Public Health 1990; 80: 1323-9.
24. Jeffery RW, French SA. Epidemic Obesity in United States: are Fast Foods and Television Viewing contributing? Am J Public Health 1998; 88: 277-80.
25. Vioque J, Torres A, Quiles J. Time spent watching television, sleep duration and obesity in adults living in Valencia, Spain. Int J Obes 2000; 24: 1683-8.
26. Cleland VJ, Schmidt MD, Dwyer T, Venn AJ. Television viewing and abdominal obesity in young adults: is the association mediated by food and beverage consumption during viewing time or reduced leisure-time physical activity? Am J Clin Nutr 2008; 87: 1148-55.
28. Dyer AR, Elliott P, Stamler J, Chan Q, Ueshima H, Zhou BF et al. Dietary intake in male and female smokers, ex-smokers, and never smokers: The INTERMAP Study. J Hum Hypertens 2003; 17: 641-654.
29. Castro JM, Taylor T. Smoking status relationships with the food and fluid intakes of free-living humans. Nutrition 2008; 24: 109-19.
30. French SA, Perry CL. Smoking among adolescent girls: prevalence and etiology. J Am Med Wom Assoc 1996; 51: 25-8.
31. Rigotti NA. Treatment options for the weight-conscious smoker. Arch Intern Med 1999; 159: 1169-71.
32. French SA, Jeffery RW. Weight concerns and smoking: a literature review. Ann Behav Med 1995; 17: 234-44.
33. Marques-Vidal P, Bochud M, Mooser V, Paccaud F, Waeber G, Vollenweider P. Prevalence of obesity and abdominal obesity in the Lausanne population. BMC Public Health 2008; 8: 330 doi:10.1186/1471-2458-8-330.
34. Pasquali R, Vicennati V. Activity of the hypothalamic-pituitary-adrenal axis in different obesity phenotypes. Int J Obes Relat Metab Disord 2000; 24(S): S47-9.
35. Cryer PE, Haymond MW, Santiago JV, Shah SD.
Norepinephrine and epinephrine release and adrenergic mediation of smoking-associated hemodynamic and metabolic events. N Engl J Med 1976; 295(11): 573-7.
36. Steptoe A and Ussher M. Smoking, cortisol and nicotine. Int J Psychophysiol 2006; 59 (3): 228-35.
37. Carney RM, Goldberg AP. Weight gain after cessation of cigarette smoking. A possible role for adipose-tissue lipoprotein lipase. N Engl J Med 1984; 310: 6146.
38. Tanko LB, Christiansen C. An update on the antiestrogenic effect of smoking: a literature review with implications for researchers and practitioners. Menopause 2004; 11(1): 104-9.