Conformity of pre-gestational
weight measurement and
agreement of anthropometric
data reported by pregnant
women and those recorded in
prenatal cards, City of Rio de
Janeiro, 2007–2008
Conformidade da aferição de peso
no pré-natal e concordância das
informações antropométricas
referidas pelas gestantes e registradas
nos cartões de pré-natal, Município
do Rio de Janeiro, 2007–2008
Roberta Pereira NiquiniI
Sonia Azevedo BittencourtII
Maria do Carmo LealII
IPostgraduate Program of Epidemiology in Public Health, Escola Nacional de Saúde Pública Sergio Arouca, Fundação Oswaldo Cruz – Rio de Janeiro (RJ), Brazil.
IIDepartament of Epidemiology and Quantitative Methods in Health, Escola Nacional de Saúde Pública Sergio Arouca, Fundação Oswaldo Cruz – Rio de Janeiro (RJ), Brazil.
Corresponding author: Roberta Pereira Niquini. Escola Nacional de Saúde Pública Sergio Arouca. Fundação Oswaldo Cruz, Rua Leopoldo Bulhões 1.480, 8º andar, Manguinhos, CEP: 21041-210, Rio de Janeiro, RJ, Brazil. E-mail: [email protected]
Financing source: Fundação Carlos Chagas Filho de Amparo à pesquisa do Estado do Rio de Janeiro – FAPERJ (APQ1 - 170.710/2007), PAPES / FIOCRUZ V (APQ - 403579/2008-2) and the technical department of health of adolescents of the Ministry of Health. Niquini RP was supported by FAPERJ (E-26/100.366/2012; doctoral scholarship).
Conlict of interests: nothing to declare.
Abstract
Objective: To assess the conformity of the weight measurement process in the pre-gestational care ofered in the city of Rio de Janeiro by primary units and hospi-tals of the National Health System, as well as to verify the agreement between the anthropometric data reported by pregnant women and those recorded in prenatal
cards. Method: A cross-sectional study
was conducted in 2007 – 2008 with two cluster samples: one to obtain a sample of pregnant women to be interviewed and another one for the weight measurement procedures to be observed. he confor-mity of the weight measurement process was evaluated according to the Ministry of Health standards, and the agreement between the two sources of anthropometric data was evaluated using mean diferences, Bland–Altman method, intraclass
correla-tion coeicient (ICC) and weighted Kappa.
Results: Out of the twelve criteria for weight measurement evaluation (n = 159 observa-tions), three weren’t in conformity (< 50% of conformity), two of them only need to be assessed when the scale is mechanical. For the interviewed pregnant women (n = 2,148), who had the two sources of anthropometric data, there was a tendency of self-reported height overestimation and pre-gestational and current weight and Body Mass Index underestimation. Accordance between the two sources of anthropometric information,
according to ICC and weighted Kappa, were
high (> 0.80). Conclusion: Studies may use
weight and height information reported by pregnant women, in the absence of prena-tal cards records, when it is an important economy to their execution, although the improvement of these two sources of infor-mation by means of better anthropometric process is necessary.
Introduction
he Ministry of Health recommends that prenatal care should involve the questioning on pre-gestational weight and the height measurement in the irst appointment, and current weight in all appointments with subsequent calculation of Body Mass Index (BMI), classiication of nutritional status, prediction and follow-up of weight
gain1, which enable the prevention and
the treatment of nutritional disorders associated with unfavorable gestational
outcomes2,3. When these data are
regis-tered in the medical record and card of the pregnant women, it is possible to make information available for the follow-up of the nutritional status by professionals of diferent health services and for studies that can contribute in the formulation of health
and nutrition policies1,4.
he medical record stands out as the main source of information to
analyze the process of care5, but since it
is incomplete6,7, it is usually necessary to
supplement it with other sources, such as
interviews with the users5.
Tendencies of overestimation of height and underestimation of referred weight and BMI have been observed, even though the level ranges according to
characteristics of the population8,9, besides
laws in the process of weight measurement among users of the Uniied Health System
(SUS – Sistema Único de Saúde)10,11, which
can compromise not only the registers of anthropometric measures, but also the values reported by the users. It is worth to mention that, despite the broad demand for nutritional care among pregnant women
assisted at SUS12, little is known about the
conformity of its weighing process.
herefore, this study aimed at assessing the conformity of the weighing process in the prenatal care of Basic Health Units
(UBS – Unidades Básicas de Saúde) and
hospitals of SUS in the city of Rio de Janeiro, according to the recommendations of the Ministry of Health, as well as to verify the agreement between the anthropometric
Resumo
Objetivo: Avaliar a conformidade do processo de pesagem no atendimento pré-natal de unidades básicas e hospitais do Sistema Único de Saúde no Municí-pio do Rio de Janeiro, bem como verii-car a concordância das informações antropométricas referidas pelas gestan-tes e registradas nos cartões de pré-natal.
Método: Foi conduzido um estudo seccio-nal em 2007 – 2008 para o qual foram reali-zadas duas amostragens por conglomera-do, uma para obter a amostra de gestantes a serem entrevistadas e outra para obter a dos processos de pesagem a serem observados. A conformidade da pesagem foi avaliada segundo normas do Ministério da Saúde e a concordância entre as duas fontes de infor-mação antropométrica foi veriicada por meio das médias das diferenças, método de Bland–Altman, coeiciente de
correla-ção intraclasse (CCIC) e Kappa ponderado.
Resultados: Dos doze critérios de pesagem (n = 159 observações), três revelaram-se não conformes (< 50% de conformidade), dois deles necessários apenas em balanças mecânicas. Para as gestantes entrevista-das (n = 2.148), que tinham as duas fontes de informação antropométrica, observa-ram-se tendências dos valores referidos superestimarem a estatura e subestima-rem o peso e Índice de Massa Corporal pré-gestacionais e atuais. As concordân-cias entre as duas fontes de informação,
segundo CCIC e Kappa ponderado, foram
altas (> 0,80). Conclusão: Estudos podem
usar informações de peso e estatura referi-dos pelas gestantes, na ausência de regis-tros nos cartões, quando esta economia for importante para sua execução, embora seja necessário o aprimoramento dessas duas fontes de informação, mediante melhoria do processo antropométrico.
data referred by the pregnant women and those registered in their prenatal cards.
Methods
his is a subproject inserted in the
interinstitutional study “Avaliação da
qualidade da assistência pré-natal na rede SUS do Município do Rio de Janeiro”
(Assessmenf of prenatal care in SUS in the city of Rio de Janeiro), conducted
by the research group “Saúde da Mulher,
da Criança e do Adolescente – Determinante Sociais, Epidemiologia e Avaliação de Políticas, Programas e Serviços” (Health of the Women, Child and Adolescent – Social Determinants, Epidemiology, and Assessment of Policies, Programs and Services). For that, two cluster samples were performed in two stages: one to obtain the sample of weight measurement processes to be observed and the other one to obtain the sample of pregnant women to be interviewed.
For both sampling plans, the irst stage selected the health establishments with low-risk prenatal care in the SUS network of the city of Rio de Janeiro, and places with high rates of violence (5%) and monthly average of prenatal appointments lower than 80 (19%) were excluded, according to data from the Municipal Health Secretariat of Rio de Janeiro (SMS-RJ) for the irst semester of 2005.
hese primary selection units were stratiied into UBS and hospitals. Inside these strata, there was a simple random selection by programmatic area (territorial and administrative division adopted by SMS-RJ), and the number of units selected in each programmatic area was propor-tional to the number of existing ones. Out of all of the units that met the selection criteria, 40% of the hospitals (n = 5) and UBS (n = 26) were selected, and such percentage was not higher in order to make the logistics of data collection feasible, given the calcu-lated sample size and existing resources.
In the second sampling stage of weight measurement processes, one shift
of prenatal care was randomly selected in each one of the 31 health units of the sample. In each selected shift, the weight measurement process of the ive irst pregnant women who were weighed was observed, at the presence of a health profes-sional in charge of weight measurement; of the irst four pregnant women weighed by each professional, at the presence of two professionals in charge; and of the three pregnant women weighed by each profes-sional, when there were three professionals in charge. he sample calculation of the weighing observations was established by considering a 5% signiicance level, 50% percentage, 9.7% margin of error and design efect of 1.5, accounting for 155 observations.
In the second sampling stage of pregnant women to be interviewed, they were selected according to days of the week and work shifts, systematically, according to the order of exit of prenatal appointments with the doctor or nurse, until fulilling the sample predicted for each health unit. In order to obtain the interval for the systematic sampling, when the interviewers arrived to the units they checked the number of pregnant women, at any gestational age, which would be assisted in the shift, and divided it by six (maximum number of interviewees per shift).
After prenatal appointments, the selected pregnant women were invited to participate in the research (stages of interview and photocopy of the prenatal card); those who refused to participate were asked to answer about age and schooling. In order to test if the pregnant women who refused to participate in the study and the ones who participated showed diferences with regard to these characteristics, the non-parametric Mann-Whitney test was used. hese refusals (6.6%) were replaced in the sample.
design efect (1.5), accounting for the sample of 2,187 pregnant women. Sample allocation was proportional to the monthly average of prenatal appointments in the irst semester of 2005 in each stratum, being 63% for UBS, 35% for hospitals and 2% for labor homes, and the sample size of each stratum was divided by the number of sample units per stratum, accounting for 53 interviews in each UBS, 153 per hospital and 44 for the labor home. Even though the labor home (only one in the city) was considered as a stratum for sample planning, it was excluded from the analysis for the inclusion of the design efect, thus obtaining a sample of 2,148 pregnant women.
For the conduction of statistical analyses, each element of the samples was pondered by the inverse of its selection probability, and a calibration to restitute the known distribution of prenatal appointments.
he instruments used to interview pregnant women and to directly observe the weighing process were tested in a pilot study, and the ield team in charge of its application was comprised of 6 supervisors and 36 trained interviewers. Data collection took place from November 2007 to 2008. Questionnaires went through three revision steps and double typing in the Access software.
he instruments of direct observation used to assess the conformity of the weight measurement process of pregnant women was built based on the procedures described in Food and Nutritional Surveillance
Guide of Sisvan13 and in the Prenatal
and Postpartum Guide of the Ministry of
Health1. hese were adopted as conformity
patterns assessed by twelve criteria, divided into four evaluation blocks: (1) Conditions of scale and environment before weight measurement (criteria: environment in which the low of people is not detrimental to the execution of the process, locked scale and calibrated/zero scale); (2) Preparation of the pregnant women for weight measurement (criteria: barefoot pregnant woman, with light clothes and at the center of the scale); (3) Weight reading (criteria: reading facing the scale, when the needle of the scale beam was aligned with the wheel,
reading and registration with the locked scale and with the woman on the scale); (4) Place of weight registration (criteria: in the medical record and card of the woman).
he weight measurement criteria were classiied as: high conformity (conformity
≥ 90%), in partial and acceptable
conformity (≥ 70% and < 90%), partial and
non-acceptable conformity (≥ 50% and < 70%)
and not in conformity (< 50%), according
to the cutof points used by Dubeux et al.14.
he absolute and relative frequencies of units with scales that had records of preventive maintenance were presented, even as of the places in which the scales were located.
In the same occasion when the instrument of interview was applied with the pregnant women, which obtained self-reported values of height, pre-gestational and current weight, sociodemographic and prenatal care information, the photocopies of the prenatal cards of the women were obtained, and from there it was possible to extract anthropometric and prenatal care data.
he interviewed pregnant women were separated into two groups: of the ones who knew how to report height, pre-gestational and current weight measurements, and the ones who did not know how to report at least one of these anthropometric measurements. For the comparison between groups, means and standard deviations (SD) of age, schooling years, gestational age at the date of the interview, number of prenatal appointments and weight registers in the card were presented, as well as the relative frequency of pregnant women with height, pre-gestational and current weight registers in the prenatal card. It was tested whether pregnant women who knew how to report the three measurements showed signiicant diferences (p < 0.05) in relation to the others as to these variables, by means of the non-parametric Mann-Whitney test, for continuous variables, and Pearson’s chi-squared test, for categorical variables.
presented, as well as the diferences between the two sources of information, besides agreement limits (mean of diferences
± 1,96 SD). he agreement between the
reported and registered height, pre-gesta-tional and current measurements was also
assessed by Bland–Altmangraphs15,16.
In order to obtain a concise agreement measurement of the anthropometric data reported by the pregnant women and regis-tered in the cards, the Intraclass Coeicient
Correlation (ICC) was calculated17.
he agreement between BMI categories (low weight, eutrophy, overweight and obesity) was also analyzed, obtained through reported and registered information by means of the weighted Kappa (Kp) statis-tical calculation, with linear reduction weights. Pre-gestational nutritional status was classiied according to the criteria of BMI percentile classiication in relation to age and gender of the reference standard National Health and Nutrition Examination Survey II for adolescent pregnant women, and the BMI classiication for people aged 20 years or more of the WHO for adult pregnant
women18. he current nutritional status was
classiied based on the BMI table per
gesta-tional week by Atalah et al.19, which, despite
its acknowledge limitations20,21, is currently
recommended by the Ministry of Health1,13.
Data agreement was classiied, according
to Landis and Koch22, in: poor (< 0), mild (0 –
0.2), weak (0.21 – 0.4), moderate (0.41 – 0.60), substantial (0.61 – 0.80) and almost perfect (0.81 – 1). Analyses were performed in the R software, version 2.14.0.
he research was approved by the Research
Ethics Committees of Escola Nacional de Saúe
Pública Sergio Arouca/FIOCRUZ (Report n. 142/06) and SMS-RJ (Report n. 145 A/2007). here is no conlict of interest in relation to the methods used as part of the investigation or inancial interest of the researchers.
Results
In 71.0% (n = 22) of the 31 assessed health units, the scale was located in the weighing or screening room; in 25.8% (n = 8), in the
obstetrician or the nurse’s room; and in 3.2% (n = 1), in a place with no privacy. Among the health units, 6.4% (n = 2) had registers of preventive maintenance of the scales. In 1 unit, there were 3 professionals in charge of weight measurement; in 2 units, there were 2 professionals in charge; and in 28 units, there was 1 professional in charge, and in 3 of these only 3 observations were made (number of pregnant women weighed in the selected shift), so the inal sample was constituted of 159 observations of the weight measurement process.
As to the conformity of the weight measurement process, presented in Table 1, it is observed that block (2) was the one with best performance, with two high conformity criteria (barefoot pregnant woman; at the center of the scale) and one with partial and acceptable conformity (pregnant woman wearing light clothes). Each one of the three other blocks presented one criterion with partial and acceptable conformity.
Out of all of the criteria, three were considered with partial and unacceptable conformity, and three others with no conformity (blocked scale before weight measurement; reading and registration of the weight with the blocked scale; weight registration in the pregnant woman’s card), and two of them were necessary only when measuring weight in mechanical scales (Table 1).
he pregnant women who accepted to participate in the study and were inter-viewed (n = 2,148) were no diferent from those who refused to participate (n = 142) as to age and schooling, according to the non-parametric Mann-Whitney test, with 5% signiicance level.
Criteria % Total
Block 1 – Conditions of the scale and environment before weight measurement
Environment without low of people that can harm the execution of the process 87.8 159
Blocked scale* 40.3 132
Calibrated/zero scale 51.2 159
Block 2 – Preparation of the pregnant woman for weight measurement
Barefoot 97.3 159
With light clothes 83.6 159
At the center of the scale 94.2 159
Block 3 – Weight reading
Facing the scale 69.1 159
When the needle of the scale beam is aligned with the wheel* 80.6 132
Reading and registration of weight with blocked scale* 39.6 132
Reading and registration of weight with the pregnant woman on the scale 63.8 159
Block 4 – Place of weight registration
Medical record 85.1 159
Card 39.5 159
*Only evaluated in weight measurement in mechanical scales (n = 132). *Avaliado apenas em aferições de peso em balanças mecânicas (n = 132)
Table 1 - Weight measurement process conformity in prenatal care ofered by primary health units and hospitals of National Health System in the City of Rio de Janeiro.
Tabela 1 - Conformidade do processo de aferição do peso no pré-natal de unidades básicas de saúde e hospitais do Sistema Único de Saúde no Município do Rio de Janeiro.
Variables Total
(n = 2,148)
Reported the three anthro-pometric measurements
(n = 1,434)
Did not report at least one (n = 714)
p-value
Age in years [Mean (SD)] 24.8 (6.4) 25.0 (6.1) 24.3 (6.9) 0.001*
Schooling years [Mean (SD)] 8.4 (2.8) 9.00 (2.6) 7.3 (2.8) < 0.001*
Gestational age at the interview [Mean (SD)] 26.7 (8.7) 26.7 (8.7) 26.7 (8.7) 0.890*
Number of prenatal appointments [Mean (SD)] 4.5 (8.2) 4.7 (8.6) 4.2 (7.2) 0.004*
Number of weight register in the card [Mean (SD)] 3.7 (2.2) 3.9 (2.3) 3.5 (2.1) 0.004*
Height registers in the card (%) 30.6 37.1 17.5 < 0.001**
Pre-gestational weight in the card (%) 25.8 29.3 18.9 < 0.001**
Current weight register in the card (%) 96.6 96.7 96.4 0.885**
*Mann-Whitney test; **Pearson’s Chi-square test.
*Teste de Mann-Whitney; **Teste de qui-quadrado de Pearson.
Table 2 - Prenatal care and socio-demographic characteristics of interviewed pregnant women, who knew the three anthropometric measures (height, pre-gestational and current weight) and who did not know at least one and dife-rences tests between the two groups.
66.8% (n = 1,434) reported the three anthro-pometric measurements.
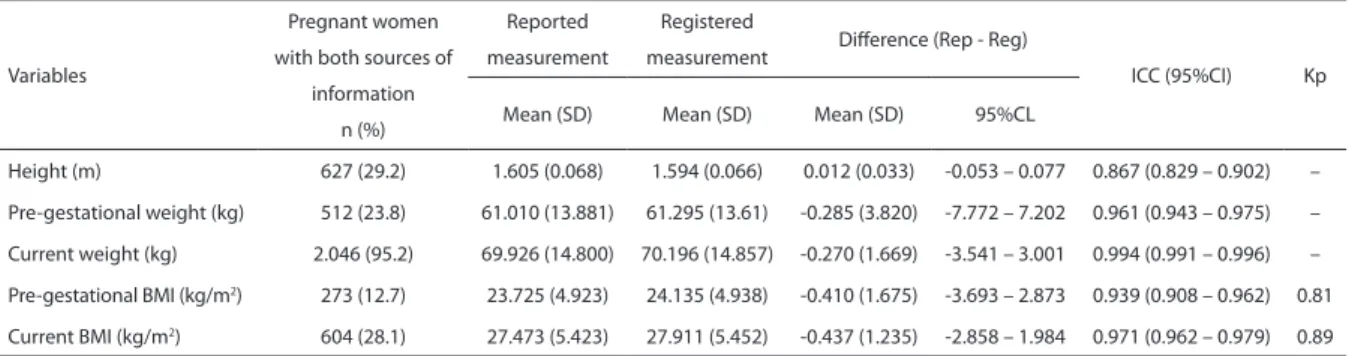
Pregnant women who did not know how to report at least one of the anthropo-metric measurements were signiicantly (5% level) younger, with lower schooling and less prenatal appointments, as well as anthropo-metric measurements in their cards (Table 2). As it can be observed in Table 3, the mean of diferences between the data reported by the pregnant women and those registered in prenatal cards was positive for height, revealing a tendency of overes-timation of reported values, and negative for pre-gestational and current weight and BMI, with tendencies to underestimate the reported values.
In the Bland–Altman graphs presented for height, current and pre-gestational measurements (Figure 1), there is agreement between the measurements reported by the pregnant women and those registered in the cards (points close to the horizontal line of diference equals zero).
However, concerning height measure ment (Figure 1A), a larger concentration of points is veriied above the line of diference equals to zero and the upper limit of agreement. he estimated regression line (dotted line) presents a slight inclination (angular coeicient = 0.03), which, due to
its magnitude, was not seen as an important proportional bias. Since the straight line is almost parallel to the x axis and is about 0.012 meters above the line of diference equals to zero, it reveals a ixed measurement bias, corroborating the tendency of overes-timating reported height, when compared to the registered one. he 95% concor-dance limits also prove this tendency (from -0.053 to 0.077 m), which include a 93.5% of the diferences. Such limits do not reveal compromising magnitude errors for the use of reported height measurement in scientiic research (Table 3).
As to current and pre-gestational weight measurements, a larger concentration of points below the line of diference equals to zero and the lower concordance limit was observed. For current weight (Figure 1B), the estimated regression line is practi-cally parallel to the x axis (angular coei-cient = -0.004), and is about 0.270 kg below the line of diference equals to zero, revealing a ixed bias, which conirms the tendency to underestimate the reported weight values. he 95% concordance limits (from -3.541 to 3.001 kg), which comprise 96.9% of the diferences, also corroborate this tendency and do not reveal compro-mising errors to the use of the current reported weight in studies (Table 3).
Variables
Pregnant women with both sources of
information n (%)
Reported measurement
Registered
measurement Diference (Rep - Reg)
ICC (95%CI) Kp
Mean (SD) Mean (SD) Mean (SD) 95%CL
Height (m) 627 (29.2) 1.605 (0.068) 1.594 (0.066) 0.012 (0.033) -0.053 – 0.077 0.867 (0.829 – 0.902) –
Pre-gestational weight (kg) 512 (23.8) 61.010 (13.881) 61.295 (13.61) -0.285 (3.820) -7.772 – 7.202 0.961 (0.943 – 0.975) –
Current weight (kg) 2.046 (95.2) 69.926 (14.800) 70.196 (14.857) -0.270 (1.669) -3.541 – 3.001 0.994 (0.991 – 0.996) –
Pre-gestational BMI (kg/m2) 273 (12.7) 23.725 (4.923) 24.135 (4.938) -0.410 (1.675) -3.693 – 2.873 0.939 (0.908 – 0.962) 0.81
Current BMI (kg/m2) 604 (28.1) 27.473 (5.423) 27.911 (5.452) -0.437 (1.235) -2.858 – 1.984 0.971 (0.962 – 0.979) 0.89
SD: standard deviation; Rep - Reg: Reported measurement - Registered measurement; CL: concordance limit; ICC: intraclass correlation coeicient; 95%CI: 95% conidence interval; Kp: Weighted Kappa.
SD: desvio padrão; Rep - Reg: medida referida - medida registrada; CL: limite de concordância; ICC: Coeiciente de Correlação Intraclasse; 95%CI: Intervalo de coniança de 95%; Kp: Kappa ponderado.
Table 3 - Number of pregnant women with reported and recorded anthropometric information and central tendency, dispersion and agreements measures of those two sources of information.
As to pre-gestational weight (Figure 1C), the estimated regression line also presents slight inclination (angular coei-cient = 0.02), being located below the line of diference equals to zero for mean weights
≤ 60 kg and above the line in the interval
> 80 kg (where 8.4% of the observations are located). Such inclination is explained by the fact that, in this last weight interval, there are less observations and the presence of two outliers (with diferences ≥ 20 kg). By excluding these two outliers (Figure 1D), the regression line is practically parallel to the x axis (angular coeicient = 0.0005) and about 0.38 kg (mean of diferences after the exclusion of the outliers) below the line of diference equals to zero, which reveals a ixed bias and conirms the tendency to underestimate the reported pre-gestational values. he 95% concordance limits (from -7,772 to 7.202 kg) corroborate this tendency to underestimate the reported pre-gesta-tional weight measurements and revealed the presence of more expressive diferences between measurements (Table 3).
Almost perfect concordances between the anthropometric measurements reported by pregnant women and those registered
in prenatal cards were revealed by the ICC values obtained for height (0.867), pre-gestational weight (0.961) and current weight (0.994), pre-gestational BMI (0.939) and current BMI (0.971) (Table 3).
As to pre-gestational BMI classiication (n = 273), considering the registers in the prenatal card as reference, it was observed that, among the pregnant women who were classiied with low weight (n = 16), 87.5% of them remained in this category based on the reported information. Such perfect concordance of pre-gestational BMI categories was observed for 93.1% of the pregnant women classiied as eutrophic (n = 160), for 74.3% of those classiied with overweight (n = 70) and 85.2% of the obese ones (n = 27). It is important to mention that, based on the reported values, 12.5% of the pregnant women with low weight, 21.4% of those with overweight and 3.7% of the obese would have been classiied as eutrophic.
With relation to current BMI (n = 604), also assuming the registers of the prenatal card as reference, the agreement between BMI categories was perfect for 93.6% of the pregnant women with low weight (n = 94),
Figure 1 - Diferences between measures of height, current and pre-gestational weight referred by pregnant women and recorded on the prenatal card, according averages of the measures.
Figura 1 - Diferenças entre medidas de estatura, peso atual e pré-gestacional referidas pelas gestantes e registradas no cartão de pré-natal, segundo médias das respectivas medidas.
Height (n = 627)
0.2 Diff er enc e bet w een r epor
ted and r
eg ist er ed 0.1 0.0 -0.1 -0.2
Mean between reported and registered
1.4 1.5 1.6 1.7 1.8
Current weight (n = 2.046)
Diff er enc e bet w een r epor
ted and r
eg ist er ed 10 0 -10 -20
Mean between reported and registered
40 60 80 100 120 140
Pre-gestational weight (n = 512)
20 Diff er enc e bet w een r epor
ted and r
eg ist er ed 10 0 -20 -30
Mean between reported and registered
40 60 80 100
-10
Pre-gestational weight (n = 510) – after removing two outliers
20 Diff er enc e bet w een r epor
ted and r
eg ist er ed 10 0 -10 -20
Mean between reported and registered
40 60 80 100
A
C
B
86.7% of the eutrophic ones (n = 233), 88.5% of those with overweight (n = 156) and 86.8% of the obese (n = 121). Based on the reported values, 6.4% of those with low weight and 9.6% of the ones with overweight would have been classiied as eutrophic.
he weighted Kappa value for pre-gesta-tional and current BMI categories was 0.81 and 0.89, respectively (Table 3).
Discussion
Weight measurement was performed in a proper room in little less than three quarters of the assessed units, and the greatest lack of adaptation was observed in the unit where the process was conducted in the corridor, with no privacy, which causes the pregnant women not to wear light clothes at the time of weighing. his fact damages the validity of the measurement. he lack of maintenance of the scales is a factor of concern, which was observed in almost of all the health units. his can result in the use of equipment with poor conservation (with diiculties to handle the calibrator, rusty points, among others), which can lead to errors and damage the accuracy and validity of measurements, besides afecting
the useful life of the equipment10,13. hese
issues were also observed in studies that assessed the weight measurement process
in children10,11.
Out of the three assessment criteria of the weight measurement process which are not in conformity in the study, two only need to be performed when the scale is mechanical. herefore, attitudes to increase this conformity include not only the periodical maintenance of the equipment and the training of the professionals in charge of weight measurement, but also the replacement of mechanical scales with electronic ones, which are easier and more
practical to be used10. Such initiatives would
increase the reliability of the measured weight values and those registered in medical records and prenatal cards, thus enabling the proper diagnosis of nutritional
disorders and the broad use of these data in
studies1,4.
Two articles published in the past ten years with the objective of assessing the measured weight of children aged between 2 and 5 years old in a platform scale, assisted in units of SUS in the city of Rio de Janeiro
(n = 87 children)10 and in cities of the State of
Alagoas (n = 134 children)11, observed even
worse conformity than the one found in this study for the following criteria: calibrating the scale (10.3 and 0%, respectively) and reading the weight when the needle of the balance beam was aligned with the wheel (37.9 and 58.4%, respectively), and the diference in the last criterion could possibly be explained by the diiculty of the child to stay still on the scale in comparison to the pregnant woman. However, they found better conformity for the criterion reading the weight facing the scale (100 and 90.3%, respectively), which may have occurred due to the closest attention and proximity that the child requires from the professional during weight measurement.
he high conformity for the criterion of placing the user in the center of the scale
at the time of weighing10 and the superior
percentage of conformity of the weight registered in the medical record when compared to the percentage found in the
card registration11 were also observed by
these authors. However, due to the high percentage of current weight registers in prenatal cards (96.6%), it is possible that, in the prenatal care routine, the responsi-bility of passing the measured weight value from the records to the cards is considered to be an activity of the health professional who performs prenatal care, and not of the one who measures the weight.
As to the interviewed pregnant women, the group that did not know how to report at least one of the anthropometric measure-ments was constituted of pregnant women who least attended prenatal care and had more social vulnerability, as described by
Oliveira et al.23, which reveals the need of this
Corroborating the indings in this study,
Engstrom et al.9, by reviewing the articles
published in English from 1970 and 2002 presenting the mean of current height and weight diferences between measured and reported data, also found reduced mean diferences between the two sources of information, with tendency to overes-timate reported height and underesoveres-timate reported weight and BMI. he authors emphasized that even though the mean diference had relatively small magnitude for adults, the SD of the diferences is big, which suggests the high level of dispersion of diferences around the mean, calling the attention for the presence of expressive errors in the reported values, which was also observed in this study for the pre-gesta-tional measurement.
he mean of diferences of the two sources of height information found in this study was very close to the ones observed by
Fonseca et al.24 among women aged 22 to 70
years old, employees of a university (0.011;
SD = 0.030), and by Oliveira et al.23, among
pregnant women who were admitted in two State hospitals located in the city of Rio de Janeiro because of labor (0.012), and these studies compared the reported and the measured height value.
For current reported and measured
weight measurements, Oliveira et al.23
found a mean diference 1.9 times higher,
and Fonseca et al.24, 4.2 times higher than
the one observed in this study. As to current BMI, the mean diference was 1.8 times
higher in the study by Fonseca et al.24. hese
discrepancies can be explained by the time passed between weight measurement and reported measurement. While in this study pregnant women were interviewed right after the prenatal appointment, in which one of the procedures is weight
measurement, in the one by Oliveira et al.23
weighing was performed in pre-partum and the interview, in the post-partum; in the
one by Fonseca et al.24, the interview with
the employees, who may not have had their weight measured recently, was conducted in a period prior to weighing.
As to the pre-gestational weight reported by pregnant women and the one
regis-tered in the card, Oliveira et al.23 found a
mean diference 9.5 times higher than the one observed in this study, possibly because they interviewed the women in the post-partum instead of during gestation, which may have increased memory bias.
At assessing the concordance between the reported and measured anthropo-metric measurements, by means of the
Bland–Altman method15,16, other authors
have observed good concordance, also with tendencies to overestimate reported
height23,24 and underestimate reported current
weight23-25. As to pre-gestational weight,
Oliveira et al.23 veriied higher tendencies
to underestimate the reported value in relation to the one registered in the card, possibly due to the aforementioned reason.
As to the concordance between reported pre-gestational data and that registered in the card, as well as reported and measured
weight, Oliveira et al.23, even though having
observed inferior ICC values in comparison to this study, also found almost perfect concor-dances. As to the concordance of reported and measured height measurements, besides being inferior to the ones in this study, it was
classiied as substantial23. Other authors also
veriied, in diferent populations (workers of both genders), by calculating the ICC, almost perfect concordances between
reported and measured height24, current
weight24,25 and current BMI25.
Among the hypotheses for the higher concordance observed in this study concerning current weight and height measurements in
comparison to the ones of Oliveira et al.23,
equipment, which did not enable the assessment of measurement validity.
he fact that the worse concordance between reported and registered anthro-pometric measurements, according to ICC, was observed for height leads to the question that, while weight measurement is recommended in all prenatal appoint-ments, the height measurement is only predicted for the irst appointment of adult pregnant women, and trimonthly
for pregnant teenagers1, which means that
this measurement is much less frequent, with registers in about one third of the prenatal cards of the interviewed pregnant women. he expressive amplitude of the concordance limit of the diferences between pre-gestational weight measure-ments calls the attention for the guideline of the Ministry of Health, which estab-lishes that the pre-gestational weight regis-tered in the card can be the reported one,
or the measured one until the 13th week of
pregnancy, so that professionals can choose to register the measured weight, especially when they suspect of the over or underesti-mation of the reported one.
he systematic tendency of women overestimating height and underestimating weight results in the underestimation of BMI. Even though reported BMI values did
not compromise about 90% of the classiica-tions of nutritional status, and even though Kappa revealed an almost perfect concor-dance between them, in cases of bordering BMI values or more extreme discordances there are classiication errors. herefore, in prenatal follow-up or in other cases in which a nutritional conduct should be chosen based on obtained BMI, weight and height measurement is indispensable.
he results presented in this study point out some needs: the capacitation of professionals in the weight measurement process; their closer look to younger pregnant women with lower schooling; the periodical maintenance of equipment and the replacement of mechanical scales with electronic ones. Besides, due to the high concordance of anthropometric measurements reported by the pregnant women and registered in prenatal cards, it is worth to mention that pre-gestational and current weight and height information reported by the pregnant women can be used in studies, at the absence of registers in the cards, when the economy of these resources is important for the development of the study. However, it is important to improve these two sources of information by improving the conformity of the anthropometric process in health units.
References
1. Brasil. Ministério da Saúde. Pré-natal e Puerpério: atenção qualiicada e humanizada – manual técnico. Brasília: Ministério da Saúde; 2006.
2. Heslehurst N, Simpson H, Ells LJ, Rankin J, Wilkinson J, Lang R, et al. The impact of maternal BMI status on pregnancy outcomes with immediate short-term obstetric resource implications: a meta-analysis. Obes Rev 2008; 9(6): 635-83.
3. Siega-Riz AM, Viswanathan M, Moos M-K, Deierlein A, Mumford S, Knaack J, et al. A systematic review of outcomes of maternal weight gain according to the Institute of Medicine recommendations: birthweight, fetal growth, and postpartum weight retention. Am J Obstet Gynecol 2009; 201(4): 339.e1-14.
4. Barros DC. SISVAN: Instrumento para o Combate aos Distúrbios Nutricionais na Atenção à Saúde – A
Antropometria. Rio de Janeiro: Centro Colaborador de Alimentação e Nutrição (CECAN) – Região Sudeste; 2005.
5. Donabedian A. he quality of care. How can it be assessed? 1988. Arch Pathol Lab Med 1997; 121(11): 1145-50.
6. Coutinho T, Teixeira MTB, Dain S, Sayd JD, Coutinho LM. Adequação do processo de assistência pré-natal entre usuárias do Sistema Único de Saúde em Juiz de Fora, MG. Rev Bras Ginecol Obstet 2003; 25(10): 717-24.
7. Niquini RP, Bittencourt SA, Lacerda EMA, Saunders C, Leal MC. Avaliação do processo da assistência nutricional no pré-natal em sete unidades de saúde da família do Município do Rio de Janeiro. Cienc Saude Colet 2012; 17(10): 2805-16.
9. Engstrom JL, Paterson SA, Doherty A, Trabulsi M, Speer KL. Accuracy of self-reported height and weight in women: an integrative review of the literature. J Midwifery Womens Health 2003; 48(5): 338-45.
10. Capelli JCS, Anjos LA, Castro IRR. Qualidade do valor da medida de massa corporal nos Centros Municipais de Saúde do Município do Rio de Janeiro, 1996. Cad Saude Publica 2002;18(1): 63-70.
11. Lima MA, Oliveira MA, Ferreira Hda S. Coniabilidade dos dados antropométricos obtidos em crianças atendidas na Rede Básica de Saúde de Alagoas. Rev Bras Epidemiol 2010; 13(1): 69-82.
12. Nucci LB, Duncan BB, Mengue SS, Branchtein L, Schmidt MI, Fleck ET. Assessment of weight gain during pregnancy in general prenatal care services in Brazil. Cad Saude Publica 2001; 17(6): 1367-74.
13. Brasil. Ministério da Saúde. Vigilância alimentar e nutricional – Sisvan: orientações básicas para a coleta, processamento, análise de dados e informação em serviços de saúde. Brasília: Ministério da Saúde; 2004.
14. Dubeux LS, de Frias PG, Vidal AS, Santos DM. Incentivo ao aleitamento materno: uma avaliação das equipes de saúde da família do município de Olinda, Pernambuco. Rev Bras Saude Matern Infant 2004; 4 (4): 399-404.
15. Bland JM, Altman DG. Statistical Methods for assessing agreement between two methods of clinical measurement. Lancet, 1986; 1(8476): 307-10.
16. Bland JM, Altman DG. Measuring agreement in method comparison studies. Stat Methods Med Res 1999; 8(2):135-60.
17. Fleiss JL. he design and analysis of clinical experiments. New York: John Wiley & Sons; 1986.
18. WHO (World Health Organization). Physical status: the use and interpretation of anthropometry: report of a WHO Expert Committee. Geneva: WHO; 1995.
19. Atalah E, Castillo C, Castro R, Aldea A. Propuesta de un nuevo estándar de evaluación nutricional en embarazadas. Rev Med Chil 1997; 125(12): 1429-36.
20. Kac G, Nucci LB, Spyrides MH, Duncan BB, Schmidt MI. Evaluation of the ability of a Latin-American gestational weight curve to predict adverse pregnancy outcomes. Int J Gynaecol Obstet 2009; 106(3): 223-6.
21. Melo MIB, de Souza AI, Figueiroa JN, Cabral-Filho JE, Benício MHA, Batista-Filho M. Estado nutricional de gestantes avaliado por três diferentes métodos de classiicação antropométrica. Rev Nutr Campinas 2011; 24(4): 585-92.
22. Landis JR, Koch GG. he measurement of observer agreement for categorical data. Biometrics, 1977; 33:159-74.
23. Oliveira AF, Gadelha AM, Leal MdoC, Szwarcwald CL. Estudo da validação das informações de peso e estatura em gestantes atendidas em maternidades municipais no Rio de Janeiro, Brasil. Cad Saude Publica 2004; 20 Sup 1: S92-S100.
24. Fonseca Mde J, Faerstein E, Chor D, Lopes CS. Validade de peso e estatura informados e índice de massa corporal: estudo pró-saúde. Rev Saude Publica 2004; 38(3): 392-8.
25. Chor D, Coutinho Eda S, Laurenti R. Reliability of self-reported weight and height among State bank employees. Rev Saude Publica 1999; 33(1): 16-23.