Relatório Final de Estágio
Mestrado Integrado em Medicina Veterinária
CONTRIBUTION OF NON-NEURONAL CELLS TO ANGIOTENSIN
II-MEDIATED CONTRACTION IN A REFINED MODEL OF RAT COLITIS
INDUCED BY 2,4,6-TRINITROBENZENE SULFONIC ACID
Tiago Rodrigues Pinto
Orientadora:
Prof. Doutora Margarida Duarte Cerqueira Martins de Araújo Coorientadora:
Prof. Doutora Manuela Sofia Rodrigues Morato
iii
Acknowledgments
Às Professoras Doutoras Margarida Araújo e Manuela Morato pela vossa disponibilidade, dedicação e ajuda durante todo o estágio. Por todas as palavras amigas e de incentivo. Sem dúvida trabalhar assim dá outro ânimo!
À Mariana e à Céu por me acompanharem todos os dias no laboratório, pela ajuda e boa disposição.
A todos os meus amigos tondelenses e da faculdade, vocês sabem quem são, agradeço por todos os momentos vividos convosco até hoje.
À Raquel por me acompanhares durante maior parte deste percurso e por todo o apoio que me deste.
Ao meu irmão, ao Rui, ao meu pai e a toda a restante família por todo o apoio, incentivo e compreensão.
Por último, à minha mãe pelo apoio inalcançável, pela dedicação e esforço a todos os níveis para concretizar este sonho. É impossível traduzir o meu agradecimento por ti em palavras!
A todos, o meu sincero obrigado!
Este estudo foi financiado pelo projeto UID/QUI/50006/2013-POCI/01/0145/FEDER/007265 (com apoio FCT/MEC e cofinanciado pela FEDER, através da parceria PT2020), GEDII (Grupo de Estudos da Doença Inflamatória Intestinal) e Pfizer.
iv
Abstract
Inflammatory Bowel Disease is a group of chronic gastrointestinal (GI) conditions for which therapeutic options are still insufficient. Although unpredictable, the TNBS-induced experimental model of colitis is widely used in preclinical testing. All components of the Renin-Angiotensin System are found in the gut. Angiotensin II (AngII) plays a role in many gut functions and in inflammation.
The aim of this study was to refine the TNBS-induced model of colitis and to study the role of non-neuronal cells in AngII-evoked colonic contraction. Male Wistar Han rats, 8-12 weeks old, were assigned to protocol 1 (30% ethanol/TNBS; tramadol; paracetamol in drinking water; metoclopramide) or 2 (21% ethanol/TNBS; paracetamol in honey-based solution; metoclopramide).
Based on a Macroscopic Score, protocol 1 coursed 7 animals with Mild, 5 with Moderate and 7 with Severe colitis, while protocol 2 resulted in 6 animals with Mild, 11 with Moderate and 2 with Severe colitis. In protocol 1, TNBS-induced animals with Mild and Moderate colitis recovered, respectively, food intake by day 4 and 6 and GI motility by day 3 and 5. In protocol 2, these animals recovered food intake by day 4 and 7, respectively, and those with Moderate colitis recovered GI motility by day 6. Rats with Severe colitis never recovered these parameters.
Blocking Interstitial Cells of Cajal (ICC) decreased AngII-evoked colonic contraction in controls and in the distal colon of TNBS-induced animals. Hindering Enteric Glial Cells (EGC) also decreased AngII-evoked colonic contraction in TNBS-induced animals, but had no effect in controls.
We conclude that protocol 2 decreases the rate of Severe colitis and confirm that the time-course of food intake and GI motility are good predictors of colitis outcome. Moreover, we uncovered that in physiological conditions, ICC, but not EGC, facilitate AngII-evoked colonic contraction, but that inflammation alters this non-neuronal regulation of AngII-evoked colonic contraction.
v
Resumo
A Doença Inflamatória Intestinal é um grupo de doenças gastrointestinais crónicas, para as quais as opções terapêuticas são insuficientes. Apesar de imprevisível, o modelo experimental de colite induzida por TNBS é amplamente usado em testes pré-clínicos. Todos os componentes do Sistema Renina-Angiotensina são encontrados no intestino. A Angiotensina II (AngII) desempenha um papel em várias funções gastrointestinais e na inflamação.
O objetivo deste estudo foi melhorar o modelo de TNBS e estudar o papel de células não-neuronais na contração provocada pela AngII. Ratazanas macho Wistar Han, com 8-12 semanas de idade, foram distribuídos no protocolo 1 (30% etanol/TNBS; tramadol; paracetamol na água; metoclopramida) e 2 (21% etanol/TNBS; paracetamol no mel; metoclopramida).
Com base num Score Macroscópico, o protocolo 1 cursou com 7 animais com colite Ligeira, 5 com Moderada e 7 com Severa, enquanto que no protocolo 2 resultaram 6 animais com colite Ligeira, 11 com Moderada e 2 com Severa. No protocolo 1, animais induzidos com TNBS com colite Ligeira e Moderada recuperaram, respetivamente, a ingestão de alimento no dia 4 e 6 e a motilidade intestinal no dia 3 e 5. No protocolo 2, estes animais recuperaram a ingestão de alimento no dia 4 e 7, respetivamente, e aqueles com colite Moderada recuperaram a motilidade intestinal no dia 6. Ratazanas com colite Severa não recuperaram estes parâmetros.
O bloqueio das Células Intersticiais de Cajal (ICC) diminuiu a contração induzida pela AngII em controlos e no colon distal dos animais induzidos com TNBS. O bloqueio das Células da Glia Entérica (EGC) também diminuiu a contração induzida pela AngII nos animais TNBS, mas não nos controlos.
Concluímos que o protocolo 2 diminui a taxa de animais com colite Severa e confirmamos que o decurso temporal da ingestão de alimento e da motilidade gastrointestinal são bons preditores da colite. Além disso, descobrimos que, em condições fisiológicas, as ICC, mas não as EGC, facilitam a contração induzida pela AngII, mas que a inflamação altera esta regulação não-neuronal da contração induzida pela AngII.
vi
Index
I. Introduction ... 1
1. Inflammatory Bowel Disease – a growing worldwide burden ... 1
a. Clinical findings ... 1
b. Etiology and pathogenesis ... 1
c. Current therapies ... 2
d. The 2,4,6-Trinitrobenzene Sulfonic Acid-induced model of colitis ... 2
2. The Enteric Nervous System ... 3
a. Role of the Interstitial Cells of Cajal ... 4
b. Role of Enteric Glial Cells ... 4
3. The Renin-Angiotensin System ... 5
a. Renin-Angiotensin System in Inflammatory Bowel Disease ... 5
II. Materials and methods ... 7
1. Animals and housing ... 7
2. Colitis induction and analgesia ... 7
3. Animal assessment and welfare evaluation ... 8
4. Macroscopic Evaluation ... 9
5. Functional study ... 10
6. Statistical analysis ... 11
7. Drugs ... 11
III. Results and Discussion ... 12
1. Macroscopic Evaluation and Colitis outcome ... 12
2. Predictors of TNBS-induced colitis severity ... 15
a. Fasting period ... 15
b. Food Intake... 16
c. Body weight ... 17
d. Fluid intake ... 18
e. Fecal pellets ... 19
f. Monitorization of clinical signs of welfare ... 21
3. Alteration in the colonic wall of control and TNBS-induced rats ... 22
4. Functional study ... 23
a. Role of the Interstitial Cells of Cajal ... 23
b. Role of the Enteric Glial Cells ... 24
IV. Conclusion ... 25
vii
List of Abbreviations
ACE Angiotensin Converting Enzyme
ACh Acetylcholine
AngII Angiotensin II
AT1R Angiotensin Receptor type 1
AT2R Angiotensin Receptor type 2
AUC Area Under Curve
CD Chron’s Disease
CNS Central Nervous System
EGC Enteric Glial Cells
ENS Enteric Nervous System
FC Fluorocitrate
GI Gastrointestinal
GW General Welfare
IBD Inflammatory Bowel Disease
ICC Interstitial Cells of Cajal
ICC-IM Intramuscular Interstitial Cells of Cajal ICC-MY Myenteric Interstitial Cells of Cajal
ICC-SMP Submucosal Plexus Interstitial Cells of Cajal
MaS Macroscopic Score
NNC 55-0396 (1S,2S)-2-(2-(N-[(3-Benzimidazol-2-yl)propyl]-Nmethylamino)ethyl)-6-fluoro-1,2,3,4-tetrahydro-1-isopropyl-2-naphtyl cyclopropane carboxylate dihydrochloride)
NO Nitric Oxide
PC Proximal Colon
PDGFRα+ cells Platelet-Derived Growth Factor Receptor α+ cells
RAS Renin-Angiotensin System
RGS Rat Grimace Scale
SMC Smooth Muscle Cells
TDC Terminal Distal Colon
TNBS 2,4,6-Trinitrobenzene Sulfonic Acid
UC Ulcerative Colitis
UDC Upstream Distal Colon
WD ratio Wet-to-Dry ratio
viii
List of Figures
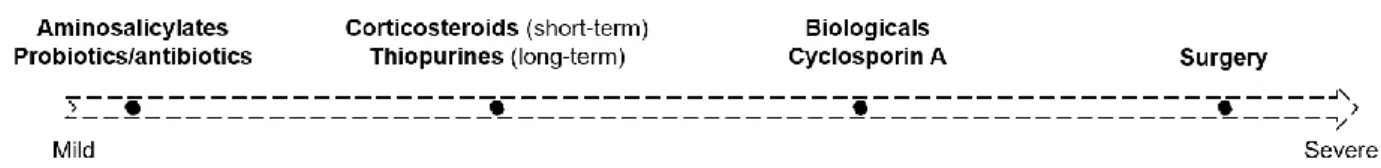
Figure 1 - Therapeutic approaches in IBD. ... 2
Figure 2 - Different portions of the colon used in the protocol. ... 9
Figure 3 - Experimental protocol used to study the reactivity of the rat colon to Angiotensin II in the absence and presence of NNC 55-0396 and Fluorocitrate. ... 10 Figure 4 – General Macroscopic Score of UDC and TDC in protocol 1 (A) and 2 (B); Mean Macroscopic score according to group, in protocol 1 (C) and 2 (D). ... 14 Figure 5 - Weight-Length ratio (g/cm) according to groups, of protocol 1 (A) and 2 (B); Colonic perimeter (mm) in protocol 1 (C) and 2 (D). ... 15 Figure 6 - Time-course of food intake (g) in protocol 1 (A) and 2 (B). Area Under Curve of food intake (g.day) in protocol 1 (C) and 2 (D). ... 16 Figure 7 - Percentage of body weight change, since day 0 (% day 0), of protocol 1 (A) and 2 (B).. ... 17 Figure 8 - Time-course of fluid intake (ml) in protocol 1 (A; water + paracetamol solution) and protocol 2 (B; only water). Area Under Curve of fluid intake (ml.day) in protocol 1 (C) and 2 (D). Time-course of Paracetamol intake (ml) (E) and respective AUC (ml.day) (F), in protocol 1. .... 18 Figure 9 - Time-course of fecal pellets weight (g) in protocol 1 (A) and 2 (C) and fecal pellets number (no.) in protocol 1 (B) and 2 (D). ... 20 Figure 10 - Time-course of Rat Grimace Scale in protocol 1 (A) and 2 (C) and General Welfare in protocol 1 (B) and 2 (D)... 21 Figure 11 - (A) Dry weight (mg) and (B) Wet-to-Dry ratio of PC, UDC and TDC. ... 22
Figure 12 - Contractile response to AngII in the PC, UDC and TDC in the absence (white columns) and presence (black columns) of NNC 55-0396 in (A) control (PC: n=8; UDC: n=8; TDC: n=6) and (B) TNBS-induced animals (PC: n=5; UDC: n=5; TDC: n=4). ... 23 Figure 13 - Contractile response to AngII in the PC, UDC and TDC in the absence (white columns) and presence (black columns) of Fluorocitrate (300 µM) in (A) control (PC: n=5; UDC: n=5; TDC: n=5) and (B) TNBS-induced animals (PC: n=4; UDC: n=6; TDC: n=7). ... 24
ix
List of Tables
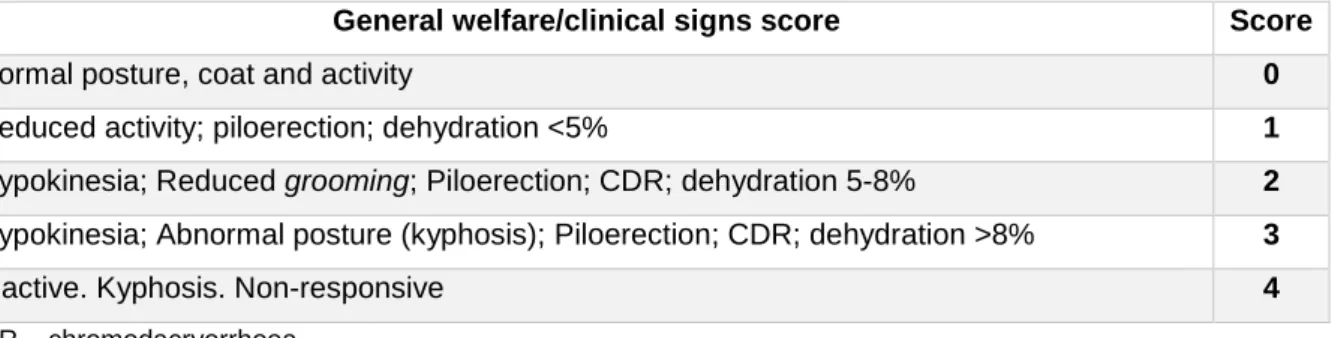
Table 1 - General welfare score sheet. ... 8
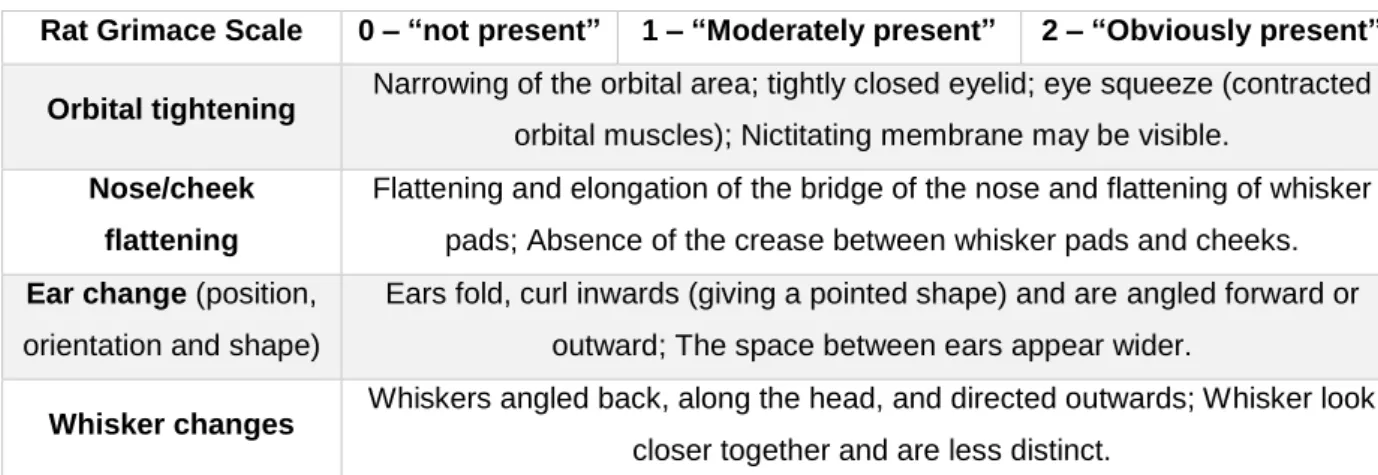
Table 2 - Rat Grimace Scale. ... 9
Table 3 - Macroscopic Scoring Parameters. ... 10
1
I. Introduction
1. Inflammatory Bowel Disease – a growing worldwide burden
Inflammatory Bowel Disease (IBD) is a group of chronic, relapsing and remitting inflammatory conditions of the gastrointestinal (GI) tract. They consist mainly of Ulcerative Colitis (UC) and Chron’s Disease (CD)1, 2 and are present in up to 0.5% of the general population in the western
world3. According to the European Federation of Chron’s & Ulcerative Colitis Associations
(EFCCA), IBD may affect as many as 5 million people worldwide4, of which over 3 million people
live in Europe5. IBD is more common in developed than developing countries, but recently, many
studies have reported increasing rates in previous low-incidence areas3, 6, 7. The estimated
European annual cost of direct health-care of IBD was 4.6 to 5.6 billion euros in a 2013 review6.
However, evidence suggests that indirect costs might exceed direct costs3.
a. Clinical findings
In UC, continuous and confluent (distal to proximal) inflammation is restricted to the rectum and colon, with erythema, erosions or ulcerations, crypt distortion, spontaneous bleeding, neutrophil infiltration, being mostly restricted to the mucosa. Traditionally, it results from a Th2-mediated
response. Differently, in CD any region of the GI tract can be affected, and there is a transmural chronic inflammation with architectural abnormalities of the crypts, and a large number of acute and chronic inflammatory cells8. Also, it is frequently associated with strictures, fistulas and
abscesses9. This disease has mainly a Th
1-mediated response. Both UC and CD have also been
shown to have a Th17 response8.
Patients with IBD generally have melena or bloody stools, tenesmus, nocturnal defecation, weight loss and abdominal pain8.
b. Etiology and pathogenesis
Etiology and pathogenesis of IBD are complex and still not fully understood. Data suggest that it involves a combined and complex interaction between genetic and environmental factors that lead to dysfunction of the gut epithelial barrier and disregulation of the mucosal immune system and tolerance to the gut microbiome1, 10. More than 200 single-nucleotide polymorphisms have
been associated with the risk of developing IBD. The importance of genetics is evident, but should be integrated with environmental factors (e.g. diet, medications, infections and lifestyle), which also directly influence the gut microbiome1, 9. Dysbiosis is observed in IBD patients, however, to
2
c. Current therapies
Since IBD is a multifactorial disease, appropriate therapy is hard to define and therapeutic outcomes are highly variable. Currently, classical approaches for IBD treatment include aminosalicylates (e.g. mesalazine), antibiotics, probiotics, corticosteroids (e.g. hydrocortisone; prednisolone), thiopurines (e.g. azathioprine; mercaptopurine), methotrexate, several biologic drugs (e.g. infliximab; vedolizumab), and surgery10. The choice of treatment and administration
route depends on the severity and extension of the disease, as shown in Figure 1
Since IBD is a chronic condition, long-term treatment is needed. Many of these drugs act as immunossupressants, which is not ideal for long-period therapy. Thus, the need for more efficient and safer therapeutic options arise. The more extensive research on molecular pathways of disease have led to new emerging therapies, generally called biologicals, such as TNF, anti-adhesion and anti-IL12/23 agents. Also, drugs commonly used for other indications are being investigated and can have an important role in IBD treatment11.
d. The 2,4,6-Trinitrobenzene Sulfonic Acid-induced model of colitis
The advance in knowledge of the pathophysiology of IBD was, in part, prompted by the development and use of several animal models of IBD. These are usually divided in 4 groups: (i) genetically engineered; (ii) immune-manipulated; (iii) spontaneous; (iv) erosive/chemical. Within the latter, the 2,4,6-trinitrobenzene sulfonic acid (TNBS) and dextran sulfate sodium (DSS) models are the most widely used in rodents, due to their simplicity, inexpensiveness and reproducibility8.
The TNBS model was first itroduced by Morris et al., in 1989, in rats. Since then, several variations and modifications of the original protocol have been described and nowadays lack standardization. The induction of colitis is accomplished through an intrarectal instillation of an ethanolic solution of TNBS13. Ethanol is used to disrupt the mucosal barrier, enabling TNBS to
translocate to the submucosal layer where it haptenizes amino groups of colonic and bacterial proteins, signalling them as targets of the host immune system8. After induction, animals present
diarrhea, rectal bleeding, body weight loss, piloerection, loss of grooming and decreased general activity. Macroscopically, it causes mucosal edema, wall thickness, distortion of crypts and
3
ulceration. The cytokine profile seen in this model is a Th1 and Th17 profile8, 13. This model mimics
many features of IBD and is widely used for preclinical testing of many treatment strategies and to study features of immunity, pathology and microbial importance in both acute and chronic CD8, 14. Despite being a relatively reproducible model, broad variations in disease outcome are
reported. It is known that animal strain, species, age, housing conditions, percentage of ethanol/TNBS dose and the technical induction protocol can be responsible for this variability. However, individual characteristics might also play an important role, since animals undergoing the same technical protocol and dosing also develop different onset and disease outcomes13.
Unfortunately, researchers recurrently fail to fully describe the protocol for induction of experimental models. Standardization of protocols and correspondent description would allow to: (i) increase reproducibility; (ii) accurately interpret results and compare different studies; (iii) indirectly reduce the number of animals used15.
In a previous protocol described by our group, we were able to categorize TNBS-induced animals by disease outcome based on a Macroscopic Score, which was then confirmed by histological evaluation. Moreover, animal categorization was able to be predicted, ante-mortem, by the time-course of food intake and fecal pellet excretion. In this previous protocol, animals were induced with a 30% ethanolic solution of TNBS (20 mg/rat) and analgesia was provided with tramadol (10 mg/kg, SC, only on day 0) and with paracetamol in drinking water along the induction protocol16.
2. The Enteric Nervous System
In order to better understand the pathophysiology of IBD, it is crucial to comprehend the physiology of the gut in health and disease, which includes a complex interaction between smooth muscle cells (SMC), epithelial cells, the enteric nervous system and the external environment. The Enteric Nervous System (ENS) plays an important role in gut motility, nutrient absorption, mucus secretion, vascular blood flow and wound healing. It is organized in two major plexuses: the myenteric or Auerbach’s plexus (between the circular and longitudinal muscular layers) and the submucosal or Meissner’s plexus (between the submucosa and the mucosa) - complex networks of enteric neurons that interact closely with glial cells and Interstitial Cells of Cajal (ICC)17, 18.
Over 30 neurotransmitters have been described, such as acetylcholine (ACh), noradrenaline, ATP and its metabolites, nitric oxide (NO) and gamma-aminobutyric acid17, 19. ACh is the major
excitatory neurotransmitter in the ENS, activating auto-receptors and directly stimulating SMC, but also regulating the release of other neurotransmitters20. ATP or related nucleotides (through
purinergic receptors) and NO are two of the major non-adrenergic non-cholinergic inhibitory neurotransmitters in the gut21, 22.
4
a. Role of the Interstitial Cells of Cajal
ICC are known to be the pacemaker cells for slow wave activity in the GI tract, which are responsible for spontaneous contractions23. These cells are in tight association with excitatory
and inhibitory motor neurons, SMC24 and platelet-derived growth factor receptor (PDGFR)α+
cells25. ICC connect with SMC and PDGFRα+ cells through gap junctions, forming the SIP
syncytium, which receives inputs from motor neurons from the myenteric plexus25. SMC were
once considered the main targets of motor neurons, but now it is known that ICC and PDGFRα+ cells are crucial for mediating GI motility25. In fact, it has been suggested that there are more
nerve-ICC-IM than nerve-SMC contacts25. In the colon, ICC are organized in three networks:
Myenteric plexus ICC (ICC-MY), Submucosal Plexus ICC (ICC-SMP)26 and Intramuscular ICC
(ICC-IM)23. In mice, ICC are mostly distributted in the proximal than in the distal colon27. A
combined interaction of Anoctamin-1 (a calcium-activated chloride channel; ANO1) and voltage-gated T-type Ca2+ channels is suggested to generate the pacemaker activity of colonic ICC, in
mice28–30. Studies have shown that ICC can mediate nitrergic23, 31 and purinergic relaxation21, as
well as cholinergic contraction25 of the GI smooth muscle. In humans, ICC-SMP are proposed to
be the pacemakers of the longitudinal and circular muscle layers and are found to have ultrasturtural changes in both CD and UC patients32. All types of colonic ICC showed morphologic
and quantitative alterations in UC patients33 . Whether this is a cause or consequence of the
disease is still not understood.
b. Role of Enteric Glial Cells
Enteric Glial Cells (EGC) are similar to astrocytes in the Central Nervous System (CNS), and outnumber enteric neurons, being in direct contact with these cells and with all the other cell types in the gut wall17. They are divided in four groups, acoording to their location: mucosal,
submucosal, myenteric ganglia and muscular18. Only recently researchers suggested the
involvement of EGC in the control of all major GI functions (structural support, neurotransmitter modulation, motility, epithelial function and integrity17), accomplished in part by being capable of
phenotypic changes under extrinsic signals (reactive gliosis)17. Direct activation of EGC is enough
to produce neurogenic reflexes, controlling motility and secretions34. Oppositely, disrupting these
cells have shown to decrease GI motility, in mice35. Neuro-glial communication in the GI system
is not as well understood as in the CNS18. However, it is known that they are equipped with
receptors for various endogenous neurotransmitters, such as ACh, ATP and serotonin18, 21. These
cells respond to injury, stress and inflammation36 and are able to produce both pro-inflammatory
and anti-inflammatory responses, depending on the type of stimuli37. Interestingly, GFAP (a
5
whereas non-inflamed areas show a decreased expression of this marker, compared to controls36.
Moreover, TNBS induced mitosis of myenteric EGC has been shown in the guinea-pig ileum38.
Therefore, it is suggested that EGCs play a major role in IBD.
3. The Renin-Angiotensin System
Classically, renin cleaves angiotensinogen, to produce Angiotensin I. This 10-aminoacid peptide is further cleaved into the 8-aminoacid peptide, Angiotensin II (AngII), by the Angiotensin Converting Enzyme (ACE). This enzyme also inactivates bradykinin. AngII is the classical final product of the Renin-Angiotensin System (RAS) and is a potent vasoconstrictor, decreases the excretion of salt and water by the kidney (promoting the secretion of aldosterone), thus incresing arterial pressure39. AngII exerts these actions, as well as hypertrophy, inflammation and fibrosis,
by activating the AngII AT1 receptor subtype (AT1R). However, activation of the AngII AT2 receptor
subtype (AT2R) usually counteracts AT1R-mediated effects. Recently, many other enzymes and
molecules related to the system have been discovered40 but are not the focus of the present work.
Although this system is mainly characterized in the cardiovascular and renal systems and associated pathologies, it is also expressed in many organs, such as brain, liver, reproductive organs, and also the GI tract40. The presence of all RAS components in the GI tract suggests that
AngII can be produced locally, influencing GI function.
a. Renin-Angiotensin System in Inflammatory Bowel Disease
All RAS components are present in the GI tract40. In the human colon, both AT
1R and AT2R have
been described in mucosal samples,41 crypt bases,40 vessel walls, myofibroblasts and
macrophages of the lamina propria42. Moreover, AT
1R have been detected in SMC of the circular
and longitudinal muscle40 and AngII have also been suggested to cause contraction by acting
directly on these cells, in vitro40, 43. A study using human and guinea pig small intestine showed
that AngII promoted an excitatory action in myenteric and submucosal plexuses exclusively by activating AT1R, which were present in 65-70% of neurons41. Other studies show that AngII plays
other physiological roles in the gut, as AT1R-mediated stress-induced gastric injury 44 and AT2
R-mediated duodenal alkaline secretion45. Activation of AT
1R by AngII also facilitates the release of
neurotransmitters, such as tachykinins and ACh in the colon46.
AngII induces pro-inflammatory effects such as increase in vascular permeability and recruitment of inflammatory cells and, as so, some researchers have started to study RAS in the context of IBD. Studies using AT1R antagonists47, 48 and ACE inhibitors49 have shown to be beneficial in
TNBS-induced colitis outcome. However, in those studies using AT1R antagonist, drug
6
due to a prophylatic or therapeutic action. Inokuchi et al., also showed that angiotensinogen gene knockout mice had a less severe colitis and impaired pro-inflammatory cytokine production after TNBS induction, compared to wild-type mice50. In previous works of our group16, AT
1R have been
shown to mediate AngII colonic contraction in both controls and TNBS-induced rats. However, contrarily to what others have reported51, AT
2R did not counteract AT1R-mediated contraction in
TNBS-induced animals, although this mechanism was operating in controls16. Our data on
mechanistic pathways also suggests a role for a prejunctional pathway mediating AngII-induced contraction along the colon of both control and TNBS-induced rats. This prejunctional pathway is inhibitory since Tetrodotoxin (TTX) markedly increased AngII-mediated contractions and NO was identified as a possible mediator of this inhibition16. Furthermore, neither purinergic nor adrenergic
pathways influenced AngII-mediated contraction (unpublished data).
In human IBD, Jaszewski et al., found that AngI and AngII levels correlated with Chron’s Disease Activity Index52. Also, IBD patients on AT
1R antagonist therapy have less expression of
proinflamamtory cytokines53. In addition, cell apoptosis and Th
17 responses are promoted by AngII
in human colitis53. Components of the alternative RAS, such as Ang(1-7) (converted from AngII
by ACE240) and ACE2 itself have also been shown to be upregulated in IBD patients42. These
data suggest that the RAS might have a role in inflammation and fibrosis in IBD42, 52
Aims
This study had two different but interlinked aims. First, we aimed to refine the TNBS-induced model of colitis in rats in order to decrease the percentage of TNBS-induced rats developing Severe colitis. Also, we wanted to confirm whether the time-course of food intake and fecal excretion are good predictors of colitis severity. Second, we aimed to further characterize the mechanistic pathways activated by AngII to cause colonic contraction, by testing the role of non-neuronal cells (ICC and EGC). In line with previous works from our research group, we studied three portions of the TNBS-induced rat colon: Proximal Colon (PC), Upstream Distal Colon (UDC) and Terminal Distal Colon (TDC) – and compared the results with the same regions of the colon of control rats.
7
II. Materials and methods
1. Animals and housing
Animals were raised and maintained in the rodent animal house facility of ICBAS-UP (approved by the national competent authority: 024159/2017-DGAV). According to the EU Directive 2010/63 and the Portuguese DL 113/2013, the project was approved by the local (179/2017-ORBEA-ICBAS-UP) and national (003511/2018-DGAV) competent authorities, the severity of the procedure was estimated as being moderate and the study was reported in accordance with the ARRIVE Guidelines. No animal was used specifically for the purpose of refining the TNBS-induced colitis model (Reduce). Since we had a functional ongoing study, we decided to refine the animal model, increasing the scientific knowledge without increasing the animal effort. Fifty-five male Wistar Han rats were raised and housed in the laboratory animal facility of ICBAS-UP. Littermates were housed in groups of 2 or 3 in Sealsafe Plus GR900 cages, with Corncob ultra 12 bedding (Ultragene) and were given access to a laboratory rodent diet (4 RF 21, Mucedola S.r.I., Italy) and to autoclaved tap water ad libitum. They were submitted to a 12-hour light/dark cycle with controlled ventilation, temperature (20-24ºC) and relative humidity (40-60%). As enrichment, polycarbonate or paper tunnels and different seeds or sugar-free cereal flakes were placed in every cage. Also, nesting paper material was provided daily. Animals were used with 8-12 weeks of age.
2. Colitis induction and analgesia
On day -1 all animals were fasted for 24 hours, in individual cages, and were given access to both autoclaved tap water and to a 5% sucrose solution to avoid the decrease in blood glucose during this period54. The purpose of this period was to empty the GI tract, facilitating the contact between
the ethanolic solution of TNBS and the colonic mucosa.
The following day (day 0) animals were randomly allocated to control or TNBS-induced groups. Those of the TNBS groups were anesthetized, ad effectum, with isoflurane (Isoflo®, Esteve).
While anesthetized, 250 µL of an ethanolic solution of TNBS (20 mg/rat) was rectally instilled using a 7.6 cm ball-tipped needle. Metoclopramide (Metoclopramida 10 mg/2mL, Labesfal) at a dose of 0.8 mg/kg, SC, was administered to both TNBS groups the next day (day 1), to enhance intestinal motility. Controls did not undergo any of these procedures.
Animals were divided in two protocols: (i) protocol 1: Controls (n=9) and TNBS-induced animals (n=19); (ii) protocol 2: Controls (n=8) and TNBS-induced animals (n=19), which differed in induction and analgesia.
8
In protocol 1, animals were induced with a 30% ethanolic solution of TNBS and forelimbs were lightly raised until anesthesia recovery. Analgesia was provided to the TNBS group with tramadol (Tramadol 100 mg/2mL, Labesfal; a weak µ-opioid receptor agonist and inhibitor of neuronal reuptake of norepinephrine and serotonin55) on day 0 (soon after TNBS induction), at a dose of
10 mg/kg, SC. Also, paracetamol (Paracetamol 40 mg/ml, Farmoz) was administered in the drinking water (2 mg of paracetamol per ml of drinking water) until the end of the experiment. Controls of this protocol weren’t given any drug.
Since the outcome of colitis was not improved with protocol 1 when compared to that of the previous protocol used by our group, a new protocol was tested (protocol 2). In this protocol, animals were induced with a 21% ethanolic solution of TNBS and were held in a vertical position for 60 seconds to spread the TNBS solution more uniformly in the distal colon, and to minimize extravasation. Analgesia was provided to the TNBS group, with paracetamol (500 mg/kg, per os), daily, in a honey-based solution (300 µL). These animals were also given the same amount of honey, without paracetamol, the day before TNBS induction. Tramadol (same dose as in protocol 1) was only given if animals presented evident signs of pain or discomfort. The control group of this protocol only received honey throughout the experiment.
3. Animal assessment and welfare evaluation
All animals were daily monitored (from 10h00 to 13h00) since day -1 to day 7 or 8. Simple and objective parameters were quantified every day: fluid and food intake, number, weight and consistency of fecal pellets and body weight. Also, to assess animal welfare, rats were scored by cage-side assessment using two simple scoring sheets: general welfare/clinical signs (GW; Table 1) and the Rat Grimace Scale (RGS; Table 2), which uses facial expressions as signs of pain/discomfort, applied in real-time. Apart from this assessment, other known indicators of pain in rats were analyzed and noted when present, such as decreased appetite, “hunch” posture (associated with abdominal pain) and other abnormal postures, porphyrin secretions and rapid shallow breathing56. These scores were attributed before handling, to avoid masking pain signs
(stress-induced analgesia).
Table 1 - General welfare score sheet.
General welfare/clinical signs score Score
Normal posture, coat and activity 0
Reduced activity; piloerection; dehydration <5% 1
Hypokinesia; Reduced grooming; Piloerection; CDR; dehydration 5-8% 2 Hypokinesia; Abnormal posture (kyphosis); Piloerection; CDR; dehydration >8% 3
Inactive. Kyphosis. Non-responsive 4
9
Table 2 - Rat Grimace Scale.
Rat Grimace Scale 0 – “not present” 1 – “Moderately present” 2 – “Obviously present” Orbital tightening Narrowing of the orbital area; tightly closed eyelid; eye squeeze (contracted
orbital muscles); Nictitating membrane may be visible. Nose/cheek
flattening
Flattening and elongation of the bridge of the nose and flattening of whisker pads; Absence of the crease between whisker pads and cheeks. Ear change (position,
orientation and shape)
Ears fold, curl inwards (giving a pointed shape) and are angled forward or outward; The space between ears appear wider.
Whisker changes Whiskers angled back, along the head, and directed outwards; Whisker look closer together and are less distinct.
adapted from NC3Rs RGS Manual57
4. Macroscopic Evaluation
On day 7 or 8 post-TNBS induction, all animals were euthanized by decapitation, in a separate room. The abdomen was opened, and the general appearance of the colon and surrounding tissues was observed to evaluate the presence of adhesions to adjacent tissues. The colon was then carefully excised, cleaned of colon content using Krebs-Henseleit solution, measured and weighed. Afterwards, four 1-cm segments of the colon (orange in Figure 2) were cut for further functional study. These segments represent the proximal colon (PC), upstream distal colon (UDC) and terminal distal colon (TDC).
As also seen in Figure 2 (in blue), two other portions also representing the UDC and TDC, were opened through the mesenteric border and given an individual Macroscopic Score (MaS), by two independent observers, according to Table 3. The animal categorization was defined as the mean of the MaS of both tissues. As previously suggested by our group, TNBS-induced rats were categorized, according to the MaS, as having Mild colitis (MaS=]0-4[), Moderate colitis (MaS=[4-8[) or Severe colitis (MaS=[8-12])16.
Figure 2 - Different portions of the colon used in the protocol. MaS – colonic portions used for Macroscopic Scoring (in blue); portions used for the functional study (in orange): TDC (terminal distal colon); UDC (upstream distal colon); PC (proximal colon).
10
Table 3 - Macroscopic Scoring Parameters.
Macroscopic Scoring Parameters
Adhesions to
adjacent organs Colon thickness
Mucosal edema/hyperemia
Mucosal ulcers
Score
0 Absent Normal Absent Absent
1 Mild / focal Mild Mild Single
2 Moderate / zonal Moderate Moderate At one site 3 Severe / diffuse Marked increase Severe At more sites
5. Functional study
In this part of the study, controls were compared to all TNBS-induced rats as a single group (not discriminating categories of colitis) in order to reduce the number of animals used for scientific purposes. However, only TNBS-induced rats that evolved to Mild or Moderate colitis were used because they mimic the majority of IBD patients and TNBS-induced animals that developed Severe colitis showed very low contractile capacity (previous works)16.
The four 1-cm long portions of the colon were individually mounted along their longitudinal axis, in 10mL organ baths with oxygenated (95% O2; 5% CO2) Krebs-Henseleit solution at 37±1ºC.
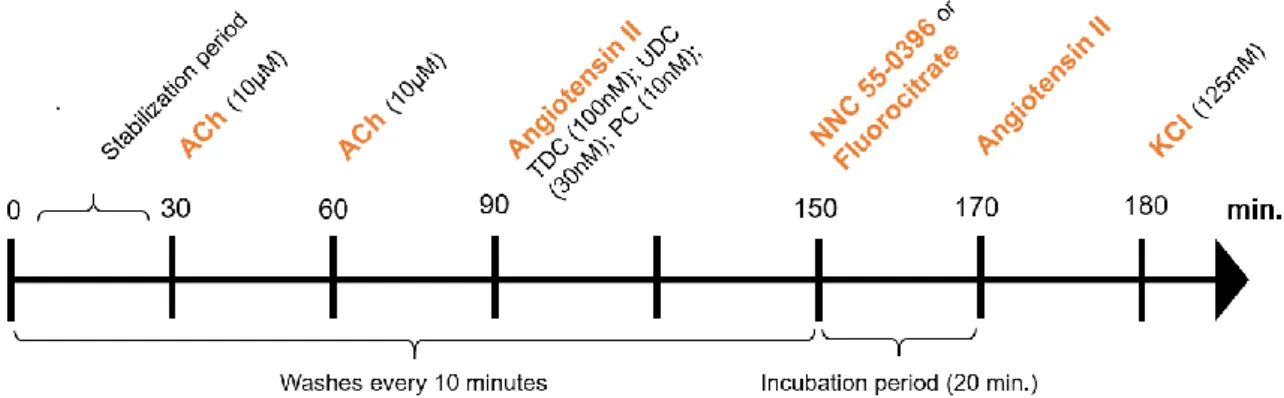
Tissues were fixed to isometrical transducers (UGO BASILE S.R.I., Italy, Model 7004) and stretched passively to an initial tension of 1 gram. The responses were recorded on a PowerLab system. The experimental protocol is shown in Figure 3
The concentration of AngII added to each portion was submaximal (previously determined16):
100nM for TDC, 30nM for UDC and 10nM for PC. After the first stimulus with AngII, the tissues were washed every 10 minutes for a 1-hour period to avoid desensitization of AngII receptors. After, NNC 55-0396 (10 µM for PC; 30 µM for UDC and TDC) or Fluorocitrate (300 µM) were incubated for 20 minutes. Afterwards, without washing, the same concentration of AngII was
Figure 3 - Experimental protocol used to study the reactivity of the rat colon to Angiotensin II in the absence and presence of NNC 55-0396 and Fluorocitrate. ACh – acetylcholine; KCl - Potassium chloride.
11
added to each portion. At the end of the functional protocol, all tissues were stimulated with sodium chloride (KCl) 125 mM to register the maximum response. Finally, tissues were weighed and left overnight at room temperature, on a filter paper, to be weighed after drying.
6. Statistical analysis
All data are presented as Mean(SD). The statistical analysis was performed by paired/unpaired Student’s t-test, one-way or 2-way ANOVA, followed by Tuckey’s multiple comparisons test, and the Chi-square test, as needed. Paired Student’s t test was used to compare the response to AngII in the absence and in the presence of an antagonist, in the same colonic sample. One-way ANOVA followed by Tuckey’s multiple comparisons was used to compare between controls and the 3 colitis categories of TNBS-induced rats within the same protocol. The two-way ANOVA was used to look for interactions between the two factors tested. The Chi-square test was used to compare the % of rats allocated to each TNBS-induced category of colitis. A p<0.05 was considered statistically significant.
7. Drugs
The Krebs-Heinselet solution (in mM): 118 NaCl; 4.8 KCl; 2.5 CaCl2 • 2H2O; 1.2 NaH2PO4 • H2O;
1.2 MgSO4 • 7H2O; 25 NaHCO3-;0.02 EDTA-Na2; 0.3 Ascorbic acid; 11 monohydrated glucose.
Drugs used in the functional study were dissolved in distiled water to desired concentration and stored at -20⁰C, except Fluorocitrate which was prepared as described by Paulsen et al58. The
vehicle of the fluorocitrate solution was also used in the functional study to see whether the solution itself could affect tissue response.
12
III. Results and Discussion
Part I: 2,4,6-Trinitrobenzene Sulfonic Acid-induced model of colitis:
time-course and comparison between 2 protocols of induction
1. Macroscopic Evaluation and Colitis outcome
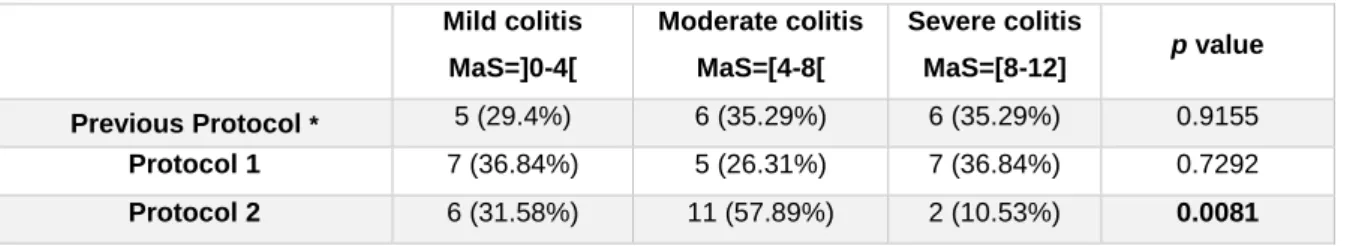
According to our previously suggested colitis categorization based on the MaS (Table 3)16, in
protocol 1, there was a uniform distribution of TNBS-induced rats across the three categories of colitis severity (Table 4). As for protocol 2, that distribution was statistically different, with more animals evolving with Mild and Moderate colitis than with Severe colitis (Table 4). These results suggest that protocol 2 represents a refinement for the TNBS-induced model of colitis.
Table 4 – Number (%) of rats in each category of TNBS-induced colitis in the 3 protocols.
* Data from Ferreira-Duarte, M.16
The first explanation for this result might be the difference in the percentage of ethanol. In this animal model, ethanol is used to disrupt the mucosal barrier and allow TNBS to translocate to the submucosal layer and cause inflammation8. Therefore, we can deduce that the reduction in the
percentage of TNBS-induced animals developing Severe colitis in protocol 2 can be due to the reduction of the % of ethanol in the instilled solution. Second, the differences in analgesia might have also contributed to this result. Paracetamol is known to be less toxic and to be effective in producing analgesia in rats, but less effective than opioids. In the previous protocol and in protocol 1, paracetamol was self-administered, which reduces stress59. However, as reported in other
studies, our animals preferred the water bottle rather than the paracetamol solution bottle59. Since
we also observed a high variability in the consumption of the latter, effective analgesia could not be guaranteed to all animals. Factors like neophobia and degree of pain can explain these variations. Regarding tramadol administration, although it has a smaller effect on GI motility when compared to other opioids55, the use of this analgesic was questioned in protocol 2, since we
stated that restoration of GI motility is related with the colitis outcome16. Therefore, in protocol 2,
paracetamol was daily administered, per os, at a dose of 500 mg/kg60 in a honey-based solution.
Although minimal stress was induced by handling and restraint for the administration of paracetamol, a correct and effective dose was able to be guaranteed to all animals. A further
Mild colitis MaS=]0-4[ Moderate colitis MaS=[4-8[ Severe colitis MaS=[8-12] p value Previous Protocol * 5 (29.4%) 6 (35.29%) 6 (35.29%) 0.9155 Protocol 1 7 (36.84%) 5 (26.31%) 7 (36.84%) 0.7292 Protocol 2 6 (31.58%) 11 (57.89%) 2 (10.53%) 0.0081
13
refinement of this protocol would be the introduction of a training period for this procedure. Tramadol, at the same dose as in protocol 1, was only given once to 5 animals, of which only one was categorized as having Severe colitis. One can hypothesize that the effective reduction of pain in protocol 2 could have helped the restoration of GI motility, therefore reducing the severity of colitis. Third, it is reasonable to suggest that honey might have played a role in these results, due to its antioxidative and anti-inflammatory properties61. Many studies using different animal models
of IBD have shown beneficial effects of honey, or its components, in the outcome of disease61–63. However, the amount of honey administered to our rats was substantially lower (1 mL/kg, daily) than those usually reported. Finally, the method of induction (raised forelimbs vs. vertical position for 60 seconds) could also have contributed to these results. On the day post-TNBS induction (day 1), animals from protocol 2 generally appeared to have less TNBS on nesting paper, suggesting that less TNBS was lost. Therefore, oppositely to what was observed, it would be expected that more animals would experience a Severe colitis in this protocol. A possible combination of the first three explanations might have contributed to this refinement.
The mortality rate in protocol 1 and 2 was 1/28 (3.6%) and 0/27 (0%), respectively. In the previous protocol it was 0/28 (0%)16. The animal of protocol 1 died on day 6; free abdominal liquid was
found in the necropsy and the animal was classified as having a Severe colitis.
The colon of TNBS-induced animals was filled with pasty stools and many times adhered to adjacent organs of the abdominal cavity, opposite to control animals for which colonic content consisted of ovoid-shaped fecal pellets and no adhesions were seen.
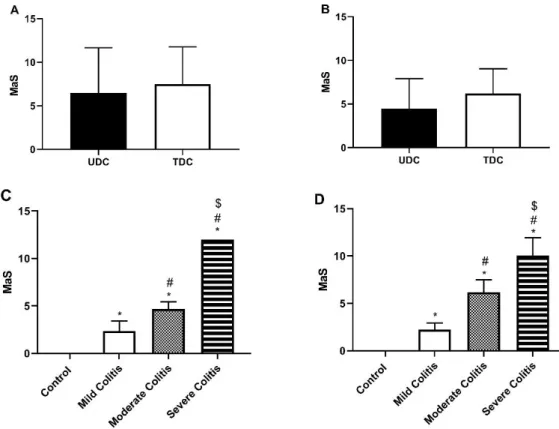
Oppositely to our results with the previous protocol16, the partial MaS of TDC and UDC was similar
between colonic regions, both in protocol 1 (Figure 4A) and in protocol 2 (Figure 4B), which indicates that these two portions were equally affected by TNBS. The method of induction might have contributed to this result. Anyway, the mean MaS progressively increased across categories of colitis severity, in protocols 1 and 2 (Figure 4C and Figure 4D, respectively). We highlight that TNBS-induced animals with Moderate colitis had generally higher scores in protocol 2 than in protocol 1.
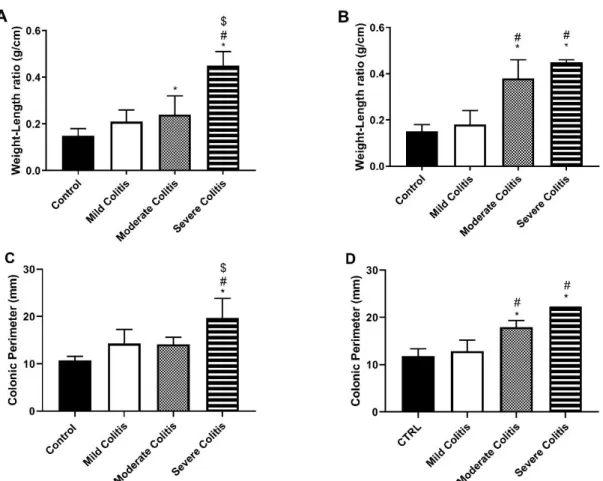
After carefully excising the colon, it was cleaned with the Krebs-Henseleit solution, measured and weighed. With these measures, we calculated the Weight-to-Length (WL) ratio for every animal, which is considered an indirect index of inflammation, since inflammation causes thickening and consequent shortening of the colon64. In protocol 1 (Figure 5A), TNBS-induced animals with
Severe colitis had higher WL ratio than the other 3 groups, and those with Moderate colitis had higher WL ratio than controls. As for protocol 2 (Figure 5B), TNBS-induced rats with Moderate and Severe colitis had higher WL ratio than both controls and animals who developed Mild colitis. Our results suggest that animals with higher severity of colitis also had a more marked underlying inflammatory reaction, which probably results in cell hypertrophy, fibrosis and edema. Also, the
14
higher WL ratio of TNBS-induced rats with Moderate colitis in protocol 2, compared to protocol 1, might be explained by the generally higher MaS of these animals, reflecting more marked inflammatory reaction.
The perimeter of the portions not used for the functional study was measured afterwards. Colonic perimeter was calculated by the mean of the perimeters of the three portions. In protocol 1 (Figure 5C), TNBS-induced animals with Severe colitis had higher colonic perimeter than the other groups. In protocol 2 (Figure 5D), TNBS-induced rats with both Moderate and Severe colitis had higher colonic perimeter than the other two. This agrees with what was observed in the necropsy of the animals, where animals with Severe colitis showed a marked distension of the colon. Once again, the higher perimeter of TNBS-induced rats with Moderate colitis in protocol 2 might be explained by the higher MaS of these animals, which indicates a higher severity of colitis. Comparison of these two parameters with the previous protocol is not possible due to different measurement method.
Figure 4 – General Macroscopic Score of UDC and TDC in protocol 1 (A) and 2 (B); Mean Macroscopic score according to group, in protocol 1 (C) and 2 (D). *p<0.05 vs. Controls; #p<0.05 vs. Mild Colitis; $p<0.05 vs. Moderate Colitis.
15
2. Predictors of TNBS-induced colitis severity
In the previous protocol, the time-course of food intake and number of fecal pellets were considered good predictors of colitis outcome. Therefore, we further investigated these two parameters, in addition with body weight change, fluid intake, Rat Grimace Scale (RGS) and General Welfare (GW) scores.
a. Fasting period
Animals were fasted in the same conditions and were only randomly assigned to the groups afterwards. As expected, no differences were found in fecal pellet weight, % of body weight loss and fluid intake between any group (data not shown).
Figure 5 - Weight-Length ratio (g/cm) according to groups, of protocol 1 (A) and 2 (B); Colonic perimeter (mm) in protocol 1 (C) and 2 (D). *p<0.05 vs. Controls; #p<0.05 vs. Mild Colitis; $p<0.05 vs. Moderate Colitis.
16
b. Food Intake
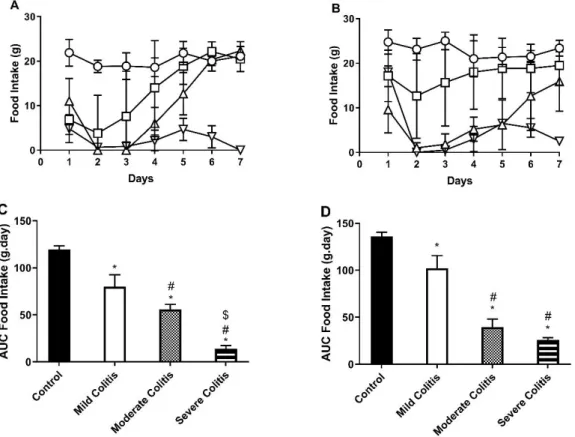
The food intake along the experimental period of both protocol 1 and 2 is depicted in Figure 6A and 6B, respectively.
The time-course of food intake showed that food intake decreased significantly in all TNBS groups of both protocols in the first 48 hours post-induction with TNBS comparing to the corresponding control group. Also, in both protocols, TNBS-induced rats with Mild colitis registered the lowest food intake on day 2, but then restarted to eat and normalized food intake by day 4, when compared to controls. For both protocols, TNBS-induced rats with Moderate and Severe colitis registered the lowest food intake on day 2 and 3. Then, TNBS-induced rats with Moderate colitis started to eat on day 4 and, those on protocol 1 normalized food intake by day 6, while those on protocol 2 almost normalized food intake by day 7. Differently, TNBS-induced rats with Severe colitis never regained normal food intake. In our previous protocol16, TNBS-induced rats with Mild
and Moderate colitis normalized food intake by day 5 and 6, respectively.
In agreement with this pattern, in protocol 1 the Area Under Curve (AUC) for food intake (Figure 6C) was progressively lower in TNBS-induced rats with Mild>Moderate>Severe colitis than in control rats. Differently, in protocol 2, the AUC for food intake (Figure 6D) of all TNBS-induced
Figure 6 - Time-course of food intake (g) in protocol 1 (A) and 2 (B); controls (circles); Mild Colitis (squares); Moderate Colitis (triangles); Severe Colitis (inverted triangles). Area Under Curve of food intake (g.day) in protocol 1 (C) and 2 (D). *p<0.05 vs. controls; #p<0.05 vs. Mild Colitis; $p<0.05 vs. Moderate Colitis.
17
rats was lower than that of controls, and that of TNBS-induced rats with Moderate and Severe colitis was also lower than that of TNBS-induced rats with Mild colitis.
c. Body weight
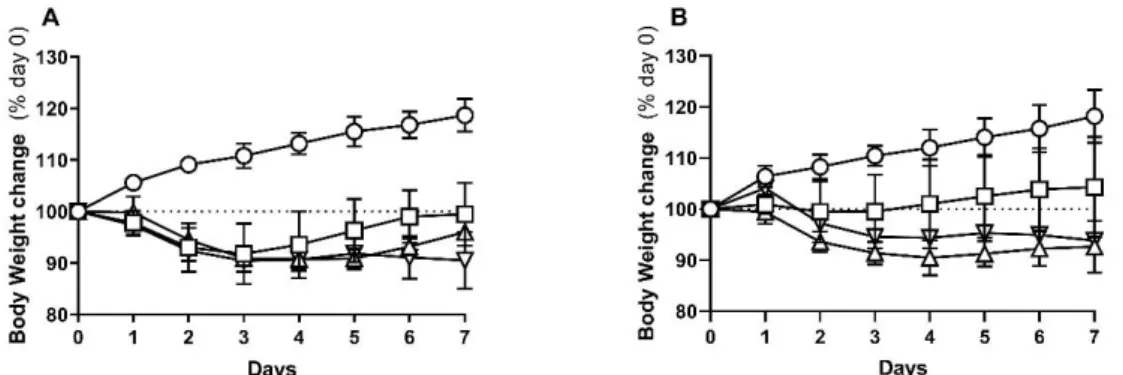
The body weight change was analyzed as a variation from that measured after the fasting period (initial weight). The time-course of body weight change for protocol 1 and 2 are presented in Figure 7A and 7B, respectively.
In protocol 1, all TNBS groups lost weight in the 72 hours post-TNBS induction. Since then, TNBS-induced rats with Mild colitis regained body weight from day 4 onwards so that, by day 7 they had regained their initial weight. As for TNBS-induced rats with Moderate colitis, they only started to regain weight by day 6 and so, did not recover their initial body weight by the end of the protocol. TNBS-induced rats with Severe colitis maintained a lower body weight along the entire protocol. In protocol 2, TNBS-induced rats with Mild colitis almost never lost weight and restarted to increase it from day 4 onwards. However, there was also no statistical difference between final and initial weight of each animal. In this protocol, TNBS-induced rats with Moderate colitis tended to have lower body weight than those with Severe colitis (as evidenced in AUC analysis of % body weight change; data not shown), and neither of these groups restarted to gain weight.
In the previous protocol, TNBS-induced animals with Mild colitis also recovered initial weight and those with Moderate and Severe colitis did not16. Furthermore, as in protocol 2, animals with
Moderate colitis tended to have higher weight loss than those with Severe colitis.
In all protocols, no differences in body weight change between TNBS-induced rats with Moderate and Severe colitis were observed in any day and were generally similar. Since those with Severe colitis did not recover food intake, it was expected that these animals would lose more weight. However, when compared to those with Moderate colitis, a marked impaction of the colon (megacolon), and a consequent higher colonic weight, is always present in necropsy of those with
Figure 7 - Percentage of body weight change, since day 0 (% day 0), of protocol 1 (A) and 2 (B); Controls (circles); Mild Colitis (squares); Moderate Colitis (triangles); Severe Colitis (inverted triangles).
18
Severe colitis. Therefore, it is hypothesized that the latter appear to not lose as much weight because the colonic weight is higher than in other groups.
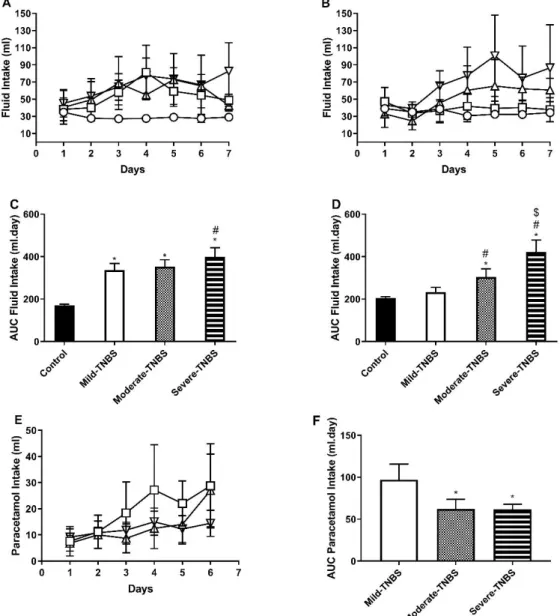
d. Fluid intake
The ingestion of fluids was also measured daily. Data and statistical analysis are presented from day 1 onwards, in order to overcome the influence of the preceding fasting period on fluid intake54.
The time-course of fluid intake along protocol 1 and 2 can be found in Figure 8A and 8B, respectively.
Figure 8 - Time-course of fluid intake (ml) in protocol 1 (A; water + paracetamol solution) and protocol 2 (B; only water). Area Under Curve of fluid intake (ml.day) in protocol 1 (C) and 2 (D). Time-course of Paracetamol intake (ml) (E) and respective AUC (ml.day) (F), in protocol 1. Controls (circles); Mild Colitis (squares); Moderate Colitis (triangles); Severe Colitis (inverted triangles). *p<0.05 vs. controls; #p<0.05 vs. Mild Colitis; $p<0.05 vs. Moderate Colitis.
19
Generally, in both protocols, TNBS-induced rats drank more than controls. One should take into consideration that in protocol 1 fluid intake corresponds to the intake of both water and paracetamol solution. TNBS-induced rats with Mild and Moderate colitis drank more fluid than controls from days 3 to 6, while TNBS-induced rats with Severe colitis drank more than controls from day 2 until the end of the protocol. So, the AUC for fluid intake (Figure 8C) was higher in all TNBS-induced groups than that of controls, and that of TNBS-induced rats with Severe colitis was also higher than that of those with Mild colitis. The time-course of paracetamol intake in TNBS-induced groups showed no statistical difference (Figure 8E), although the AUC for paracetamol intake was lower in TNBS-induced rats with Moderate and Severe colitis than that observed in TNBS-induced rats with Mild colitis. Interestingly, animals with Severe colitis drank more fluids (water and paracetamol solution), but less paracetamol solution, than those with Mild colitis, which means that not only the quantity of paracetamol intake was lower in TNBS-induced animals with Severe colitis, but also that the relative intake of paracetamol was also lower. As previously discussed, we observed high variability in the intake of the paracetamol solution, conditioning effective analgesia that could not be guaranteed to all animals. Furthermore, the degree of pain might influence the animals in surpassing neophobia.
In protocol 2, fluid intake exclusively corresponded to water intake. Since day 4 and until the end of the protocol, TNBS-induced rats with Moderate and Severe colitis drank more than controls and TNBS-induced rats with Mild colitis. This was reflected in a higher AUC for fluid intake (Figure 8D). Furthermore, the AUC for fluid intake of TNBS-induced rats with Severe colitis was even higher than that for TNBS-induced rats with Moderate colitis. In the previous protocol, we also found this trend of TNBS-induced animals to drink more than controls, especially those with Severe colitis16. The higher fluid intake in TNBS-induced animals with Severe colitis might be
explained by the development of megacolon (a necropsy finding in these animals), which can be responsible for dehydration. Those with Mild and Moderate colitis might have higher fluid intake compared to controls due to diarrhea, which is more marked in those with Moderate colitis, also explaining why the latter had higher fluid intake than the former. However, this parameter was not able to accurately predict colitis outcome.
e. Fecal pellets
We then compared both fecal pellets number and weight. Fecal pellets, especially of TNBS-induced animals, can vary in size and consistency on the same day and animal. Thus, we decided to also compare their weight.
According to weight, in protocol 1 (Figure 9A), the three categories of colitis had less fecal pellet weight on the 48 hours following induction, comparing to controls. Those with Mild colitis recovered on day 3, and fecal weight was statistically higher than that of controls on days 4 to 6.
20
Those with Moderate colitis only recovered on day 5 and surpassed the fecal weight of controls on days 6 and 7. When quantifying the number of fecal pellets (Figure 9B), we globally obtained similar results. The number of fecal pellets of the TNBS-induced animals was lower on the 48 hours post-induction. On day 3, those with Mild colitis recovered when compared to controls, but was never higher in the following days. As for those with Moderate colitis, they also recovered on day 5, when comparing to controls, but was only higher on day 6.
In protocol 2 (Figure 9C), animals with Mild colitis never had lower fecal weight than controls. Those with Moderate colitis normalized fecal pellet weight by day 6, comparing to controls. As for fecal pellets number (Figure 9D), the three TNBS colitis groups showed a decrease in the 48 hours post-induction. By day 3, TNBS-induced animals with Mild colitis regained similar excretion as controls and the same was observed in those with Moderate colitis by day 7.
In the previous protocol, TNBS-induced animals with Mild and Moderate colitis normalized fecal excretion by day 5 and 6, respectively16. In this protocol, metoclopramide was not administered
to TNBS-induced animals. Since it improves GI motility, this might explain why TNBS-induced animals with Mild colitis of both protocol 1 and 2 recovered GI motility earlier. As for those with Moderate colitis, metoclopramide might not have had any influence in restoring GI motility, since it was administered many days before regaining fecal excretion. In all protocols, TNBS-induced animals with Severe colitis tended to have very few, if any, fecal pellets.
Figure 9 - Time-course of fecal pellets weight (g) in protocol 1 (A) and 2 (C) and fecal pellets number (no.) in protocol 1 (B) and 2 (D). Controls (circles); Mild Colitis (squares); Moderate Colitis (triangles); Severe Colitis (inverted triangles).
21
The differences between the analysis of fecal pellets number and weight show that they vary in size and consistency, especially in TNBS-animals who restart intestinal motility. Despite these slight differences, the days at which TNBS-induced rats with Mild and Moderate colitis normalize fecal excretion, compared to controls, are generally the same. Although, in our opinion fecal pellet weight is more accurate, these results show that researchers can use only one of these methods to predict colitis outcome, according to preference.
f. Monitorization of clinical signs of welfare
Many studies fail to report (or to assess) pain and/or discomfort signs in laboratory animals65.
For daily evaluation of animal welfare, we used two scoring systems: The Rat Grimace Scale (real-time side cage assessment), and the General Welfare score. The scores were given before any manipulation of the animals to avoid stress-induced analgesia. The use of RGS in real-time has shown to be reliable in rat acute pain assessment66. Real-time application can generate lower
scores than the standard method of assessment (retrospective analysis of still images)66, 67,
however, the latter can also result in an artificial elevation of scores due to capture of interfering behaviors, such as blinking66.
In protocol 1, as expected, RGS (Figure 10A) and GW (Figure 10B) scores were higher than controls, after the TNBS-induction. Generally, the scores of all groups decreased over the next days. Curiously, on day 5 and 6 both scores of animals with Severe colitis increased and were
Figure 10 - Time-course of Rat Grimace Scale in protocol 1 (A) and 2 (C) and General Welfare in protocol 1 (B) and 2 (D). Controls (circles); Mild Colitis (squares); Moderate Colitis (triangles); Severe Colitis (inverted triangles).
22
statistically different from the other groups. Concerning protocol 2, RGS (Figure 10C) and GW (Figure 10D) were only able to differentiate animals with Mild colitis and animals with Severe colitis on day 7 and since day 5 , respectively. These results show that, although useful, the scoring systems used were not able to identify and predict colitis outcome. We think that further refinement or implementation of new scoring systems would be relevant to improve animal welfare and research.
Part II – Non-neuronal cells mediating the contractile effect of Angiotensin II
in the colon of control and 2,4,6-Trinitrobenzene Sulfonic Acid-induced rats
3. Alteration in the colonic wall of control and TNBS-induced rats
All 1-cm long colonic tissues (TDC, UDC, PC) were weighed after the functional study (wet) and on the next day (dry). The dry weight (Figure 11A) of all portions was higher in TNBS-induced animals than in controls. Furthermore, PC had lower dry weight than UDC and TDC in TNBS-induced animals. With both the wet and dry weight, we calculated the wet-to-dry (WD) ratio (Figure 11B), which is considered an indirect marker of edema. TNBS-induced animals had higher WD ratio than controls. Also, the UDC of both controls and TNBS-induced animals had higher WD ratio than the correspondent PC and TDC. These results evidence the presence of structure alterations and edema in the colon of TNBS-induced rats.
Figure 11 - (A) Dry weight (mg) and (B) Wet-to-Dry ratio of PC, UDC and TDC. Controls (black columns); TNBS-induced animals (white columns); *p<0.05 vs. controls of the corresponding portion. Horizontal stacked and full lines represent statistical difference (p<0.05) between selected portions of controls and TNBS-induced animals, respectively.
23
4. Functional study
a. Role of the Interstitial Cells of Cajal
T-type voltage-gated calcium (Ca2+) channels are present in the plasma membrane of ICC, and
when activated, allow influx of calcium, which is important and necessary for their pacemaker activity28–30. These channels generate low-threshold calcium spikes and influence the firing pattern of the action potentials, besides being able to regulate smooth muscle proliferation and tone68. The compound NNC 55-0396
[(1S,2S)-2-(2-(N-[(3-Benzimidazol-2-yl)propyl]-Nmethylamino)ethyl)-6-fluoro-1,2,3,4-tetrahydro-1-isopropyl-2-naphtyl cyclopropane carboxylate
dihydrochloride)] is a selective T-type Ca2+ channel inhibitor69.
In our study, NNC 55-0396 decreased AngII-induced contraction in all colonic portions tested, except for the PC of TNBS-induced animals (Figure 12), pointing to an excitatory contribution of ICC to the contractile effect of AngII in the rat colon (inflamed or not).
AngII facilitates the release of neurotransmitters70, 71 and, in the tail artery of the mouse, NNC
55-0396 reduced the facilitation of the nerve-evoked contraction caused by AngII, suggesting that T-type Ca2+ channels mediate the facilitatory action of AngII72.
In the mouse colon, ICC are mainly present in the proximal than in the distal colon and ICC-IM have been shown to be in close association with cholinergic and nitrergic motor neurons73.
Several studies have shown that these cells are lost or damaged in many motility disorders73,
being depleted in a TNBS model of ileitis in rats74. Loss of ICC has been reported in clinical studies
of patients with pseudo-obstruction, chronic constipation and megacolon73.
Taken together, our results suggest that in the uninflamed colon of the rat, ICC mediate AngII-evoked colonic contraction, possibly by the release of an excitatory neurotransmitter, as ACh. As for TNBS-induced animals, we were expecting that these cells would be damaged or depleted,
Figure 12 - Contractile response to AngII in the PC, UDC and TDC in the absence (white columns) and presence (black columns) of NNC 55-0396 in (A) control (PC: n=8; UDC: n=8; TDC: n=6) and (B) TNBS-induced animals (PC: n=5; UDC: n=5; TDC: n=4). *p<0.05 vs. AngII alone. In PC, NNC 55-0396 (10 µM); In UDC and TDC, NNC 55-55-0396 (30 µM).
24
and therefore, that no difference would be found after incubation with NNC 55-0396. However, in the UDC and TDC (generally the most damaged areas) there was also a significant decrease of AngII-evoked contraction, while in the PC no effect was observed. Still, the degree of inhibition of AngII-contraction by NNC 55-0396 was higher in controls than in TNBS-induced animals both in the UDC (60.25 ± 10.49% vs 27.20 ± 8.02%, respectively, p=0.0478) and TDC (72.17 ± 6.53% vs 45.25 ± 9.57%, respectively, p=0.0419), probably reflecting that damage or loss of ICC. Also, studies which report these alterations in ICC populations in inflammation usually study one of the subtypes of these cells (ICC-IM; ICC-MY; ICC-SMP). In our study, the whole colon wall was studied and, for now, it is impossible to precise which subtype (or subtypes) mediate this regulatory role on AngII-evoked contraction in the rat colon.
The expression of T-type Ca2+ channels in other cells should also be considered, namely in
PDGFRα+ cells. However, to date no functional T-like currents of Ca2+ have been found75.
Nonetheless, the possibility that in our study NNC 55-0396 might have also blocked T-type channels in other cells is not unreasonable.
b. Role of the Enteric Glial Cells
To our knowledge, our study is the first to explore the putative effect of EGC in AngII-evoked contraction of the rat colon. For that we used Fluorocitrate (FC), a gliotoxin known to cause dysfunction of the EGC without causing intestinal inflammation35. FC had no effect in colonic
segments from controls but decreased AngII-evoked colonic contraction in the PC and UDC of TNBS-induced animals (Figure 13). Also, the vehicle of the Fluorocitrate solution did not alter the AngII-mediated colonic contraction (data not shown).
EGC are similar to astrocytes, glial cells of the CNS. Dysfunction of these cells is related to several neurological diseases, such as epilepsy and amyotrophic lateral sclerosis76. These cells also
become reactive when stimulated. This reaction can be protective if it is well regulated, however, a dysregulated response can be harmful and contribute to several pathologies76. In astrocytes,
Figure 13 - Contractile response to AngII in the PC, UDC and TDC in the absence (white columns) and presence (black columns) of Fluorocitrate (300 µM) in (A) control (PC: n=5; UDC: n=5; TDC: n=5) and (B) TNBS-induced animals (PC: n=4; UDC: n=6; TDC: n=7). *p<0.05 vs. AngII alone.
25
AngII induces proliferation and neurotransmission, and activates many intracellular pathways, such as those related to inflammation76.
EGC actively control neuronal functions, regulating all major gut activities through bi-directional communication with neurons. They are shown to be involved in neurotransmission, either by degradation or sequestration or by production of neurotransmitters precursors17, in immune cell
modulation and respond to inflammation through proliferation and cytokine secretion. Additionally, they have been linked in the transmission of vagal anti-inflammatory signals to resident immune cells77. Also, parasympathetic vagal innervation activates anti-inflammatory pathways, whilst
sympathetic vagal innervation activates pro-inflammatory pathways in EGC37. In a TNBS model
of ileitis in rats, inflammation stimulated EGC proliferation74.
Our results suggest that AngII-evoked contraction is not mediated by EGC in uninflamed control animals. Differently, they seem to mediate AngII-evoked contraction in PC and UDC of TNBS-induced animals. This is probably a consequence of the inflammation caused by TNBS, which leads EGC to proliferate and become more reactive. Intriguingly, we observed no effect of FC in the TDC of TNBS-induced animals which was quite unexpected. It would be expected that EGC would also mediate AngII-evoked contraction in the TDC, since it is a region with marked inflammatory damage. EGC, in the inflamed colon, might mediate AngII contraction through ACh release, as previously proposed74. But, as for ICC, we are not able to know which subtype of EGC
are involved in this contraction.
IV. Conclusion
In conclusion, our study allowed to establish a protocol (protocol 2) for induction of colitis in rats using TNBS (ethanolic solution) that favors the course of Mild and Moderate colitis, being more relevant for translational research and improving animal welfare (refinement). We also confirmed that food intake and fecal pellet excretion are the best predictors of TNBS-induced colitis outcome. Anticipating the category of colitis ante mortem is useful for animal welfare, data analysis and reproducibility of protocols.
Taken together our functional results allow us to conclude that in controls, ICC, but not EGC, facilitate AngII-mediated contraction of the rat colon. Differently, in TNBS-induced animals, the facilitatory role of ICC seems to be attenuated while the EGC emerge as positive regulators of AngII-mediated contraction.