i
NOVA Information Management School
Smart Cities – Smart Mobility
Mafalda Ramos Bernardo
The impact of multimodal mobility services in the
metropolitan area of Lisbon.
Thesis presented as partial requirement for obtaining the
Master’s degree in Information Management with
specialization in Information Systems and Technologies
Management.
ii
Instituto Superior de Estatística e Gestão de Informação
Universidade Nova de Lisboa
SMART CITIES – SMART MOBILITY
by
Mafalda Bernardo
Thesis presented as partial requirement for obtaining the master’s degree in Information Management with specialization in Information Systems and Technologies Management.
Supervisors: Professor Dr. Miguel de Castro Neto,
Professora Dra. Maria Manuela Simões Aparício da Costa
iii
ABSTRACT
The urbanization phenomenon brings great challenges to the cities and smart city's initiatives, for example smart mobility solutions, are being put in place as a strategy to mitigate the effects. With this study we intend to disclosure the current situation of the metropolitan area of Lisbon regarding smart mobility and multimodal mobility systems: with the development of the present work we gathered examples of smart passenger transport and multimodal solutions, acknowledge the level to which the citizens of the metropolitan area are aware of these solutions and committed to incorporate it in their daily lives and understood how the metropolitan area of Lisbon compares to other European cities regarding smart mobility theme. The methodology adopted was the analysis of an existent European dataset related to the preferences of the European citizens on emerging technology-based passenger transport solutions and the development of a survey custom made to the citizens of the metropolitan area of Lisbon. The results demonstrated the citizens of the metropolitan area of Lisbon are highly unhappy with the available mobility systems and use mainly the private car as transport mode and the importance of multimodal mobility systems were confirmed.
KEYWORDS
Smart city, smart mobility, multimodal mobility, intermodal mobility, smart citizens, metropolitan area of Lisbon.
iv
RESUMO
O fenómeno da urbanização traz grandes desafios às cidades e as iniciativas de cidades inteligentes, das quais fazem parte as soluções mobilidade inteligente, estão a ser utilizadas como estratégias para mitigar os efeitos deste fenómeno. Com este estudo pretendemos apresentar a situaçã atual da área metropolitana de Lisboa relativamente a mobilidade inteligente e a sistemas de mobilidde multimodal: no decorrer do estudo foram reunidos vários exemplos de soluções inteligentes de transporte de passageiros, foi avaliado o nível de conhecimento dos cidadãos acerca deste tipo de soluções e a sua disponibilidade e compromisso de adopção das mesmas no seu dia-a-dia e foi ainda feita uma comparação do tema da mobilidade inteligente na área metropolitana de Lisboa face outras cidades semelhantes na Europa. A metodologia adoptada passou pela análise de um dataset Europeu relativo às preferências dos cidadãos europeus acerca de soluções inovadoras alanvacadas pelas tecnologias emergentes e pelo desenvolvimento de um questionário para os cidadãos da área metropolitana de Lisboa. Os resultados mostram que existe um descontentamento dos cidadãos da área metropolitana de Lisboa com os sistemas de mobilidade existentes e que o carro pessoal é o meio de transporte mais utilizado; os resultados suportam ainda a importância do tema da mobilidade multimodal para a área metropolitana de Lisboa.
PALAVRAS CHAVE
Cidade inteligente, mobilidade inteligente, mobilidade multimodal, mobilidade intermodal, cidadãos inteligentes, área metropolitana de Lisboa.
v
INDEX
1
Introduction ... 1
2
Literature review ... 3
2.1
Impact of Climate Change and Urbanization ... 3
2.2
Smart Cities ... 3
2.2.1
Smart Cities in Portugal ... 6
2.3
Smart Mobility ... 10
2.4
Passenger Multimodal Mobility Systems ... 11
2.4.1
Citizens Importance for Multimodal Mobility and Citizens Behavior ... 16
3
Methodology ... 18
3.1
Self-Completion Questionnaires ... 19
3.2
Empirical Support – Analysis of the “EU Travel Survey on demand for innovative
transport systems” data set ... 23
4
Results ... 25
Self-Completion Questionnaires ... 25
4.1.1
Sociodemographic analysis ... 25
4.1.2
Mobility habits and expressed needs ... 26
4.1.3
Mobility habits and expressed needs – Lisboa municipality ... 31
4.1.4
Smart City and Smart Mobility ... 32
4.1.5
Multimodal mobility systems ... 40
5
Discussion ... 44
“EU Travel Survey on Demand for Innovative Transport Systems” Data Set ... 44
5.1.1
Level of public transport service in the living area ... 44
5.1.2
Driving license and car availability ... 44
5.1.3
Most frequent trip – Duration ... 45
5.1.4
Most frequent trip – Transport modes used ... 46
5.1.5
Most frequent trip – Multimodal trips ... 48
5.1.6
Most frequent trip – Problems experienced by car users ... 48
5.1.7
Attitudes towards innovative transport and transport policy – electric vehicles
49
5.1.8
Attitudes towards innovative transport and transport policy – car sharing 49
5.1.9
Attitudes towards innovative transport and transport policy – level of concern for
the impact of traffic on the environment ... 51
6
Conclusions and Future work ... 52
vi
Appendix A ... 56
Questionnaire ... 56
Questionnaire results ... 59
vii
LIST OF FIGURES
Figure 1 - Areas of smart cities solutions in Portugal (INTELI, 2014) ...7
Figure 2 – Lisbon Profile – Source: European Smart Cities Project, Vienna University of
Technology ...8
Figure 3 – Number of passengers 2010 – 2015 seven major metropolitan area of Lisbon
operators (AML, 2013 and 2017) (left). Monthly Average Daily Traffic on the two bridges
in the Lisbon municipality (AML, 2017) (right). ...9
Figure 4 – Methodological Approach ...18
Figure 5 – Responses by municipality ...25
Figure 6 – Responses by age ...25
Figure 7 – Responses by academic qualification...26
Figure 8 – Most common transport modes used in the usual trip home – school/work ...26
Figure 9 - Most common transport modes used in the usual trip home – school/work for each
municipality ...27
Figure 10 – Average duration in minutes of the usual trip home – school/work by municipality
of residence ...28
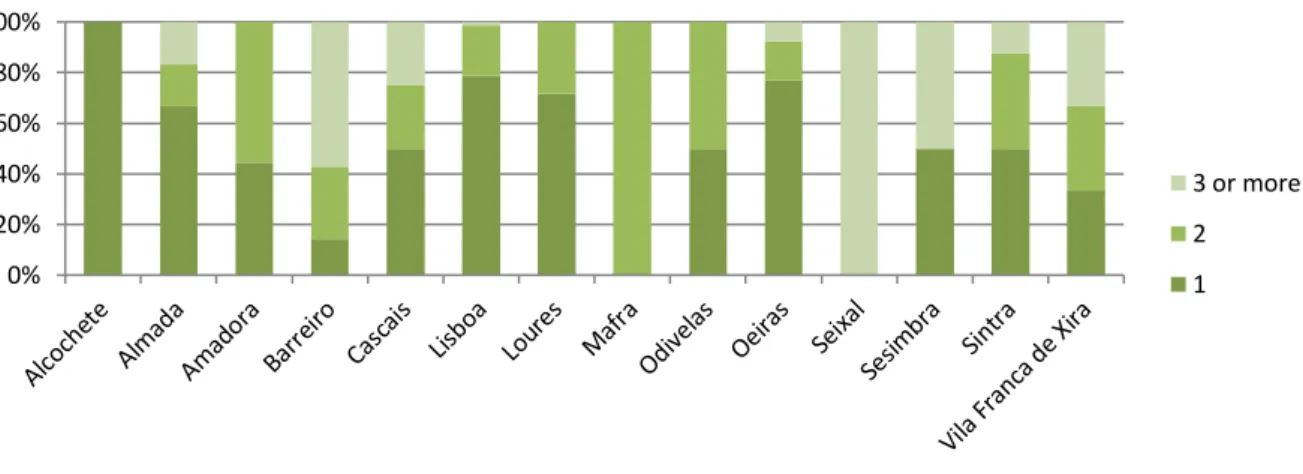
Figure 11 – Number of transport modes used in the usual trip home – school/work by
municipality of residence ...28
Figure 12 – Level of agreement to the sentence “the available mobility systems in the
metropolitan area of Lisbon cover the citizen’s needs” ...29
Figure 13 – Suggestion topics given by the respondents ...30
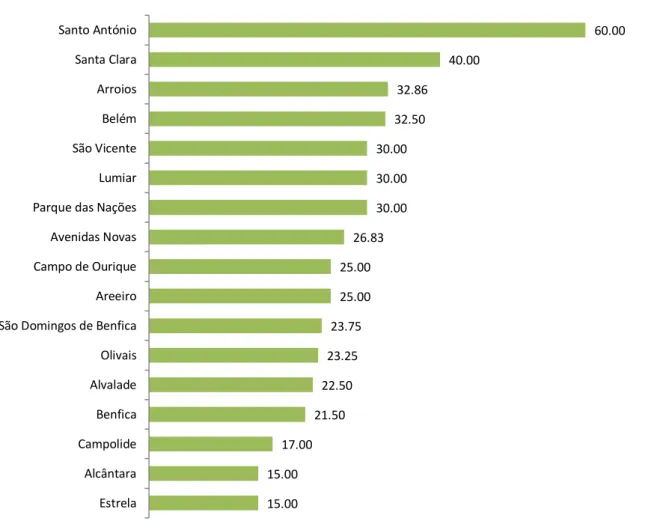
Figure 14 – Average duration in minutes of the usual trip home – school/work by parish of
residence of Lisboa municipality ...31
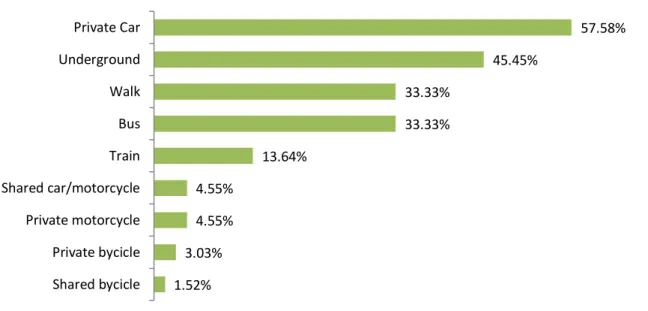
Figure 15 - Most common transport modes used in the usual trip home – school/work ...32
Figure 16 - - Knowledge level of the concept Smart City in a scale from1 to 5, where 1
represents “I don’t know” and 5 “I know well” ...32
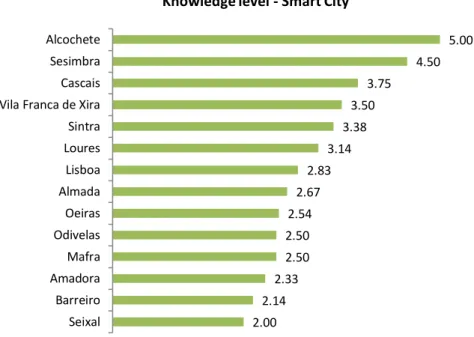
Figure 17 - Knowledge level of the concept Smart City by municipality in a scale from1 to 5,
where, 1 represents “I don’t know” and 5 “I know well” ...33
Figure 18 – Knowledge level of the Smart Mobility concept in a scale from 1 to 5, where 1
represents “I don’t know” and 5 “I know well” ...33
Figure 19 - Importance of Smart City related initiatives in a scale from 1 to 5, where 1 means
“not important” and 5 “very important” ...34
Figure 20 – Most valuable Smart Mobility solutions ...35
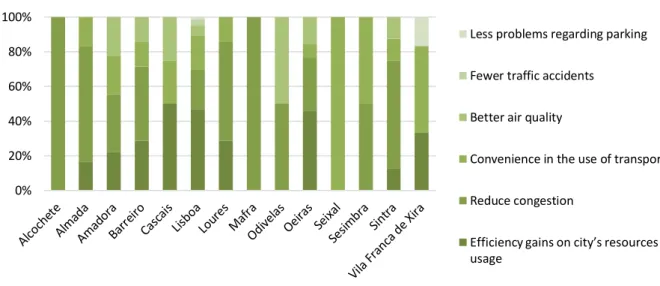
Figure 21 - Most important benefit achieved from the implementation of smart mobility
solutions ...36
viii
Figure 22 – Most important benefit achieved from smart mobility solutions by municipality
...36
Figure 23 – Adequacy of promotion of each platform by cluster ...39
Figure 24 – Most valuable multimodal mobility solutions ...41
Figure 25 – Quality of life improvement from multimodal mobility solutions adoption in a scale
from 1 to 5, where 1 represents “would not improve” and 5 “would be considerably
improved”...41
Figure 26 - Level of public transport service in the living area by city ...44
Figure 27 - Percentage of respondents with driving license and at least one available car in
household ...45
Figure 28 – Available cars in household per city ...45
Figure 29 - Average trip duration in minutes by city...46
Figure 30 – Most frequent tip average duration by city ...46
Figure 31 – Main transport mode used for the most frequent trip ...47
Figure 32 – Problems concerning the most frequent trip by city ...48
Figure 33 – Propensity to consider the purchase of an electric car by country ...49
Figure 34 – Knowledge of car sharing systems ...50
Figure 35 – Propensity to subscribe a car sharing system ...50
Figure 36 – Level of concern regarding pollution caused by cars by country, in a scale from 1
to 10, where 1 is “not concerned” and 10 “very concerned” ...51
Figure 37 – Responses by gender ...59
Figure 38 – Private car ownership ...59
Figure 39 – Private car ownership by municipality ...60
Figure 40 – Transport modes used in the usual trip home – school/work for each municipality
...62
Figure 41 – Number of transport modes used in the usual trip home – school/work by parish
of residence of Lisboa municipality ...63
Figure 42 - Level of agreement to the sentence “the available mobility systems in the
metropolitan area of Lisbon cover the citizen’s needs” for Lisboa municipality ...63
Figure 43 - Level of agreement to the sentence “the available mobility systems in the
metropolitan area of Lisbon cover the citizen’s needs” by parish of Lisboa municipality
...64
Figure 44 – Knowledge level on the Smart City concept by academic qualification ...64
Figure 45 – Importance of the related Smart City initiatives for each municipality ...67
Figure 46 - Knowledge level on the Smart Mobility concept by academic qualification ...67
ix
Figure 48 - Most valuable Smart Mobility solutions for Alcochete residents ...68
Figure 49 - Most valuable Smart Mobility solutions for Almada residents ...68
Figure 50 - Most valuable Smart Mobility solutions for Amadora residents ...68
Figure 51 - Most valuable Smart Mobility solutions for Barreiro residents ...69
Figure 52 - Most valuable Smart Mobility solutions for Cascais residents ...69
Figure 53 - Most valuable Smart Mobility solutions for Lisboa residents ...69
Figure 54 - Most valuable Smart Mobility solutions for Loures residents ...70
Figure 55 - Most valuable Smart Mobility solutions for Mafra residents ...70
Figure 56 - Most valuable Smart Mobility solutions for Odivelas residents ...70
Figure 57 - Most valuable Smart Mobility solutions for Oeiras residents ...71
Figure 58 - Most valuable Smart Mobility solutions for Seixal residents ...71
Figure 59 - Most valuable Smart Mobility solutions for Sesimbra residents ...71
Figure 60 - Most valuable Smart Mobility solutions for Sintra residents...72
Figure 61 - Most valuable Smart Mobility solutions for Vila Franca de Xira residents ...72
Figure 62 - Most valuable Multimodal Mobility solutions for Alcochete residents ...75
Figure 63 - Most valuable Multimodal Mobility solutions for Almada residents ...75
Figure 64 - Most valuable Multimodal Mobility solutions for Amadora residents ...76
Figure 65 - Most valuable Multimodal Mobility solutions for Barreiro residents ...76
Figure 66 - Most valuable Multimodal Mobility solutions for Cascais residents...77
Figure 67 - Most valuable Multimodal Mobility solutions for Lisboa residents ...77
Figure 68 - Most valuable Multimodal Mobility solutions for Loures residents ...78
Figure 69 - Most valuable Multimodal Mobility solutions for Mafra residents ...78
Figure 70 - Most valuable Multimodal Mobility solutions for Odivelas residents ...79
Figure 71 - Most valuable Multimodal Mobility solutions for Oeiras residents ...79
Figure 72 - Most valuable Multimodal Mobility solutions for Seixal residents ...80
Figure 73 - Most valuable Multimodal Mobility solutions for Sesimbra residents ...80
Figure 74 - Most valuable Multimodal Mobility solutions for Sintra residents ...81
Figure 75 - Most valuable Multimodal Mobility solutions for Vila Franca de Xira residents ...81
Figure 76 – Perception of quality of life improvement from multimodal mobility solutions
adoption for each municipality ...82
x
LIST OF TABLES
Table 1 - Smart City concept definitions...4
Table 2 - Top 10 smarter municipalities in Portugal (INTELI, 2016) ...7
Table 3 – Metropolitan area of Lisbon population 2010 – 2016 (PORDATA, 2018 and AML,
2018) ...9
Table 4 – Examples of multimodal solution - Adapted from Willing et al. (2017) ...12
Table 5 - Questionnaire created and relationship with research question, specific objectives
and literature review ...20
Table 6 – Metropolitan areas selected and indicators (OECD, 2016) ...24
Table 7 – Pearson’s correlation coefficient between the degree of agreement to the sentence
"The available mobility systems in the metropolitan area of Lisbon cover the citizen’s
needs" and the usual trip duration, the knowledge level on the smart city concept and
the knowledge level on the smart mobility concept. ...30
Table 8 – Car usage in the most frequent trip and main Smart Mobility benefit selection...37
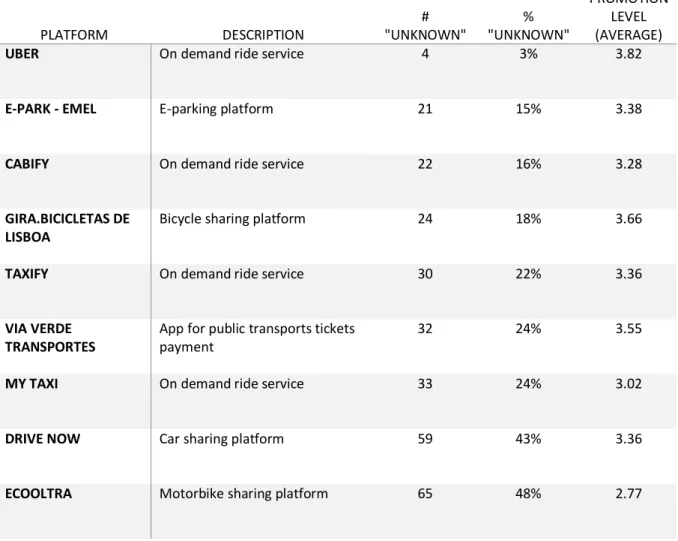
Table 9 – Perception on promotion level of smart mobility platforms, the average promotion
level refers to a scale from 1 to 5 where 1 represents “I don’t believe the promotion is
adequate” and 5 “I believe the promotion is totally adequate” ...37
Table 10 – Average of quality of life improvement from multimodal mobility solutions
adoption by municipality in a scale from 1 to 5, where 1 represents “would not improve”
and 5 “would be considerably improved” ...42
Table 11 – Average usage of green and non-green options in the most frequent trip by city 47
Table 12 – Number of transport modes used in the most frequent trip by city ...48
Table 13 – Questionnaire created and answers possibilities ...56
Table 14 – Responses of the Lisboa municipality by parish ...62
Table 15 - Average level of adequacy of public promotion of smart mobility solutions by cluster
...73
Table 16 - Personal car ownership by cluster ...73
Table 17 - Age, gender and academic qualification distribution by cluster ...74
Table 18 - Most important benefit from smart mobility initiatives implementation by cluster
...74
Table 19 - Knowledge level of Smart City and Smart Mobility concepts by cluster ...74
Table 20 – Selection of multimodal mobility solutions by cluster ...82
Table 21 - Age, gender and academic qualification distribution by cluster ...83
Table 22 – Transport modes used in the most frequent trip by cluster ...83
xi
ACRONYMS
ICTs Information and Communication Technologies IoT Internet of ThingsEEA European Environmental Agency EC European Commission
EU European Union
AML Área Metropolitana de Lisboa
PAMUS Plano de Ação de Mobilidade Urbana Sustentável da Área Metropolitana de Lisboa OECD Organisation for Economic Co-Operation and Development
1
1 I
NTRODUCTION
Today we are living in a world where it is visible a significant movement of people from the rural areas to the main urban centers, this phenomenon is called urbanization and is a major contributor for carbon dioxide emissions into our atmosphere. The adoption of Smart City initiatives in the cities is considered to be a solution to help moderate the impact of the urbanization through the creation of solutions that allow and effective and efficient usage of city’s resources. The Smart City concept has several definitions and scope, we can relate smart initiatives to most core components of a city: transport and mobility, education, healthcare, public administration, security, infrastructure, among others. The mobility topic is recurrent in Portugal, the transport systems available are often discussed in the media and are also one of the subjects frequently discussed by the Portuguese government. Related to the smart mobility theme, Di Martino & Rossi (2016) consider the existence of a gap regarding efficient mobility door-to-door solutions, where the citizen can move from a starting point to their destination using more than one transport service. The authors presented an architecture for a multimodal recommender system, which incorporates several mobility services and even suitable parking options on the routing suggestions. This gap also exists in the metropolitan area of Lisbon since the existing transport systems are not highly flexible and do not yet offer efficient mobility solutions across the area.
Although there are several studies on the smart mobility concept, it is still relevant to understand how these solutions are understood and adopted in Lisbon. For this study, I will assess the smart mobility strategy in Lisbon metropolitan area, with emphasis on how mobility services are moving towards a multimodal offer.
The objective of the present study is to answer the below research questions:
Research Question 1: What is the current situation of the Lisbon metropolitan area regarding smart mobility services, in particular, concerning multimodal mobility services?
Research Question 2: From the perspective of the metropolitan area of Lisbon citizens, how can multimodal mobility services development positively impact their quality of live?
In order to get insights and support the answers to the study’s main research questions, the following specific objectives were established:
1. Gather some examples of initiatives regarding smart passenger transport, with focus on multimodal smart mobility solutions.
2. Acknowledge the metropolitan area of Lisbon citizens’ level of awareness, commitment and information on taking advantage and incorporate multimodal smart mobility solutions in their daily lives.
3. Compare the metropolitan area of Lisbon to other European cities, regarding smart mobility initiatives.
2 To formulate the research questions and get the theoretical support for the study a literature review was conducted on the topics: impact of climate change and urbanization; Smart City concept and smart cities in Portugal; Smart Mobility; passenger multimodal mobility systems; and the importance of citizens and their behavior for multimodal mobility. In order to achieve the specific objectives and to answer the research questions the methodology adopted was to gather information from two relevant sources: European Union and directly from the citizens of the metropolitan area of Lisbon. The EU data set “EU Travel Survey on demand for innovative transport systems” was used to assess the similarities and main differences regarding passenger transport and commitment level to the smart mobility topic of the citizens of the metropolitan area of Lisbon and similar cities in Europe. The strategy set to select cities similar to the metropolitan area of Lisbon was the comparison of European indicators on metropolitan areas and the cities carefully chosen were Amsterdam, Brussels, Copenhagen and Budapest. A questionnaire was developed specifically for the current study and was applied to the metropolitan area of Lisbon citizens and intended to understand the real needs of the population and the awareness on the study topic.
The results demonstrated a high dependency on the use of personal car for the usual trips in the metropolitan area of Lisbon, not only this main of transport is the most common but also its use is higher than in the other European cities observed. Nevertheless, in comparison, the citizens of the Lisbon metropolitan are concerned with the environmental impact of the car use and demonstrate to have a positive attitude towards electric vehicles. The residents of the metropolitan area of Lisbon demonstrated not to know well the concepts of Smart City and Smart Mobility and when asked to choose the most important Smart City related initiative they selected “Transports and Mobility” which is line with the fact the majority don’t believe the available mobility systems cover the citizens’ needs It was also visible a huge lack of knowledge of the available smart mobility solutions in the metropolitan area of Lisbon, excluding the on demand car services. The results also show the importance of the multimodal mobility topic, more than half of the survey respondents agree their quality of life would improve with the adoption of these solutions and it was detected a great need of train and bus development in the metropolitan area of Lisbon. With this study, we intend to contribute for the research on multimodal mobility services in the metropolitan area of Lisbon and create awareness on the impact the evolution towards an integrated mobility system can have on citizens’ lives.
In the next section of the present study the literature review conducted on the topics impact of climate change and urbanization, smart cities and smart cities in Portugal, smart mobility, passenger multimodal mobility systems and the citizens importance for multimodal mobility and citizens behavior is presented. In section three we introduce the methodology adopted to analyze the European dataset and the data collected through the survey. In the fourth section the results of the survey data is presented and in the fifth section the discussion of the European dataset is made. The sixth and last section of the work corresponds to the conclusions and future work topics.
3
2 L
ITERATURE REVIEW
2.1 IMPACT OF CLIMATE CHANGE AND URBANIZATION
Population growth rate is decreasing when compared to ten years ago, nevertheless it is expected to reach between 8.4 and 8.7 billion population in 2030, between 9.4 and 10.2 billion in 2050 and between 9.6 and 13.2 billion in 2100 (United Nations, 2017). The United Nations also projects there will be probably an increase in European countries’ fertility rate, but that will not be enough to stop the projected contraction of Europe’s total population size. The authors Melorose, Perroy and Careas (2015) predict that the volume of internal and external migrations within countries will remain in high level, contributing to accelerate the diffusion of new ideas and technologies.
At the same time population is increasing there has been also a phenomenon of movement of people from rural areas to cities (Khatoun & Zeadally, 2016; Šiurytė & Davidavičienė, 2016). The urbanization trend is projected to be translated into 68% per cent of people living in cities by 2050, while today already 55% of the world’s population is living in urban centers (United Nations, 2018). Wang and Wang (2017) identified urbanization as one of the major contributors to carbon dioxide (CO2) emissions and successfully proven the correlation between the air temperature increasing and the population size.
According to Chapman (2007) the CO2 emissions is growing in the transport industrial sector and is accountable for 26 per cent of global emissions. The author considers relevant to assess new technologies as alternatives for petroleum dependence and to change policies towards the adoption of sustainable transport.
The European Commission and the European Environmental Agency (EEA) recognize that climate change and its adaption affects European Union (EU) policy making (EEA, 2014). Therefore it was adopted in 2013 the EU strategy on adaptation to climate change (European Commission, 2013a). One of the major three objectives of the strategy is to promote adaptation in key vulnerable sectors, such as transport, by integrating its consideration in EU policies, programs and funds (EEA, 2014).
The strategy to mitigate the impact of climate change and urbanization by the European Communities is integrated into the “Smart Cities and Communities European Innovation Partnership” which has a major objective to boost the smart city market through coordination of the smart city research and innovation projects (INTELI, 2014). The funding of countries smart city’s initiatives is under the Horizon 2020, an European Commission program that focus on the overall policy priorities for the EU (European Commission, 2013b).
2.2 SMART CITIES
The concept of smart city has a broad notion and has evolved over time, different authors have claimed diverse definitions and pointed out a variety of key variables for a city to become smart. The concept first arose in literature in 1990s associated to how technology and innovation are triggers to urban development, economic growth and globalization (Gibson, Kozmetsky & Smilor, 1992), and in 1997 appears related to local ICT initiatives in a community (Graham & Aurigi, 1997). Chourabi et al. (2012),
4 who created an integrative framework for understanding smart cities, defined smart city has a “an icon
of a sustainable and livable city” (Chourabi et al., 2012, p.2289) and consider “ICTs are key drivers of smart city initiatives” (Chourabi et al., 2012, p.2291), Meijer and Bolívar (2016) considered a smart city
has the one able to attract human capital and to mobilize it into collaboration through the use of ICT, enforcing the importance of the ICT factor. Khatoun and Zeadally (2016) did not use the ICT concept when defining smart city but relate to the modern aspect of an urban center, an ultra-modern one, in which the needs of the citizens, and respective businesses and institutions, play a major role in urban planning. De Castro Neto, Rego, Neves and Cartaxo (2017) studied the open data policies in Portugal and appointed the importance of open data for smart cities, considering it is vital to improve “transparency, citizens’ engagement, and economic development and innovation” (de Castro Neto et al., 2017, p.1). The definitions presented show the importance of the ICT component, the topic is present in literature regularly not only regarding the definition of the smart city concept and scope but also concerning core elements or key factors for a smart city. With the changes and challenges that the new technologies bring to the development of a city, the authors Cartaxo, de Castro Neto and Vassalo (2017) questioned how the governance systems will guarantee the continuous protection of the citizens and concluded “legal systems and governance models of urban areas must be always
prepared to grow, to evolve and to adapt to changes and uncertainty” (Cartaxo et al., 2017, p.169).
The other subject that also appears systematically is the importance of people or smart citizens. Caragliu, del Bo, and Nijkamp (2011) pointed out the importance of citizens by demonstrating the positive correlation between a city’s wealth and four factors: the community’s creativity in the usage of ICTs, the dedication to the urban environment, the citizen’s level of education, and the accessibility of ICTs to public administration and Šiurytė & Davidavičienė (2016), who performed an analysis on key factors in developing a smart city also referred the social matter when concluding the three core elements for one smart city: the smart citizens along with the ICTs and the present interconnectivity between them. Other authors appoint multiple components of a smart city: Giffinger (2007) appointed indicators for ranking European medium-sized cities and determined the smartness level of a city, the “smartness footprint”, can be evaluated through capacity indexes of the variables: people, economy, living, environment, mobility and governance; Khatoun and Zeadally (2016) refer five essential elements: broadband infrastructure, e-services, open government data, sustainable infrastructures and e-governance; and Anthopoulos, Janssen, and Weerakkody (2016) completed a comparative analysis on conceptual models regarding smart cities and determined eight components for the smart cities ecosystem: infrastructure, mobility, environment, services, governance, people, living and economy. Šiurytė and Davidavičienė (2016) considered smart city has a phenomenon, which includes several sectors present in a city (transport, education and healthcare, public administration, security and infrastructure) and associate the smartness to an urban center when the efforts made by the actors present on these sectors are putting in place a strategy to enforce a sharing economy over a buying economy.
Table 1 - Smart City concept definitions
SMART CITY AUTHORS
Technology and innovation are triggers to urban development, economic growth and globalization
Gibson et al., 1992
5
SMART CITY AUTHORS
Metropolitan environment based on ICT Chourabi et al., 2012 A city’s wealth is correlated to the community’s creativity in the
usage of ICTs, the dedication to the urban environment, the citizen’s level of education, and the accessibility of ICTs to public administration
Caragliu et al., 2011
City able to attract human capital and to mobilize it into collaboration using ICT
Meijer and Bolívar, 2016
Ultra-modern urban center, in which the needs of the citizens, businesses and institutions play a major role in urban planning
Khatoun and Zeadally, 2016
An urban center is smart when the efforts made by the actors present on these sectors are putting in place a strategy to enforce a sharing economy over a buying economy.
Šiurytė and Davidavičienė, 2016
The three core elements of a smart city are the smart citizens along with the ICTs and the present interconnectivity between them.
Šiurytė and Davidavičienė, 2016
The smartness level of a city is defined by people, economy, living, environment, mobility and governance.
Giffinger, 2007
The five essential elements of a smart city are broadband infrastructure, e-services, open government data, sustainable infrastructures and e-governance.
Khatoun and Zeadally, 2016
The eight components for the smart city ecosystem are infrastructure, mobility, environment, services, governance, people, living and economy.
Anthopoulos et al., 2016
Smart city is a phenomenon, which includes several sectors present in a city: transport, education and healthcare, public administration, security and infrastructure.
Šiurytė and Davidavičienė, 2016
The European Smart Cities project, a tool developed by Vienna University of Technology to benchmark medium-sized and larger European cities, agrees the interests behind the indicators may lead to different rankings for the same city, even though, the benefits arising from benchmarking tools are pertinent (Khatoun & Zeadally, 2016). In Europe, there are several examples of cities taking decarbonization measures and creating systems for clean or "green" mobility. Norway is a global pioneer in this area, it pretends to ban gas and diesel cars by 2025 in the entire country and there is a plan to ban all cars from Oslo city center by 2019, through an investment in city's public transportation and bike lanes. The German city of Hamburg will limit until 2035 some areas of the city to only bikes and pedestrians. Paris, in France, pretends to limit some streets to only electric cars by 2020 and London, in England, states that diesel cars will be over in the British city by then. Berlin city in Germany and Copenhagen in Denmark announced the construction of highways for bikes, in the city center for Berlin case, and extended to the suburban areas of Copenhagen. It is visible that most of the initiatives
6 are related to bike transportation and also to making walking a suitable mode of transport, however, Lisbon's geography does not allow a full endorsement and application of these transportation modes. Debnath, Chin, Haque, and Yuen (2014), who developed a framework for smart transport systems’ comparison across cities, affirm that, through benchmark, cities can learn from each other. The authors agree that by assessing their growth potential, cities can take initiatives for raising competitiveness and ranking can motivate authorities to increase public’s attention to problems and rise decision’s transparency. Even though there is no standardization of indicators to compare cities, the scientific community now faces a discussion regarding the legitimacy and validity of a common benchmarking framework (Moreno Pires, Fidélis, & Ramos, 2014).
2.2.1 Smart Cities in Portugal
In line with the strategy established by the European Commission to adaptation to climate change, INTELI, a private non-profit association with activities related to sustainable, inclusive and smart development of territories, launched in Portugal the Smart Cities Portugal platform in 2014, which foments smart cities market players’ cooperation. The platform aggregates companies, clusters, universities, research and development centers, municipalities and other economic and social players and intends to create synergies that foment a creative urban problem solving and generates solutions that can be accessible to the municipalities (INTELI, 2014). One of the platforms intervention fields is Mobility, with focus on intelligent transport systems, alternative energy sources for mobility, intelligent parking solutions, location management, car-sharing and bike-sharing services and traffic management. The program also addresses the following cities’ fields: Governance - e-government, open data, data visualization and mapping, geographical information systems, among others.; Energy - distributed and renewable energies, urban energy production and storage, smart grids, efficient public lighting, and others; Environment - water management, waste management, urban green spaces, monitoring of environmental indicators, besides others; Buildings - green infrastructures management, green buildings, smart spaces, advanced materials, and others; Quality of Life - public security and emergency solutions, tourism applications, e-health, e-learning, among others.
To gather knowledge on the smart city topic in Portugal, INTELI (2014) studied the reality of the market through a survey on start-ups, companies, universities, Research & Development (R&D) centers, and technological infrastructures who act on the market or have the potential to. One of the topics addressed was the market barriers found in Portugal, the following issues were the most common responses:
• Lack of clarity, information and knowledge regarding smart city concept and market and absence of projects proving the smart city solutions benefits;
• Not enough support of local authorities who are resistant to change, who demonstrate lack of coherent policies and do not facilitate through legislation and regulation;
• Smart city market characteristics, with a high diversity of players but with no inter-firm and cooperation processes, and with a visible domination of global companies;
• Weak culture of urban planning and cities management; • Economic crisis.
7
Figure 1 - Areas of smart cities solutions in Portugal (INTELI, 2014)
In Figure 1 are presented the survey results regarding areas of intervention of the Portuguese companies, which revealed that the major initiatives found are related to Governance, followed by Mobility and Energy. With less expression than on the Energy sector, are found initiatives associated to Buildings, Environment and Quality of Life.
In 2016, INTELI publish a new edition of the Smart City Index, with more Smart City’s dimensions analyzed for 36 Portuguese municipalities: Governance, Inovation, Sustentability, Quality of Life, Connectivity. The ranking of the ten smarter municipalities in Portugal is presented in Table 2 below. The conclusions of the study revealed 22% of the inquired cities have strategies in Smart City topic. The main findings in Mobility theme discovered that 25% of the cities have real time information systems regarding public transport; in the Energy and Environment topic the data showed 50% of the cities have smart monitoring systems of the water supply network or sanitation services; regarding Smart Living the results showed 70% of the cities have online services; 78% of the cities has available platforms to boost entrepreneurship and creativity for new businesses.
Table 2 - Top 10 smarter municipalities in Portugal (INTELI, 2016)
RANKING MUNICIPALITY 1 Porto 2 Águeda 3 Cascais 4 Bragança 5 Guimarães 6 Matosinhos 7 Braga 8 Sintra 9 Aveiro 10 Santarém 24% 19% 15% 13% 13% 11% 4% Governance Mobility Energy Buildings Environment Quality of Life Other
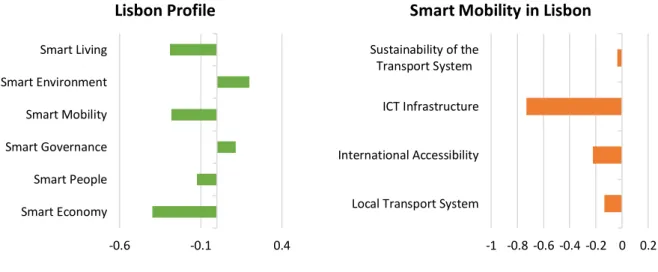
8 The European Smart Cities project (http://smart-cities.eu/) created an online platform which offers a “smart” profile on several medium-sized European cities and a benchmark tool for cities’ comparisons. The topics considered on this project to assess the level of smartness of a city are the key industry sectors (Zanella, Bui, Castellani, Vangelista, & Zorzi, 2014): Smart Economy, Smart People, Smart Governance, Smart Mobility, Smart Environment and Smart Living, each being given a value from -2 to 2 for a specific city, where –2 means the city is not smart at all in the topic and 2 means the city has accomplish the smartness level on the initiative.
Figure 2 – Lisbon Profile – Source: European Smart Cities Project, Vienna University of Technology
Regarding Lisbon ranking, the Smart Mobility component has a value of -0,281 (Figure 2) and results from an average of Local Transport System, International Accessibility, ICT- Infrastructure (the lowest value) and Sustainability of the Transport System indicators. This result is an indicator of Portuguese positioning on smart mobility matters. Several authors have considered the importance of the ICT infrastructure for a smart city and smart mobility systems and the data shows that this infrastructure is still not in shape in Lisbon case.
The Lisbon metropolitan area comprises eighteen municipalities (Alcochete, Almada, Amadora, Barreiro, Cascais, Lisboa, Loures, Mafra, Moita, Montijo, Odivelas, Oeiras, Palmela, Seixal, Sesimbra, Setúbal, Sintra and Vila Franca de Xira), home of about three million people, more than one quarter of the Portuguese population. The area is economically relevant since it contributes with more than 36% of the national GDP, concentrates around 25% of the Portuguese active population, 33% of Portuguese jobs and 30% of the national companies (Área Metropolitana de Lisboa, 2017). The Área Metropolitana de Lisboa (AML) is, since 2015, the competent authority for public intermunicipal passenger transports’ services. Therefore, the organ is responsible for the mobility system’s strategic objectives definition, system planning, operation organization, supervision, financing and promotion of the services available. -0.6 -0.1 0.4 Smart Economy Smart People Smart Governance Smart Mobility Smart Environment Smart Living
Lisbon Profile
-1 -0.8 -0.6 -0.4 -0.2 0 0.2 Local Transport SystemInternational Accessibility ICT Infrastructure Sustainability of the Transport System
9
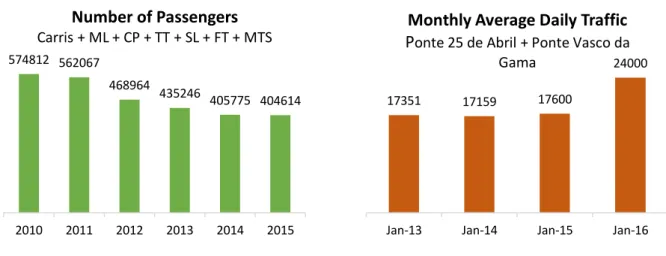
Figure 3 – Number of passengers 2010 – 2015 seven major metropolitan area of Lisbon operators (AML, 2013 and 2017) (left). Monthly Average Daily Traffic on the two bridges in the Lisbon municipality (AML, 2017) (right).
Data from 2010 to 2015 shows the declining of passengers in seven major transportation operators in Lisbon metropolitan area. On the other hand, while comparing the daily averages of the same month from 2013 to 2016 it is visible the increase of people who crossed one of the two bridges for the Lisbon municipality in 2016 as compared to the other years (Figure 3).
Table 3 – Metropolitan area of Lisbon population 2010 – 2016 (PORDATA, 2018 and AML, 2018)
COLUNA1 2010 2011 2012 2013 2014 2015 2016 METROPOLITAN AREA OF LISBON POPULATION (SOURCE: PORDATA) 2 815 483 2 824 906 2 822 719 2 812 957 2 808 347 2 810 923 2 817 014 % POPULATION USING ONE OF THE SEVEN MAJOR PUBLIC TRANSPORTATION OPERATORS 20.4% 19.0% 16.6% 15.5% 14.4% 14.4% - % POPULATION CROSSING, IN AVERAGE, ONE OF THE TWO MAIN BRIDGES IN LISBON MUNICIPALITY PER DAY - - - 0.62% (January) 0.61% (January) 0.63% (January) 0.85% (January)
By comparing the passengers’ data with the metropolitan area of Lisbon population (Table 3) we concluded that the percentage of people using one of the major seven operators to move across the metropolitan area of Lisbon has been decreasing since 2010. While there has been this reduction in public transportation usage, the data related with the average number of people who crossed the two
17351 17159 17600
24000
Jan-13 Jan-14 Jan-15 Jan-16
Monthly Average Daily Traffic
Ponte 25 de Abril + Ponte Vasco da
Gama 574812 562067 468964 435246 405775 404614 2010 2011 2012 2013 2014 2015Number of Passengers
Carris + ML + CP + TT + SL + FT + MTS10 Lisbon municipality bridges, using private cars, per day in January of the past 4 years shows a relevant increase in 2016. We can assume that the main part of the people crossing the bridges are residents in the Lisbon metropolitan area, so it is viable to question if there has been a shift from the usage of public transportation to private one in the metropolitan area of Lisbon.
The statistical analysis of European cities urban characteristics to determine factors correlated to urban growth, conducted by Caragliu, del Bo, and Nijkamp (2011), demonstrated a low ranking of the Lisbon city, while the German cities achieved the best positioning in almost all indicators. Gomes, Rego and de Castro Neto (2017) consider that happiness and wellbeing can be used a measure to assess the smartness of a city and, therefore, studied these variables in Lisbon municipality through an open data portal and a survey to the citizens. The authors (Gomes et al., 2017) created an interactive dashboard that can be used both by the citizens to support their life-decisions and by the decision-makers of city related-themes and the results demonstrated a greater performance of the city center parishes.
2.3 SMART MOBILITY
Some smart city topic researchers, often appoint the mobility aspect as one of the components or key aspects of a smart city (Anthopoulos et al., 2016; Giffinger, 2007; Šiurytė & Davidavičienė, 2016). Smart Mobility concept relates to a urban transport system which exploits smart technologies in its operation (Debnath et al., 2014), similar to the smart city concept, the ICT role is in the center when defining the concept.
The authors Debnath et al. (2014) created a methodological framework to compare smart passenger transport cities through the benchmark of 26 cities (which have a good level of infrastructure, and therefore can exploit smart technologies, and with at least 2 million people) and have identified several smartness indicators. Among the five cities which ranked in the top regarding the implementation of technologies and the respective usage in smart transport systems, the authors identified common trends:
• Tracking public and emergency vehicles – through this monitoring system several services can be created that can improve availability of transport systems, reduce travel time and enhance the efficiency of transit;
• Integrated smart card payment system – this technology use allows the track of the user behavior and creates the possibility of transports’ supply and demand management and empowering the multimodal usage of the network which will generate a better utilization of resources;
• Provide information to travelers – some cities are providing real-time information to citizens regarding public transport arrival information, available parking spaces and automated parking facilities;
• Coordinated traffic signal system, variable speed limit control and highways entry control – cities are collecting information on en-route vehicles and pedestrians to coordinate traffic signals and optimize the traffic flow by reducing travel time and fuel consumption.
Other aspect of urban mobility is related to the transport of goods, which plays a central role inside a modern city where the citizens expectations are now to be offered better and faster services. Sousa
11 and Mendes-Moreira (2015) identified difficulties faced by the freight operators related to traffic, pollution, policy constraints, parking and customer demands and considered that exists a need for innovative solutions regarding logistic services in urban areas. The authors reviewed the state of the art on the subject and concluded there is a demand for passenger and freight transport to be managed as a unique logistics system, creating an opportunity for new business models and tools for modeling and structuring the logistics system into a “multi-stakeholder, multi-criteria and multimodal dynamic
system, aiming to optimizing the design of the network, the diversification of services and the utilization of vehicles” (Sousa & Mendes-Moreira, 2015, p.89).
In Lisbon municipality center, the Gira - Bicicletas de Lisboa action, a bike-sharing system, started in September 2017 and it has now a significant grid of bike sharing services, with more than on hundred docks with bikes. Even though it is a legitimate and necessary initiative, this system is not integrated with other transportation modes and is only available in Lisbon municipality, meaning it has some, but not much, usefulness for a citizen who comes from another municipality to the Lisbon city to work every day, for example.
2.4 PASSENGER MULTIMODAL MOBILITY SYSTEMS
Literature shows distinct definitions for multimodality characteristic of transport of passengers, nevertheless the concept arises commonly when the topic in discussion is the private car usage and the sustainable environmental and social alternatives to this behavior (Di Martino & Rossi, 2016; Krajzewicz, Klötzke, & Wagner, 2016; Schuppan, Kettner, Delatte, & Schwedes, 2014; Willing, Brandt, & Neumann, 2017). The concept of multimodal mobility can be understood as the possibility to combine different transport nodes into one journey (Di Martino & Rossi, 2016; Krajzewicz et al., 2016). The authors Di Martino and Rossi (2016) defined multimodal as the possibility to leave the private car in an available parking spot and continue to the destination using another mode of transport and appoint as benefits of this system the decrease of stress regarding parking and the decrease of CO2 emissions. The authors, therefore, did not exclude the private car usage when designing an architecture for a mobility recommender system that integrates the existent transport systems with the available parking options, based on the premise that exists a lack of efficient door to door solutions. The authors Caragliu et al. (2011) defined cities’ multimodal accessibility as “the ease with which a city
can be reached with a combined set of available transportation modes (i.e., rail, road, sea, or plane)”
(Caragliu et al, 2011, p.73). The authors analyzed the factors that contribute to urban wealth and growth of European countries and found a positive correlation (the highest correlation among the evaluated indicators) between cities’ multimodal accessibility and GDP per capita. The authors concluded that the better the quality and extent of the transportation system the highest levels of wealth and growth of the city will be achieved. Willing et al. (2017) conducted and overview on existing solutions and analyzed the topic on information systems perspective concluding that “multi- and
intermodal travel behavior is desirable as it enables more sustainable mobility behavior and can potentially relieve strained urban mobility systems” (Wiling et al, 2017, p.174). The authors
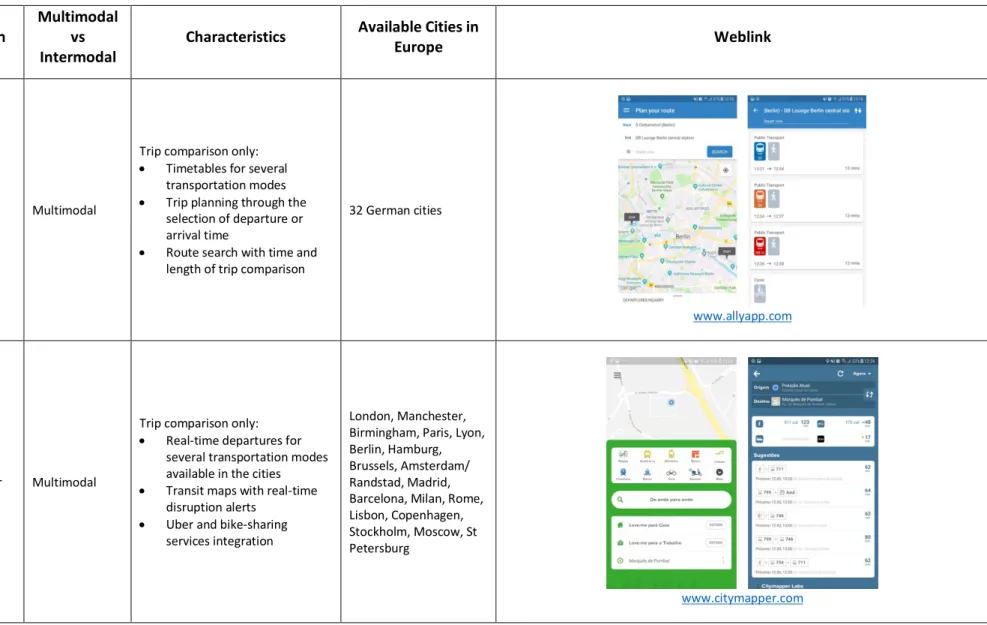
distinguished intermodal and multimodal concepts, by defining a multimodal platform as those providing multiple and alternative transportation modes for the same trip and assumed that the intermodal solution relies in the user’s opportunity to have access, in a single trip, to a combination of distinct modes of transportation. The authors analyzed some examples of multimodal and intermodal mobility platforms available in Europe and worldwide, some are presented in the Table 4.
12
Table 4 – Examples of multimodal solution - Adapted from Willing et al. (2017)
Solution
Multimodal vs Intermodal
Characteristics Available Cities in
Europe Weblink
Ally App Multimodal
Trip comparison only: • Timetables for several
transportation modes • Trip planning through the
selection of departure or arrival time
• Route search with time and length of trip comparison
32 German cities
www.allyapp.com
Citymapper Multimodal
Trip comparison only: • Real-time departures for
several transportation modes available in the cities • Transit maps with real-time
disruption alerts • Uber and bike-sharing
services integration
London, Manchester, Birmingham, Paris, Lyon, Berlin, Hamburg, Brussels, Amsterdam/ Randstad, Madrid, Barcelona, Milan, Rome, Lisbon, Copenhagen, Stockholm, Moscow, St Petersburg
13 Solution
Multimodal vs Intermodal
Characteristics Available Cities in
Europe Weblink
GoEuro Multimodal
Trip comparison only: • Train, bus and plane
possibilities for a journey in Europe, with information regarding time departures and arrivals and prices
All European cities
www.goeuro.com
Rome2rio Intermodal
Trip comparison only:
• Trip planning with combination of several operators (flight, train, bus, ferry, rideshare and rental car)
• Information on prices and journey duration
All European cities
14 Solution
Multimodal vs Intermodal
Characteristics Available Cities in
Europe Weblink
fromAtoB Multimodal
Trip comparison and booking: • Trip planning with comparison
of several operators (flight, train, bus, and rideshare) • Information on prices and
journey duration with booking possibility
All European cities
www.fromatob.com
Moovel Intermodal
Trip comparison:
• Trip planning inside the city with combination of several public transport operators (bus, train, tram, subway, ferry)
• Information regarding close stations and arrival times • Car-sharing and bike-sharing
services integration
Amsterdam, Barcelona, Helsinki, Lviv, Olso, Kiev, Madrid, Vienna,
15 Solution
Multimodal vs Intermodal
Characteristics Available Cities in
Europe Weblink
Qixxit Intermodal
Trip comparison and booking: • Trip planning with combination
of several operators (flight and train)
• Information on prices and journey duration with booking possibility
All European cities
www.qixxit.com
Ubeeqo Multimodal
Trip comparison and booking: • Find a car from several car sharing operators, book the trip and pay
London, Berlin, Hamburg, Brussels, Barcelona, Madrid, Milan, and Paris
16 For this study, in the research objects, namely the questions of the survey, there was considered no difference between multimodal and intermodal, therefore, both concepts were used as synonyms. Other concept similar and associated to multimodal mobility is Mobility as a Service (MaaS). Jittrapirom, Caiati, Feneri, Ebrahimigharehbaghi, & Alonso (2017) conducted a literature review on the subject and defined MaaS as a service that offers a tailored mobility pack, comparable to a monthly phone contract, with one single interface that can include extra services, such as trip planning, reservation and payments. The authors considered MaaS can be comprehended as mobility service that is “flexible, personalized and on-demand” (Jittrapirom et al., 2017, p.14) and “a user-centered
service adopting the advances of technology and ICT to offer various mobility solutions to customers”
(Jittrapirom et al., 2017, p.19). The authors reviewed several MaaS schemes available in the world and proposed a set of core attributes that constitute a MaaS: integration of transport nodes, tariff option, one platform, multiple actors, use of technologies, demand orientation, registration requirement, personalization and customization.
The Plano de Ação de Mobilidade Urbana Sustentável da Área Metropolitana de Lisboa (PAMUS), a plan developed to guide AML until 2020, established six strategic actuation vectors, among them, the adjustment of the transports’ offers to the citizen’s needs and the reinforcement of the transport system multimodality. This confirms the importance of the multimodal systems for the Lisbon metropolitan area quality of life growth and demonstrates that already exists a commitment from the competent authority.
2.4.1 Citizens Importance for Multimodal Mobility and Citizens Behavior
ICTs are appointed as smart city major drivers by several authors (Chourabi et al., 2012; Graham & Aurigi, 1997; Meijer & Bolívar, 2016), but literature also reveals the positive correlation of cities’ wealth and performance to social and human capital factors. Caragliu et al. (2011), analyzed an European cities’ data set to assess the determinant factors for a smart city’s performance. Among others, the authors analyzed the urban environment and the citizen’s level of education and found a strong relationship between the existence of a significant workforce employed in culture and entertainment industry and the GDP per head in European countries. Coe, Paquet, and Roy (2001) relates a city’s evolution to a smart one to the community response regarding learning, adaptation and innovation in the usage of the technology available in order to take advantage from it and INTELI (2014) stated that “citizen participation in urban transformation processes is a critical success factor for the
implementation of smart city strategies, in a perspective of co-creation and open innovation” (INTELI,
2014, p.7) when addressing the Smart Cities Portugal collaborative platform. Some studies are found on data gathered on multimodal mobility research projects and the citizen’s behavior is a frequent concern (Kenyon & Lyons, 2003; Krajzewicz et al., 2016; Schuppan et al., 2014) to understand the topic of city’s engagement towards multimodal and intermodal mobility systems. The citizen mobility behavior was studied by Schuppan et al. (2014) in Berlin with four focus groups, organized according to person’s everyday travel behavior and most frequent used transport nodes. The authors Schuppan et al. (2014) investigated the necessity of car usage and concluded the arising of multimodal mobility systems brings the declining of private cars’ usage in dense urban areas. Kenyon and Lyons (2003) studied the value to the users of information on multimodal services, “a centralised means of access
to information about multiple modes” (Kenyon & Lyons, 2003, p.5) and found out that one’s traveling
behavior is an expression of their habits, and alternative modes are rarely consulted through initiative of the user. Nevertheless, the authors discovered that when the multimodal information, in terms of
17 comfort, convenience factors, cost and duration, is offered to the travelers it can change the travelers’ concerns and create a behavioral change towards a multimodal usage of the available transportation modes. Krajzewicz et al (2016) performed an analysis on data gathered through national surveys, within the scope of the German “UrMo” collaborative project that aims to understand intermodal travelling and how the urban structures and personal habits influence it. The research was focused on Berlin and Hamburg German cities and collect socio-demographic and city structure data and demonstrated that only 17% of the citizens use a combination of different modes of transport. The authors, however, concluded that the efforts that are being done by the cities to make them more attractive, through reducing the environmental impact of traffic by fostering the use of alternative transport modes, and the decrease of parking availability in the urban centers will create a growth in intermodal systems usage.
18
3 M
ETHODOLOGY
The methodology adopted in the study intended to gather insights that allowed reaching the specific objectives and, consequently, answering to the research questions.
Following the literature review, and anchored by it, the following research questions arose:
RQ1: What is the current situation of the Lisbon metropolitan area regarding smart mobility services, in particular, concerning multimodal mobility services?
RQ2: From the perspective of the metropolitan area of Lisbon citizens, how can multimodal mobility services development positively impact their quality of live?
Afterwards, the specific objectives were defined. In order to accomplish the objectives established, the strategy set was to collect data from two sources, namely from citizens from the metropolitan area of Lisbon through a survey and from an European Union open dataset (2014) analysis - “EU Travel Survey on demand for innovative transport systems”.
The objective was to understand the real transport needs, and get insights on the subject, of the citizens of the metropolitan area of Lisbon transports and to compare the present situation of the metropolitan area of Lisbon to the similar metropolitan areas of Amsterdam, Brussels, Copenhagen and Budapest.
We believe that through the comparison of the Lisbon metropolitan area with other similar European ones the awareness on the potential of growth increases and it could be the leverage needed to invest on the development of smart mobility initiatives (Debnath et al., 2014).
Figure 4 shows how each data collection strategy used in the present study contributed to the achievement of the specific objectives and, consequently, to answer to the research questions.
19 Bryman and Bell (2007) appoint three criteria inherent to the research work quality: reliability – ensures the results of a study are stable and therefore repeatable by guaranteeing the consistency of a measure of a concept; replication – the procedures chosen to assess a measure must be replicable; validity – the conclusions of a research must ensure the integrity of the study. In the present study, the achievement of high standards on the criteria selected by the authors was taking in consideration.
3.1
SELF-COMPLETION QUESTIONNAIRESThe authors Bryman and Bell (2007) appoint five research designs that can be applied in a research work: experimental and related designs, cross-sectional design, longitudinal design, case study design and comparative design. The data collection from citizens utilized in the present study is integrated in the cross-sectional design, which is represented commonly by the social survey research, defined by the authors as:
“Survey research comprises a cross-sectional design in relation to which data are collected
predominantly by questionnaire or by structured interview on more than one case (usually quite a lot more than one) and at a single point in time in order to collect a body of quantitative or quantifiable data in connection with two or more variables (usually more than two), which are then examined to detect patterns of association.” (Bryman & Bell, 2007, p.56)
Within the social survey research scope and methods, it was developed a self-completion questionnaire, with only closed questions, created to ensure the same context to all citizens and minimize the error in the results handling.
The questions selected to integrate the questionnaire resulted from the literature review conducted and from the EU Travel Survey questions (to ensure possible comparison) and contributed to achieve the second and third specific objectives of the present study:
2. Acknowledge the Portuguese citizens’ level of awareness, commitment and information on taking advantage and incorporate multimodal smart mobility services in their daily lives 3. Compare the metropolitan area of Lisbon to other European cities, regarding smart mobility
initiatives.
The survey was applied in a digital format through Google Forms platform and the target were citizens of metropolitan area of Lisbon. The survey was available online for 2 months (from April to mid-July 2018) and was promoted through the social networks Facebook and LinkedIn and released via e-mail to the NOVA IMS community. The survey collected demographic information of the inquired in a primary section and in the second section, addressed the citizen’s opinion and level of information on:
• Scope of smart city and smart mobility concepts and related benefits;
• Mobility and everyday transport habits, including private car usage, combining more than one transport mode into one journey, and existing needs regarding public transport services; • Examples of multimodal and intermodal mobility solutions and the associated benefits to the
multimodal system.
In Table 5 the questionnaire questions are presented, and for each, the theoretical support is presented as well as the study research question and specific objective for which it intends to
20 contribute. The sociodemographic questions and the possible answers for each question are available in Table 13 in Appendix A.
Table 5 - Questionnaire created and relationship with research question, specific objectives and literature review
Research Question
Specific
Objective Question Theoretical Support
1 2 and 3 1. Do you own a
private car?
• Private car usage opposed to multimodal transport
• Private car usage integrated into a multimodal system (Di Martino & Rossi, 2016)
• EU Survey
(Willing, Brandt, & Neumann, 2017; Kenyon & Lyons, 2003) (Fiorello, 2015)
1 2 and 3 2. What are your main transport modes in your usual home to work/school journeys? • EU Survey (Fiorello, 2015)
1 2 and 3 3. How many minutes your usual home to work/school journey takes?
• EU Survey (Fiorello, 2015)
1 2 and 3 4. How many modes
of transportation do you use in one trip in your usual mobility in the city?
• Integrating more than one mode of transport into one single trip • EU Survey (Caragliu et al., 2011; Di Martino & Rossi, 2016; Willing et al., 2017) (Fiorello, 2015)
1 2 and 3 5. How much do you agree with the statement “the available mobility systems in the metropolitan area of Lisbon cover the citizen’s needs”? • Citizens complex transport needs • EU Survey - Level of public transport service (Caragliu et al., 2011; Di Martino & Rossi, 2016; Willing et al., 2017) (Fiorello, 2015) 1 2 6. From 1 to 5 what is your knowledge level on smart city concept? • Citizens awareness of the smart city concept (INTELI, 2014; Šiurytė & Davidavičienė, 2016)
21 Research
Question
Specific
Objective Question Theoretical Support
1 2 7. Evaluate from 1 to 5 the development importance of the following smart cities’ related initiatives.
• Smart city scope (Anthopoulos, 2017; Giffinger, 2007; INTELI, 2014; Khatoun & Zeadally, 2016; Šiurytė & Davidavičienė, 2016) 1 2 8. From 1 to 5 what is your knowledge level on smart mobility concept? • Citizens awareness of the smart mobility concept (Šiurytė & Davidavičienė, 2016)
1 and 2 2 9. What smart
mobility solutions would you value the most for the metropolitan area of Lisbon? • Smart mobility solutions (Debnath et al., 2014; INTELI, 2014)
1 and 2 2 and 3 10. From the benefits that can be achieved through smart mobility solutions, select the one you value the most. • Smart mobility benefits • EU Survey (Caragliu et al., 2011; Debnath et al., 2014; Di Martino & Rossi, 2016; Krajzewicz et al., 2016) (Fiorello, 2015) 2 2 11. Regarding multimodal and intermodal mobility solutions, what would you value the most for the metropolitan area of Lisbon? • Multimodal and Intermodal solutions (Willing et al., 2017) 2 2 12. From 1 to 5 how much do you believe your quality of life could
improve with the implementation of the solutions you previously choose? • Multimodal and Intermodal solutions benefits (Caragliu et al., 2011; Di Martino & Rossi, 2016; Schuppan et al., 2014) 1 2 13. Regarding the following initiatives and platforms, rate from 1 to 5 their promotion to the public? • Citizens awareness and information level
(Kenyon & Lyons, 2003; Šiurytė & Davidavičienė, 2016)
22 Research
Question
Specific
Objective Question Theoretical Support
1 and 2 2 and 3 14. If you could suggest improving mobility in the Metropolitan Area of Lisbon, what would you propose?
Some statistical tests were done with the objective to assess the magnitude of the differences found among the responses.
The chi-square test was used to analyze the relationship (Field, 2013) between gender, literacy and age (age groups) and whether they selected a particular option in each question of the questionnaire. The chi-square test was also used to:
• Understand whether there is a relationship between the most important benefit arising from smart mobility solutions' implementation and the fact that the respondent uses more than one means of transport in he/his usual trip
• Understand if there is a relationship between using car in the usual trip and the choice of the main benefit resulting from the implementation of smart mobility solutions
One-way ANOVA was used to compare means (Field, 2013) among age groups regarding the opinion regarding the implementation of smart mobility solutions in order to improve the quality of life. It was also used to evaluate the relationship between the number of transport modes used in the usual trip (one, two, three or more) and:
• The degree of agreement with the statement "the available mobility systems in the metropolitan area of Lisbon cover the citizen’s needs"
• Importance given to the development of the Mobility and Transports initiative in the Smart City context
The pearson correlation coefficient was used to evaluate the relationship (Field, 2013) between: • The duration of the usual trip in the city and degree of agreement with the sentence "the available mobility systems in the metropolitan area of Lisbon cover the citizen’s needs"
• The duration of the usual trip in the city and the importance given to the development of the Mobility and Transports initiative in the Smart City context
• The degree of knowledge of the Smart City concept and the degree of agreement with the statement "the available mobility systems in the metropolitan area of Lisbon cover the citizen’s needs"
• The degree of knowledge of the Smart City concept and the importance given to the development of the Mobility and Transports initiative in the Smart City context