Católica Lisbon School of Business and Economics
Master of Science in Business Administration
The Role of Leases in the Merger of Lan and Tam
Duarte Palhavã Rendas
Advisor: Professor Ricardo Ferreira Reis
Dissertation submitted in partial fulfillment of requirements for the degree of MSc in
Business Administration, at Universidade Católica Portuguesa, Lisbon 2013.
ABSTRACT
The Role of Leases in the Merger of Lan and Tam
Duarte P. Rendas Advisor: Prof. Ricardo F. Reis Abstract
The objective of my dissertation is to understand the role of leasing in the merger of Lan and Tam. This merger was one of the events of the year in the industry, as it created the 3rd largest airline group by market capitalization, controlling 42% of the traffic in Latin America and 6% of the world. This case study tries to answer questions related with the merger and the influence of leasing on the decision-making process before and after the merger. Among the questions addressed by this paper are the impact of the on- and off-balance-sheet contracts on the decision to merge, the possibility of Latam being able to (re) negotiate past and future contracts with the objective of better conditions and whether this merger would be possible if the leasing policy were different. We conclude that the most appropriate leasing strategy for Latam Group is the use of Operating Leases in order to meet the objectives and shareholders expectations.
Resumo
O objectivo da minha dissertação é entender qual o papel dos leasings na fusão da Lan e da Tam. Esta fusão foi um dos maiores eventos na indústria da aviação, uma vez que foi criado o Terceiro maior grupo do mundo em termos de capitalização bolsista, responsável por 42% do tráfego da América Latina e 6% de todo o tráfego mundial. Este case studie tenta responder a questões relacionadas com a fusão e também da influencia dos leasings no processo de decisão anterior e posterior a mesma. Entre as perguntas abordadas neste trabalho, realçam-se, qual o impacto das operações dentro e fora de balanço, qual a capacidade futura da Latam para (re) negociar contractos passados e futuros com o objectivo de conseguir melhores condições e por fim se esta fusão seria possível se a política de
leasings fosse diferente. Neste trabalho conclui-se que a melhor estratégia de leasing é o uso de
Operating Leases de modo a atingir os objectivos propostos e as expectativas do acionistas. Resumen
El objetivo de mi disertación es entender cual el papel de los leasings en la fusión de Lan y Tam. Esta fusión fue uno de los más grandes eventos de la industria de la aviación, una vez que fue creado el tercer más grande grupo de la industria del mundo en termos de capitalización bolsista, responsable por 42% del tráfico Latino Américo y 6% de todo el tráfico mundial. Este case studie intenta responder a cuestiones relacionadas con la fusión e también la influencia de los leasings en el proceso de decisión anterior y posterior a la misma. Entre las preguntas abordadas en este trabajo, se destacan cual el impacto de las operaciones dentro y fuera del estado financiero, cual la capacidad futura de Latam para (re) negociar los contractos pasados e futuros en orden a conseguir mejores condiciones y por fin si esta fusión sería posible si las políticas de leasing fuesen diferentes. En este trabajo se concluye que la mejor estrategia de leasing es el uso del Operating Leases, de modo a atingir los objetivos propuestos y
Table of Contents
1. Introduction ... 6
2. Literature Review ... 9
3. Leasing Companies ... 15
4. Historical Analysis ... 17
5. Latam Airlines Group ... 22
6. Data ... 25 7. Forecasts ... 25 Fleet Forecast ... 25 Capacity Measures ... 26 Revenue Forecast ... 28 Costs Forecast ... 29 Dividends Forecast ... 30
Balance Sheet Forecast ... 30
Simulations ... 31
8. Scenario Analysis ... 34
Simulation I, II, III & IV ... 35
Simulation V & Simulation VI ... 39
9. Conclusions... 42 10. Glossary ... 44 Appendix 1 ... 45 Appendix 2 ... 47 Appendix 3 ... 49 Appendix 4 ... 51 Appendix 5 ... 53 Appendix 6 ... 55 Appendix 7 ... 56 Appendix 8 ... 57 Appendix 9 ... 58 Appendix 10 ... 59 Appendix 11 ... 60 Appendix 12 ... 62
Appendix 13 ... 64 Appendix 14 ... 66 Appendix 15 ... 68 Appendix 16 ... 69 Appendix 17 ... 72 Appendix 18 ... 74 Appendix 19 ... 75 References ... 76
Acknowledgements
I would like to thank my supervisor, Professor Ricardo Reis, who has always supported me during my dissertation. I am extremely lucky to have Professor Ricardo Reis as supervisor as he has always cared so much about my work and encouraged me to improve and go further. I am also grateful to him for introducing me to the topic and presenting me the company to work on. It is a pleasure for me to work in an area where I have a keen interest and where I would like to continue working.
I also want to thank Sergio Mendoza, the link to the Latam Airlines Group, as he has always been interested and available to advise me on the best way to work and has given me detailed explanations regarding all my doubts.
I must express my gratitude to my mentor in Católica Lisbon, João Pedro Oliveira e Costa, who has always advised me during my Master’s and clarified all my doubts related with my professional future and choices.
Most of all I would like to thank family and friends who gave me confidence and encouraged me to complete my academic path to the best of my abilities, and to reach all my objectives.
1. Introduction
Some of the biggest Mergers & Acquisitions (M&A) operations of all time have happened in the recent past, making those operations almost an industry trend. Already large companies, some of them with huge financial problems, merged with other already large companies, to create a huge and competitive group operating in specific markets. Those companies that merged in the last few years were unable to handle the falling demand in the market, leading to a need to regain a competitive edge and face new challenges in the future. This merger phenomenon has happened mainly in the United States but also in Europe.1
In 2010 Lan, a Chilean-based carrier, and Tam, a Brazilian airline company, announced their intention to merge the companies in order to achieve important cost reductions and to reach better efficiency patterns in the future. From the outset it was considered to be one of the most important mergers in the industry and one of the events of the decade for the business. The Latam Airlines Group will be the third largest airline group in the world by market capitalization, just behind Air China and Singapore Airlines. Latam will be responsible for 42% of Latin American traffic.
This operation is usually considered to be a merger, but actually it was an acquisition by Lan of Tam. Brazil has some of the most restrictive laws in the world for international companies obtaining licenses to operate in the country. So this merger was the perfect operation for Lan to enter the Brazilian market without violating any rule. However, it is important to stress that the merge of Lan and Tam was the cheapest way that Lan found to become a player in the Brazilian domestic market.
Leasing has become one of the most used alternative means of financing by airlines, as it gives them a certain flexibility to adapt their fleets to market demand. Leases also help
companies to preserve cash due to the high levels of investment that each company needs to operate in the market in the most competitive way.
There are two main types of leases: financial and operating. Financial leases are those that increase the debt side of the balance sheet, the asset is depreciated as an asset of the firm and the periodic payments under the contract are registered as a financial expense. On the other hand there are operating leases that basically are a rental. The lessee simply expenses the payment and the asset does not appear on the balance sheet.
Operating leasing is commonly used by companies to hide future obligations, meaning that the balance sheets of those companies are much cleaner than the others, but the obligations are present in the same way. These companies present much lower leverage ratios (D/E or Debt ratio), which usually leads to an increase in the share price.
In order to understand the impact of leases on the merger and what should be the future strategy of the Group, the accounts were modeled to answer those questions. Four different scenarios were created for the future, where a leasing strategy was taken in each one, taking into account historical strategies by each company. In these simulations the strategies considered were:
Simulation I: The impact of both companies maintaining their levels of operating lease;
Simulation II: The Group adopts Lan’s strategy;
Simulation III: The Group implements Tam’s strategy;
Simulation IV: The Group registers all leases as financial leases.
Another two simulations were made in order to test the interest of the companies in the merger if operating leases cannot be expensed. The objective of those two final simulations was to test if the companies would be interested in the merger with the existence of just financial leases.
This work contains a heavy part of technical/theoretical explanations due to the complexity of this merge. Airliners are companies with high value assets in their balance sheets, which make mergers between these companies overly complex. Nevertheless we hope that this extensive description on the technical aspects of the merger valuation projections do not reduce the relevance we attribute to the practical conclusions of this work, namely that the leasing conditions influence the value, the decision and the result to airlines merger.
2. Literature Review
Leases have become one of the most controversial subjects in financial debate. The main discussion in the area focuses on when leases are substitutes or complements to long-term debt. It is prudent to approach a related topic, the debt capacity of leases.
Companies started to use leases in the 1960s/1970s, because these were a means to finance investments with an operational approach. At that time there were two types of leases, operating leases and financial leases. The operating leases were not capitalized, but were just expensed. This means that this type of leasing does not appear in the company accounts, despite having an associated obligation. On the other hand, financial leases are capitalized. This means that the contract and the associated obligation are present in the accounts of the firm. In both cases, ownership of the asset lies with the lessor. The major difference between the two types of leasing is the allocation of risk. In operational leases, all the risks belong to the lessor, while in financial leases all the risks are transferred to the lessee.
The main discussion referred to in the first paragraph is led by academics defending the substitutability between leases and debt, while on the other side we have practitioners arguing in favor of the complementarity of each other. Practitioners, including company managers or leasing firms, say that leases “preserve capital”, which academics believe is a fallacy. Leasing “conserves cash, provides “100% financing” or preserves credit lines”
(Eisfeldt and Rampini, 2009), according to practitioners, assuming ultimately that the debt capacity of leasing exceeds the debt capacity of lending.
Ang and Peterson (1984) indicated that leases complement debt, contradicting all the “prevailing theories in finance and economics” of the time. Assuming the complementarity of leases and debt, one may conclude then that the debt capacity of leasing is higher that debt. Eisfeldt and Rampini (2009) deduce exactly this option in their paper. They proved that due to
the ability to repossess the asset, the debt capacity of leasing is higher than the capacity of debt.
Academics, like Ross, Westerfield and Jaffe and Brealey, Myers and Allen have the opinion that one of the grey areas in leasing discussions is the fact that leasing preserves capital. For them companies will always have the simple option to borrow the full amount of the investment, which means they do not preserve capital by using leasing.
To summarize all the opinions and emphasize this issue’s relevance for the topic, it is important to remember the main idea: practitioners believe that leasing is a complement to debt, while academics believe they are substitutes.
We cannot take part in this “battle” between academics (Substitutes) and practitioners (Complements), as the applicability of those concepts depends on the conditions (Size, Activity, etc) in each firm, market or industry. This means that academics and practitioners are both correct in their interpretations and research, because they proved their research applying their own assumptions.
A good example for understanding this debate between leasing as a complement or a substitute is this case study. Lan, more structured and mature, uses leases to complement its main investments, because with its stability it does not need to grow so fast and is capable of planning its needs more accurately. On the other hand, Tam is younger than Lan and has a bigger internal market. This carrier needs to invest and expand its operations, so it uses leases to meet its needs in a way that does not make the company struggle.
The means of financing referred to above that does not lead to companies struggling, or seeming to struggle, is precisely the “off-balance-sheet” financing provided by operating leases. This means that lessees will not need to capitalize the leases, which is an opportunity to avoid increasing debt to capital ratios. Considering the operating lease market, and as demonstrated by Franzen, Rodgers and Simin (2009), if we put all the operating leases on the
companies’ balance sheet, the debt to capital ratios would generally increase by 50% to 75%. In another study by Wicker and Young (2011),the goal of IASB and FASB to eliminate off-balance-sheet operations “is expected to result in a significant increase in reported leverage for companies with large operating lease obligations”. Capitalizing all the operating leases will increase debt ratios, but on the other hand, will provide clear and useful information about the real situation of each firm. This discussion naturally leads to the associated topic of transparency. For this topic, capitalization of all means of leasing will be an objective, as this will definitely increase the accuracy of analysis of the sectors where this means of financing is used more.
As stated in the Forbes article, “Debt Hazard Ahead”, companies worked hard to make this system an encrypted way of financing, which allows their accounts to look in much better shape, without increasing liabilities and consequently debt ratios. For many companies, off-balance-sheet financing was a way to solve a lot of problems and made financing possible for financially constrained companies. Sectors that use rolling stock or high investment assets are the ones that use this type of financing the most (e.g. real estate, truck companies or airline carriers).
This case study will focus on one of the industries that uses leases the most, the airline industry. One of the reasons for the use of alternative means of financing is the sector’s need to become more efficient, reaching fast growth and meeting the expectations of the market. Eyer (1979) cited in his work that in the 1980s, the expected purchases of commercial aircraft would be worth $42 billion by US commercial airlines and $59 billion by foreign airlines. This gives a good idea of the potential of the aircraft market all over the world. As mentioned by the same author in concluding his paper, “(…) the task will call for the maximum use of available sources of financing and for legal ingenuity in developing methods of securing such financing.” This conclusion again gives us the notion that already in 1979 the developing
challenges for the industry were immense and the use of leasing would be a real option for all companies, as the advantages of leases far outweigh the disadvantages. To Eyer the main reason to lease is the possibility of tax credits although he also says that the possibility to invest without passing debt limits is also useful (under an operating lease).
Since the 1980s, the airline industry started a huge growth process and their customers become more demanding (quality and efficiency). To meet the needs of customers, carriers needed to invest more. Leases were one of the options used by managers to cope with those heavy expansion processes. As stated by Gritta, Lippman and Chow (1994) between 1969 and 1991 the percentage of operating leases in total leases in the US increased from 13% to 82%. Taking those numbers into account, Oum, Zhang and Zhang (1999) concluded that the debt capacity of the firm is not increased by “off-balance-sheet” leases (operating leases). What they mean by this is that in off-balance-sheet financing, debt and leasing seem to be substitutes. This means that, nowadays, operating leases are not seen as financial as they were in the past, but much more operational.
With all this growth in the airline market, academics started to take an interest in the optimal capacity for leases, as some companies had almost become ‘lease addicted’. Oum, Zhang and Zhang (1999) studied precisely this issue, coming to the conclusion that the optimal demand for operating leases in a carrier would be between 40% and 60% of total fleet. However, a large proportion of carriers greatly exceed those numbers, turning airlines into financial time-bombs waiting to explode. The difficult situation was caused not only by the excessive use of leases but also by unstructured growth. Nevertheless, other factors influence the industry’s bad results, like 9/11 in the US, the conflicts in the Middle East or the wars in Iraq or Afghanistan.
One solution found by many academics and managers was Mergers and Acquisitions (M&A), involving the formation of big groups with the necessary growth and sustainability. As seen by
Merkert and Morrel (2012), “(…) M&A/consolidation is seen as a “game-changer” and mandatory to survive in aviation markets.” This means that M&A nowadays is necessary or almost necessary for many carriers to survive in the market. Without M&A’s, many companies are unable to address their objectives and may become insolvent in the short-term. M&A will provide companies with ways to reduce costs through economies of scale, more visibility and power in the market to solve problems and negotiate contracts.
For Merkert and Morrel there are seven fundamental points that an M&A will affect after execution. The first is the main objective of all companies that merge, increased efficiency and cost reduction. The second is the increase in market share and revenues. This is a consequence that is expected to happen in an operation of this type. The third important point is the elimination of competition. Competition authorities tried to keep their attention on groups that may monopolize the market, but due to some financial problems and constraints they are the first to accept these deals sometimes to prevent the bankruptcy of companies. The fourth and the fifth may be taken together and are a consequence of the M&A: the power that the new group has to negotiate airport facilities or access aircraft. Point six is about the customer, and relates to the increased attractiveness for the customer that the new group will have (example: frequent flyer program, more destinations and ultimately lower prices). The last one is related to the risks and disadvantages that M&A can have for the firms. One of the main issues is the size that some groups can reach after the M&A, meaning that those groups do not work as well as planned.
Merkert and Morrel tried to prove empirically what a good size is for an airline carrier after an M&A. They noted that M&A’s started in the US, then went to Europe and now are in Asia/Pacific and Latin America, where most of the airline groups are merging. In their paper the authors concluded that some groups formed by M&A became too large to be efficient and could not be as profitable as initially expected. The optimal size of an airline after an M&A in terms of scale efficiency should be “(…) between 32 bn and 54 bn ASK and that any airline
above 100 bn ASK and certainly above 200 bn ASK is too big to operate efficiently.” This conclusion shows clearly how some groups formed by recent mergers are outsized. Groups like United Continental (with 384 bn ASKs) or Delta Northwest (334 bn ASK) may be too large to become as efficient as expected.
3. Leasing Companies
Airplanes are very expensive assets2, holding a significant proportion of airlines’ accounts.
Leases were a way carriers found to be in the market, be competitive and adopt a clear financial image. It is currently thought that 40% of the world’s commercial fleet is under some kind of lease.
Owning airplanes can present problems, both financial and operational. In financial terms, if carriers are the owners of a plane, they will see their balance sheets increase, creating a less favorable picture of the true situation of the company. In operational terms, owning an airplane can also present some problems. For example, if a carrier faces decreased demand, requiring a fleet reorganization, the fact of owning the airplane will not provide the flexibility needed. In these situations, leasing an aircraft allows contracts to be adjusted to your needs more easily.
Ireland is an important hub for leasing companies, due to their favorable corporate tax system and treaties allowing leasing companies to be competitive. Leasing firms employ more than 1,000 people in Ireland, total assets managed by those firms amount to $82.5 billion and 50% of all leased aircraft are managed from this European country. Ireland has become one of the most important places for aircraft companies. With so many advantages in operating from Ireland, it is no surprise that 9 of the 10 largest aircraft leasing companies are based in Dublin.
GE Capital Aviation Services (GECAS) and I.L.F.C. are the biggest leasing companies in the world and the biggest players in the industry, as each one owns more airplanes than American Airlines or Air France, Lufthansa and British Airways together. At this time, GECAS owns more than 1,500 airplanes and I.L.F.C. has more than 1,000. Air Lease Corp. is another player in leasing industry, founded by the former CEO and co-founder of I.L.F.C., Steven F.
Udvar-Házy, considered to be one of the most important and influential managers of the industry. However, as a recent company it has a fleet of just 102 airplanes. Other companies that play in the same market are Avolon (fleet: 162 planes), MC Aviation Partners (part of Mitsubishi Group and with a fleet of 100 planes) and Awas (fleet: 240 planes).
I.L.F.C. was bought in December 2012 by a Chinese fund. This fund paid $4.8 billion for the company previously owned by AIG (American International Group, Inc.). The incentive for Chinese companies to enter this new business is the objective of reaching the extraordinary Chinese market that is under development. The effect of the development of Asia on leasing companies is a big expectation for the near future, since it is one of the markets with the most opportunities to be explored.
Mergers & Acquisitions in industry are not specific for carriers. The leasing market for airplanes is also facing some changes and the crisis of 2008 led to some new companies appearing in the market. Those new players were basically financed by new equity that, due to the turmoil in the financial markets, was transferred to businesses that are theoretically less risky and with extraordinary perspectives for the future.
4. Historical Analysis
Lan and Tam had, until now, a similar history.3 Families controlled both companies, the
Cuetos in Lan and the Amaros in Tam. Now, both of them are stakeholders in the Latam Group. Lan and Tam were created with the purpose of providing their respective countries with domestic transport of mail and people.
In 2010, Lan and Tam signed a Memorandum of Understanding (MoU) stating their intention to merge and to form one of the biggest airline groups in the world. After submission to the competition authorities from each country, the merger was approved in 2011. At the end of 2011, before the merger, the Cueto family controlled 34% of Lan’s total capital and the Amaro family controlled 46.6% of Tam’s capital.
Lan and Tam have huge growth expectations, making this merger risky for some experts. Their main question is whether Latam will be able to manage the entire company adequately for the efficiency needed and targeting the objectives initially proposed.
In relation to leasing, Lan and Tam have a very different approach. Lan clearly uses operating leases to complement their investments, owning the majority of the airplanes. On the other hand, as recognized by Tam in their Annual Report, “Tam linhas aéreas currently leases all of its aircraft using long-term lease agreements. We believe that leasing, rather than owning, aircraft gives us greater flexibility because it allows us to change the composition of our fleet relatively quickly in the event that we need to do so.” This means that Tam has an entirely leased fleet, mainly using operating leases. At the end of 2011 Lan had a total fleet of 149 planes, of which 49 were under operating leases, 11 under financial leases and 89 were owned. The fleet of Tam was composed of 161 planes of which 147 were under operating leases, nine under financial leases and five were owned.
It is important to look deeper into Lan’s leasing strategy. The company has achieved huge credibility in the market in the last few years through its good performance and financial situation. Banks and leasing companies saw Lan as an important player in the region with a strong basis for success. This confidence was one of Lan’s most important assets as it was the key for Lan’s safe passage through two or three crises in the region without having significant weight in the company accounts. The Chilean carrier was able to (re) negotiate some contracts using its capital in financial institutions. In those cases the Group was able, for example, to change the delivery of big airplanes for small ones or even delay the reception of those assets to handle lower demand than expected. According to the company this was a crucial factor for maintaining stability and confidence in the Lan Group.
This ability to renegotiate some of the contracts and conditions allowed the company to avoid some of the usual problems in the airline industry surrounding airplane ordering. In this industry, the orders are made at the top of the economic cycle, meaning that if an airplane takes three or four years to deliver, the airplane is ready to be delivered when the company may not have demand for it, as the industry and the market are in the lowest part of the cycle. Concerning Lan’s revenues, in the last 10 years the company registered an average of almost 15% growth per year. This is a clear sign of the sustained development that Lan had in the past. The main stake of Lan’s revenues is sustained by international activity, i.e. regional (Argentina, Peru, Colombia) and international flights (Europe, United States and Oceania). Lan’s international activity accounts for 75% of the firm’s total revenues.
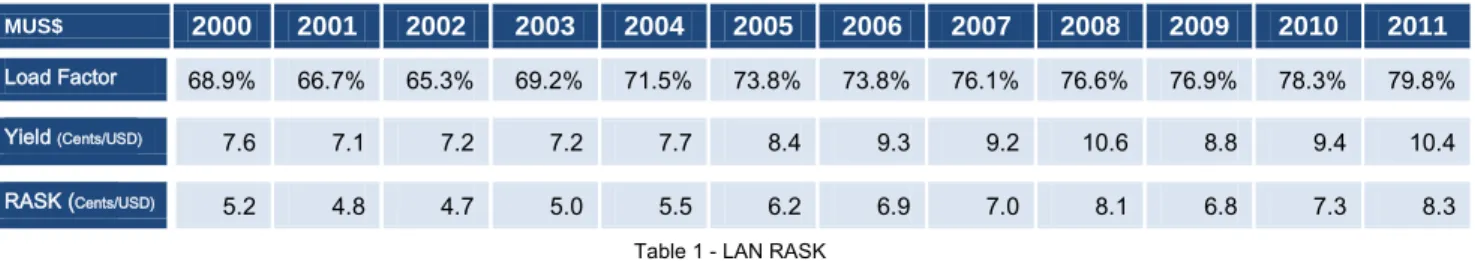
MUS$ 2000 2001 2002 2003 2004 2005 2006 2007 2008 2009 2010 2011 Load Factor 68.9% 66.7% 65.3% 69.2% 71.5% 73.8% 73.8% 76.1% 76.6% 76.9% 78.3% 79.8% Yield (Cents/USD) 7.6 7.1 7.2 7.2 7.7 8.4 9.3 9.2 10.6 8.8 9.4 10.4 RASK (Cents/USD) 5.2 4.8 4.7 5.0 5.5 6.2 6.9 7.0 8.1 6.8 7.3 8.3
Table 1 - LAN RASK
Looking at the RASKs we can see that Lan’s revenues per available seat almost doubled in ten years, reaching $ 8.3 cents per available seat kilometer in 2011. This increase was
related to the increased efficiency in the usage of the company’s available seats as well as an increased yield, which reflects an increase of tariffs on tickets sold.
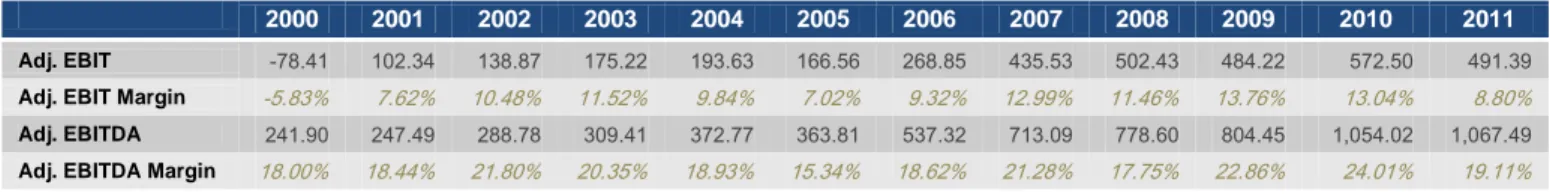
In terms of costs, it is important to note that Lan’s operating costs grew in a similar way to its revenues but on average at a lower rate. This was responsible for an average EBIT increase of 26% over the last 10 years, which is a good rate for a company with Lan’s ambitions.
Table 2 - LAN EBIT
Lan has a management policy of compensating increases in the price of fuel by increasing the most expensive tariffs. With this policy, the company slightly reduces the impact of the increase in fuel prices on the accounts. In the case of Lan, the increase in fuel prices will directly influence the yield factor for the year. It is also important to note that Lan’s business model is designed to be efficient and profitable with load factors around 80%.
In relation to Tam, the company’s revenues also grew at a good rate, reaching an impressive $6.6 billion in 2011. In this case, a major part of the revenues are from the domestic market where Tam has enormous potential to explore. The domestic Brazilian market has immense potential to grow and was one of the reasons that made Lan interested in the biggest Brazilian airline. Looking at RASKs, we see that Tam had revenue per seat available of $ 7.6 Cents in 2011. This value has consistently grown year-on-year with 2009 the year with the lowest passenger revenue per seat at $ 6.4 Cents. Historically Tam had high yield meaning that the revenue per ticket sold was generally high. The increase in the load factor has been significant since 2002, registering 73.5% in 2011.
2002 2003 2004 2005 2006 2007 2008 2009 2010 2011 Load Factor 54.8% 60.6% 66.0% 70.6% 74.2% 70.4% 71.0% 68.2% 71.9% 73.5% Yield (Cents/USD) 9.1 10.0 10.4 10.9 11.7 10.7 12.3 9.4 10.1 10.4 RASK (Cents/USD) 5.0 6.1 6.9 7.7 8.7 7.5 8.7 6.4 7.3 7.6
Table 3 - Tam RASK
MUS$ 2000 2001 2002 2003 2004 2005 2006 2007 2008 2009 2010 2011
Tam’s costs did not achieve such stable growth in the last ten years as we can see in the company’s EBIT performance, where certain years achieved negative operating income. However, the last few years saw better operational results and a stable situation for the firm.
MUS$ 2000 2001 2002 2003 2004 2005 2006 2007 2008 2009 2010 2011
EBIT 145.63 52.22 -86.96 -13.59 95.96 163.47 400.29 112.11 310.27 106.42 555.78 585.39
Table 4 - TAM EBIT
Comparing those RASK values with Lan, we conclude that Tam was as efficient as Lan in the past in relation to revenue per available seat. However, the trend was different for each company. Lan achieved efficiency increases, bringing a RASK of $ 8.3 Cents in 2011, while Tam registered a RASK of $ 7.6 Cents. This leads us to conclude that Tam’s capacity in the last years was oversized for its demand. Taking into account the load factor and yield we may conclude that historically Tam registered higher yields than Lan, but the Chilean carrier registered better load factors especially in the last few years.
Meanwhile, in order to get a more solid idea about the management of the last 10 years in both companies, we should compare their EBIT margins. In the case of Lan we find an average for the last 10 years of 9.23%, which means that Lan has managed efficiently and has controlled its costs properly. In the case of Tam the average EBIT margin was 4.57%, which is a lower value than Lan but is also a very positive number. Both companies managed their costs well although Lan had double the margin of Tam over the last 10 years. It is important to emphasize that the higher value for Lan is a consequence of more control on the cost side as well as the usage of more financial leases since the weight of operating leases in EBIT is higher.
Post-operating expenses make the biggest difference between the accounts of the carriers. Lan has much lower interest payments and foreign exchange variations, leading to a more stable and positive Net income. Tam on the other hand, registered much higher interest payments, due to its bigger debt. Tam had a Debt ratio of 82% in 2000 growing to 87% in
2011. This ratio in Tam had years at around 90%. In Lan those ratios had a stable path, in growth since 2000 and lower than Tam. In 2000 the Debt ratio of Lan was 75% leveling to 80% in 2011.
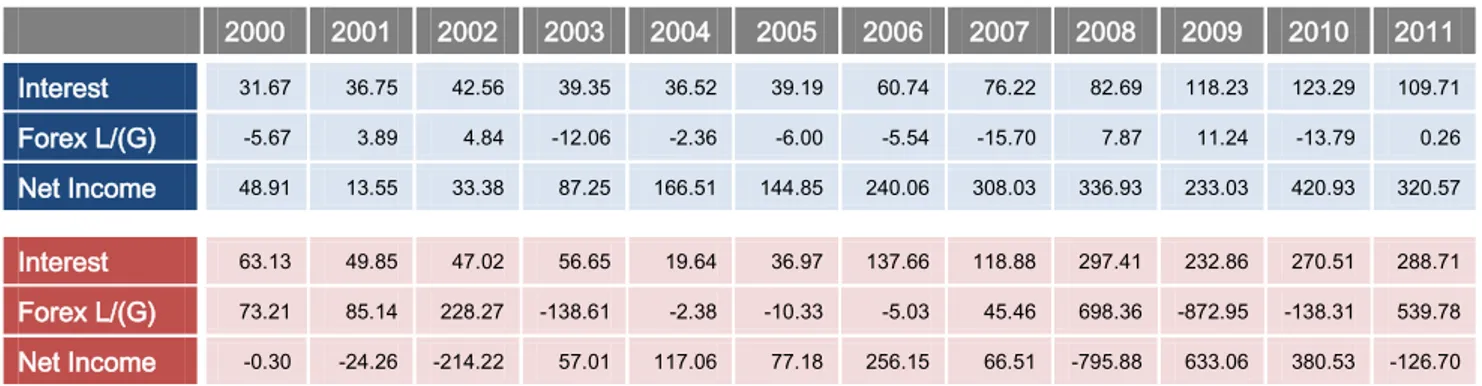
Concerning Foreign Exchange Losses/(Gains), this was the item that made a greater difference between the two companies. In Lan those values can be considered negligible in all years as they never defined the result of the company. On the other hand, Tam had incredibly high Foreign Exchange Losses and Gains in past years. It is simple to see that when Tam had negative Net income this was influenced by the variation in this item, since the company had a positive result after interest payments. The same happens when Tam had positive Net Income. As we can see in the table below, 2008 was the year when Tam had the most negative result ever. The company lost almost $800 million and the biggest part of this loss was in Foreign Exchange variation. On the other hand, in the year 2009 exactly the opposite happened. Tam had one of the best results, registering a gain in Foreign Exchange of more than $800 million. This is a clear sign that Tam’s hedging vehicles failed. This caused high volatility in the accounts that influence operating income.
In the future it is expected that with the merger of the companies, Tam will have more stable variation in Foreign Exchange due to having better hedging instruments.
2000 2001 2002 2003 2004 2005 2006 2007 2008 2009 2010 2011 Interest 31.67 36.75 42.56 39.35 36.52 39.19 60.74 76.22 82.69 118.23 123.29 109.71 Forex L/(G) -5.67 3.89 4.84 -12.06 -2.36 -6.00 -5.54 -15.70 7.87 11.24 -13.79 0.26 Net Income 48.91 13.55 33.38 87.25 166.51 144.85 240.06 308.03 336.93 233.03 420.93 320.57 Interest 63.13 49.85 47.02 56.65 19.64 36.97 137.66 118.88 297.41 232.86 270.51 288.71 Forex L/(G) 73.21 85.14 228.27 -138.61 -2.38 -10.33 -5.03 45.46 698.36 -872.95 -138.31 539.78 Net Income -0.30 -24.26 -214.22 57.01 117.06 77.18 256.15 66.51 -795.88 633.06 380.53 -126.70
Table 5 – Interest Expense, Foreign Exchange Losses/(Gains) and Net Income
Both companies already adopted IFRS as their reporting standard. Lan adopted IFRS in 2009 while Tam has used it since 2008. When Tam adopted IFRS standards it had to increase its assets by $4,000 million, as its assets did not fit in the standard rules.
5. Latam Airlines Group
With the merger of Lan and Tam, one of the biggest airline groups in the world was created, responsible for 42% of Latin American and, according to Euronews article “LAN + Tam = LATAM”, 6% of total world traffic.
The merger was performed through a swap of Tam shares. Shareholders of Tam exchanged their shares for Latam Airlines Group Shares at 0.9 to 1, meaning that the Tam shareholders get 0.9 Latam shares for 1 share of Tam. Latam shares were the previous Lan shares, with Lan shareholders maintaining their shares.
After the merger of Lan and Tam the shareholder structure of Latam became predominantly controlled by Chilean companies such as Eblen or Bethia and by Chilean Pension Funds.
*Source: Latam Airlines Group
Graph 1 - Latam Airline Group Shareholders Structure
The new group has become an important player in Latin America, based in six Latin American countries and also in the US, where they have an important structure for their cargo activity. Tam Cargo was incorporated into the cargo business unit of Latam, with no distinctions between Tam Cargo and Lan Cargo.
Concerning organization, the Group is being managed mainly by the Chilean team. The Group is organized into business units with operations segmented by type of activity. The chairman of Latam Airlines Group is the Brazilian Mauricio Rolim Amaro and Enrique Cueto
heads the management team. The CEO of Lan is Ignacio Cueto and the CEO of Tam is Marco Bolonha. The Group is divided into eight business units where we have:
One international unit, that is divided into regional and long-haul;
Six domestic units. These units have operations related to Brazil (Tam), Chile (LAN Chile), Argentina (LAN Argentina), Colombia (LAN Colombia), Ecuador (Lan Ecuador) and Peru (Lan Peru);
One cargo unit, where the Tam cargo division was incorporated into the Latam cargo unit.
This organization is similar to Lan’s before the merger, as the successful management by the ex-Lan team will be helpful in controlling the costs of the Brazilian carrier and making the group competitive in the future.
Challenges For The Future
Latam Airlines Group may face some challenges in the future. One of the bigger challenges is the credit risk that the Group will face. Banks have already downgraded the company risk note and are watching whether the company will be able to achieve the desired synergies that were the main argument behind the merger.
Another important issue is the lack of infrastructure in Chile and Brazil. Chile has plans in aeronautical infrastructure worth around $14 billion with the objective of improving and giving capacity to the country in order to become an important player in the region. Brazil on the other hand is already improving some infrastructure as the country will host the FIFA World Cup in 2014 and the Rio de Janeiro Olympic Games in 2016. Furthermore, the Brazilian government intends to construct almost 800 airports in the country. In Brazil this improvement is very necessary.
Another challenge for the Latam Group is future growth and new potential markets in the future. After the stabilization of this merger, the Group is expected to grow in new markets, like Asia, Europe or even Africa. In my opinion Latam Airlines Group would be an excellent buyer for the Portuguese carrier, TAP Portugal. With this Portuguese company in the Group, they would be able to compete with Iberia in air transport to Latin America, making Lisbon an important hub in Europe. Being competitive in air transport to Europe and being the market leader in Latin America, Latam would have even more importance in the airline industry.
6. Data
In order to simulate the impact of leasing on the merger of Lan and Tam, all the financial information used was taken from Bloomberg and complemented with the available information in annual reports, from the last ten years for Lan and six years for Tam. Data from Bloomberg was used as all the accounts are standardized assisting the analysis and making all the accounts analogous.
In relation to the quality of the reporting of each company, Lan has much more quality in the available reports than Tam. Another important aspect is the range of Annual Reports available, since Lan has eleven years available while Tam has just seven years. Another issue is the currency that the companies present their statements in. Lan presented all its accounts in US dollars while Tam presented accounts only in Brazilian real. This factor was another major reason to take standardized accounts from Bloomberg.
7. Forecasts
In order to simulate Lan and Tam accounts forecasts were made for the future based on numerous assumptions, all using future expectations of the companies and the market. Some industry players like IATA, Airbus or Boeing made some of those market forecasts. The estimate of all Lan and Tam accounts (Latam Airlines group) was made initially assuming that both companies will merge in 2012, and each will maintain its leasing strategy. The accounts were modeled independently from each other, being consolidated in each simulation. Economies of scale were considered in the forecast as explained ahead. In each simulation the accounts were consolidated according to each purpose and the necessary adjustments will be taken into consideration.
Fleet Forecast
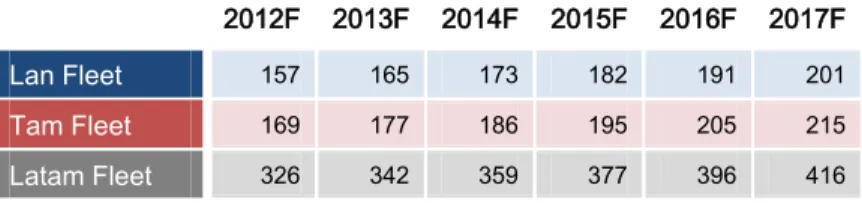
The fleet was forecast based on the expected fleet growth rate used byAirbus, of 5.1% a year until 2021. This goes in line with Latam’s expectations, as the projected fleet for 2014 is 359 airplanes.
2012F 2013F 2014F 2015F 2016F 2017F
Lan Fleet 157 165 173 182 191 201
Tam Fleet 169 177 186 195 205 215
Latam Fleet 326 342 359 377 396 416
Table 6 - Forecasted Fleet
Capacity Measures
The first items forecast related to capacity of each carrier accordingto market expectations. In these items were included the total amount of passengers carried, ASKs, RPKs, ATKs, and RTKs.4
Latin America is one of the most resilient markets in the world and the crisis of the last years was not felt as much as in other markets, like Europe. This does not mean that the main Latam market is perfect and immune to the crisis, but it is a good sign to work in markets where the expectations in the short and long term are some of the best in the world.
Brazil’s economy is expected to underperform the expectations of analysts, but as stated by Ignacio Cueto, Chairman of Lan, in a Bloomberg interview; “ Brazil still has a strong economy, will have a World Cup in two years and is growing” and added, “Maybe not at 5 percent, but definitely at 2 or 3 percent.” Brazil has a well-developed primary sector and better growth rates than any other South American country in the past.
Chile on the other hand is expected to maintain its market-oriented economy, strong and capable of growth in the next few years. Chile is one of the countries in Latin America with the best reputation for strong institutions, earning it the best sovereign rating in the region.
2012 2013 2014 2015 2016 2017 Chile GDP Growth 4.96% 4.45% 4.60% 4.60% 4.60% 4.60% Brazil GDP Growth 1.47% 3.95% 4.20% 4.20% 4.11% 4.14% Latin America GDP Growth 3.17% 3.89% 4.05% 4.01% 3.98% 3.97%
Table 7 - GPD Growth Rates
Some players dismissed the Latin American market as forecast growth rates for traffic were much lower than the effective traffic registered for the same periods. Both markets under analysis in this research may be seen as being special because they are unique in the region. The Chilean market is limited in terms of domestic activity, but is probably one of the most mature markets in Latin America. On the other hand the Brazilian market is the biggest internal market in Latin America and is seeking expertise to ensure structured growth of the firm’s activities. In all Lan’s activity, the company’s international business brings in almost 75% of the revenues.
For Lan the expected growth in passengers was considered to be 2% in the first two years (2012 and 2013) and then is expected to grow at a rate of 5% per year. In relation to Tam the two events (FIFA Football World Cup in 2014 and the Olympic Games in Rio de Janeiro in 2016) that will occur in the country were taken into consideration and are expected to have a big impact on Tam’s activity. So, for the Brazilian carrier, passengers carried by the company are expected to grow at a rate of 2% in 2012 and 2013 and then 6% a year in 2014 and 2016. In 2015 and 2017 it is expected to grow 3%.
ASK was forecast according to the 5% growth expected by the Latam Airlines Group. The Group expects a decrease of 2% in Tam’s ASKs in 2012 and then expects overall ASKs growth for the Group, of between 4% and 6%. For this purpose 4% was taken as the growth rate per year from 2013 on, such that the Group achieves some of the desired efficiency gains. This means that if the demand measure (RPK) grows at a higher rate than supply (ASK) this will lead to better efficiency from each company, which is the major objective behind the merger.
In terms of cargo activity, since Lan is the company in the Group with the greatest activity in the sector (cargo accounts for 28% of Lan revenues, but 11% for Tam), the ATKs and the RTK were forecast only for the Chilean carrier. Lan Cargo is active in the Latin American
market making an important bridge to the US and is expected to grow at a stable rate for the future. Total tons carried by Lan is expected to grow at an average of 4% a year. In this period Lan will achieve one of the major goals in the cargo business: to increase efficiency, as it will increase the cargo load factor to 75% in 2017 in comparison with 69% registered in 2011.
The RPK forecast, was calculated from the ASK forecast and from the Group’s expectation of the load factors of both companies. In the case of Lan the expected load factor is around 80% and for Tam 75%.
Revenue Forecast
The revenues of both companies are expected to grow for the future,especially after 2013. In 2012 Tam revenues are expected to decrease a little - around 1%. For Lan stable growth around 4% is expected in 2012, reaching around 5% a year between 2014 and 2017. The revenues of the Chilean airline are expected to reach more than $7 billion in 2017, growing almost $2 billion in five years.
Passenger revenues were calculated using the growth of RASK. Latam Airlines Group has expectations for Lan, due to the business model of the Chilean carrier, based on a load factor of around 80%. The yield will also be stable. As already explained, when Lan encounters increases in the price of fuel, it tries to reduce the impact of those increases by increasing higher tariffs. Despite being an item with high fluctuation and uncertainty, it has been assumed to be stable in future years.
In the case of Tam, the load factor is expected to increase slightly in the future, with significant increases in 2014 and 2016 when Brazil hosts the FIFA World Cup and the Olympics. In terms of yield, it will be the same as Lan targeting a value of 10.4% per year. Tam is expected to assume Lan’s strategy in relation to the business model, meaning that the load factor in the long term should increase to around 80% and fuel expenses will have an
impact on higher tariffs. After forecasting the RASK for each year and having already forecast the ASK, we have the passenger revenues for each company.
For Lan Cargo, the method for estimating future years was the same as for passengers, using the expectations of the Group of a 5% increase in the load factor for the future. The yield is expected to remain constant.
Tam’s cargo business will be responsible only for the domestic market in Brazil and Lan Cargo will assume all the international activity of the Group. Tam’s cargo revenues thus will grow according to total revenues, equating to 8.8% of it for all the years forecast.
Other revenues includes duty-free, logistics and tours, and is expected to grow at the rate of inflation in each country.
Costs Forecast
The cost of revenues was forecast to remain a stable percentage ofpassenger and cargo revenues, using the worst value of the last five years. In the case of Lan was 73%used and for Tam 83.9%. The most relevant items in Cost of Revenues (Operating Leases and Fuel Expenses) were also forecast for each year. Operating leases were calculated taking into account the expected composition of the fleet and the amount of airplanes under operational lease. Fuel expenses were forecast taking into account the historical liters consumed and the cost per liter. The forecast of liters consumed was based on the total number of airplanes and consumption per plane. Consumption per airplane is expected to drop in the future due to the new airplanes that the Group will acquire which are much more environmentally friendly (such as the Boeing 787 Dreamliner).
Other Operating Expenses, which includes depreciation, will grow at the inflation rate for Chile and Brazil, respectively. Depreciation was forecast based on the value of total assets for each
year. The depreciation rate used was the average depreciation rate for each company over the last five years.
Interest expense was calculated based on the average interest rate for the last five years, considering the interest expense of the year and the total borrowing (short-term and long-term) for each firm. Tax expense was calculated based on the average tax rate of each firm for the last five years.
Dividends Forecast
The distribution of dividends is an important issue in the merger ofLan and Tam. In Chile there is a governmental law stating that distribution of dividends is mandatory at a minimum rate of 30%. So, for the forecasts, this rate was considered independently of the dividend payout ratios of each firm in the past years. This may have an impact in the future as the average of the dividend payout ratio of the last six years was 54% for Lan and 7.7% for Tam. However, to be conservative, 30% was taken as the future rate.
Balance Sheet Forecast
The Cash and Cash Equivalents item was considered to be4% of total revenues every year. This is because the company can borrow or lend in the short term to address insufficient or excess cash. Short-term borrowing was considered for every year to be 1/5 of the previous year’s long-term borrowing plus the cash needed for the year. On the other hand, long-term borrowing was forecast according to the expected fleet expectancy. In this particular case Lan’s expected long-term borrowing will be higher than that of Tam, as Lan’s strategy involves more airplanes on the Balance Sheet, leading to higher debt.
Accounts Receivable and Accounts Payable grow as a percentage of revenues and expenses respectively.
The item Other Long-Term Assets is growing at a stable rate of 11% which is the average growth of the past three years. Concerning Other Short-Term Assets, it is assumed that 1/5 of the previous year’s Other Long-Term Assets will become short-term. Considering that the proportion transitioning from long to short term is 32% of total Other Short-Term Assets, it was straightforward to predict the total value of the item. Other long-term/short-term liabilities will be forecast in the same way as other short-term/long-term assets.
The Net Fixed Assets item was forecast based on the expected growth of the fleet. For this, the historical values of each airplane in the balance sheet were calculated for each year. The value used for 2012 was the value of each airplane in 2011 plus slight growth reflecting the addition of new and more expensive airplanes and the devaluation of older ones. After deriving this value and knowing that historically aircraft account for more than 70% in total Net Fixed Assets, the total value of this item could be calculated. The depreciation for each year was predicted using the expected values for Net Fixed Assets and the average of the last five years’ depreciation, for inclusion in Other Operating Expenses in the Income Statement. Long-Term Borrowing was calculated in a similar way to Net Fixed Assets, as each airplane in the item was calculated. This was used to forecast the future values basing this again on the expected fleet number for each year. For this forecast only the airplanes accounted as financial leases/owned were included.
Retained Earnings were considered to be the previous year’s value plus the Net Income for the year less the dividends forecast for each year.
Simulations
For each simulation, the adjustments were made that are involved in each strategy. This means that for all the simulations the values were reconsidered for: the composition of the fleet, Depreciation, Net Fixed Assets, Long-Term Borrowing, Short-Term Borrowing, Interest,
Tax Expenses and Cost of Revenues. All other items of the Balance Sheet and Income Statement were considered as initially forecast for both companies.
In all the simulations the Goodwill of the operation was also take into account, at $2,056.37 million. Also related to the merger operation, each consolidation included the new share capital for the Latam Group at $1,435.34 million.
For dividend payments, the minimum rate required by the Chilean law, 30%, was considered for all the years. The payment of dividends is only mandatory in Chile, although it was assumed that this will be applicable in all the years for the whole group.
Simulation I
The main objective of this simulation is to understand what happens to the newLatam Airlines Group if both companies continue with the same leasing strategy. This means that in this case Lan will continue with 33.3% of airplanes off-balance-sheet while Tam will maintain a ratio of 46.5%. Those percentages do not mean that Tam will have just 46.5% of operating leases, but that despite the number of airplanes under operating leases, just 46.5% of them will be accounted for as operating. In this case, it was only necessary to consolidate the results forecast in the base case, paying attention to the Goodwill.
Simulation II
In this case we tried to test what happens if the Group adopts Lan’s strategy.This means that the entire group will have 33.3% of planes off-balance-sheet. Here it is assumed that the change of strategy took place in 2012, involving relevant contract changes in just one year.
Simulation III
The third simulation is similar to the third, since it is the opposite strategy. Wetried to understand the impact on the Group’s accounts if they adopt Tam’s strategy. This means maintaining 46.5% of airplanes off-balance-sheet. Again it was assumed that the change in strategy takes place in 2012.
Simulation IV
In this case, was tested the accounts for the possibility of the termination ofexpensing leases (operating leases). This is in line with some intentions of IASB and FASB to eliminate the possibility of operating leases having only the hypostasis of capital leases. In this case Latam will have no airplanes off-balance-sheet.
Simulation V & Simulation VI
In this case the intention was to understand if companieswould be interested in the merger if only financial leases existed. For the last 11 years for Lan and seven years for Tam, historical accounts were manipulated to understand what effect having all the planes on-balance-sheet would have on the decision-making process. The question that we try to answer is whether the companies would have an interest in merging if this situation happens.
8. Scenario Analysis
As we will see in this section, leases can generate different financial results for the Latam Group. Depending on the strategy chosen, net income or the debt ratios will change.
Airlines are by definition companies with very high debt ratios due to the high value of their assets. Carriers usually need to acquire those expensive assets with debt. However, pure long-term borrowing can lack flexibility, which those types of companies urgently need. Leases are one of the hot topics in finance, particularly since the Enron case. The possibility of off-balance-sheet financing came under discussion with this case and some of the most important institutions in accounting, such as the IASB and FASB, are trying to converge their standards to eliminate or reduce this possibility. However, one of the main types of off-balance-sheet financing is leasing.
Before analyzing the simulations, it is important to analyze some variables that are common to all the scenarios - the capacity measures (ASK, RPK, ATK and RTK). Some of the improvements in efficiency come from a better usage of the existing capacity. The Latam Group is expected to increase passengers and cargo load factors, thereby achieving the efficiency improvements expected.
Lan has been very efficient in the past, and is expected to maintain passenger load factors at around 80%, which is the target for the Lan business model. In the case of Tam, the passenger load factor is expected to increase to 75%. In the cargo business the Group will be able to improve the load factor of Lan Cargo by 5%. This was another objective of the merger, since in past years the company registered ratios that were considered not to be acceptable by the management.
In terms of capacity, the group seems to stand in the higher interval (as defined by Merkert and Morrel) to be a group efficiently managed. As we see in the graph 2, Latam will be above
the 32-53 bn ASK and also the 100 bn, but below the 200 bn. Compared with the extremely large groups in US we can forecast that the case of Latam is expected to become a controlled case, since it has almost half of the capacity of groups like United Continental and Delta Northwest, and is in the higher acceptable interval for Merkert and Morrel.
Simulation I, II, III & IV
As an initial point of analysis and just focusing on the concept and accounting of leases, we may conclude that debt ratios for Simulation III and V will be higher than the others. The assets of those two simulations will be higher and the financial expenses will definitely be higher. These expectations are just an interpretation of the standards that state how to account for leases.
In each simulation we will have different weights of operating leases in the total fleet of the group. Considering the optimal capacity for leases stated by Oum, Zhang and Zhang (1999), we are able to get interesting conclusions. Applying these to the present study, only simulations I and III are in the optimal interval of optimal operating leases. Simulation II (33.3%) is not above 40% but sufficiently close to it to open good perspectives for the future. Simulation IV is as expected out of the optimal interval since it does not register any Operating lease. 0,00 20.000,00 40.000,00 60.000,00 80.000,00 100.000,00 120.000,00 140.000,00 160.000,00 180.000,00 2012 2013 2014 2015 2016 2017
Latam Total ASK
As we can see in the table below, the Debt-to-Equity (D/E) ratio is very different from simulation to simulation, although our expectations about the weight of the debt in the accounts are proven correct. The ratios below are really high ratios for any company, in any market, although for airline companies, where the value of each asset (airplanes) is very high, the industry D/E ratio is around 300% or 400%. So the Latam Group in some cases will reach these values in the future; in others it will pass them. This situation of high levels of debt should be one of the causes for the Group to have more control since it was debt that made some recent mergers, especially in the U.S., unsuccessful. Those giant groups with high levels of debt were unable to be operationally efficient, and to generate value to make high interest payments. 2012F 2013F 2014F 2015F 2016F 2017F Simulation I 349.37% 360.87% 348.93% 363.21% 346.70% 351.04% Simulation II 418.29% 418.85% 410.17% 407.68% 406.38% 404.12% Simulation III 318.38% 282.29% 252.23% 229.94% 212.26% 198.21% Simulation IV 680.70% 678.17% 673.44% 673.94% 676.00% 678.76%
Table 8 - D/E Ratios per Simulation
The D/E ratios seen above mean in terms of debt ratio, an equivalent value for the next years of around 84% for simulation I, 85% and 86% for simulation II, 76% and 83% for simulation III and 89% for the simulation IV.
Both ratios register a similar path in future years. D/E and Debt Ratio rise in 2012 and then the Group will be able to reduce those ratios. The company will reduce the D/E more in Simulation II and III showing in these two cases clear sign to the market that they are able to meet their obligations and reduce their D/E ratio in a quick way. In the fourth simulation we are considering values of Debt ratios that are completely outside any mean or expectations, although the company in this situation is able to recover in 2/3 years and start generating enough cash to meet their obligations through operating activity. The capacity to meet their financial expenses with operating income is measured by the interest coverage ratio. Latam will have a ratio above 100% in most of the years and simulations. Reaching ratios above
100% means that they are able to generate sufficient profit to cover their interest expenses. Is interesting to see that in all the simulations Latam will be able to have an interest coverage ratio above 100%.
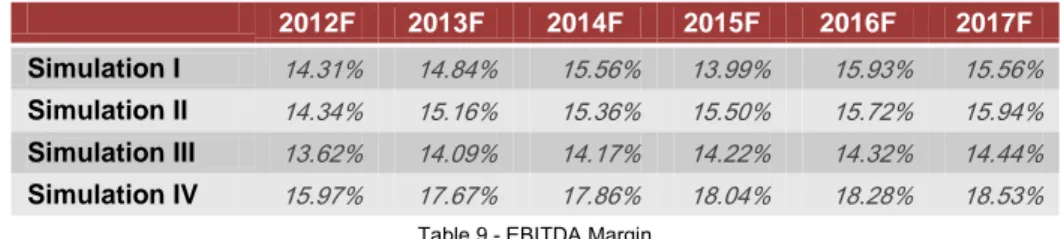
Concerning operating margins, we can see that the simulations where financial leases prevail have a higher EBITDA Margin than the simulations where the Group has operating leasing or owns the airplanes. This is a consequence of the accounting in each situation since the operating lease has to be expensed as an operating expense and the financial lease is considered a financial expense. As we see below, the simulations with a higher weight of operational lease have higher operational expenses before depreciation, causing lower EBITDA Margins each year.
2012F 2013F 2014F 2015F 2016F 2017F
Simulation I 14.31% 14.84% 15.56% 13.99% 15.93% 15.56%
Simulation II 14.34% 15.16% 15.36% 15.50% 15.72% 15.94%
Simulation III 13.62% 14.09% 14.17% 14.22% 14.32% 14.44%
Simulation IV 15.97% 17.67% 17.86% 18.04% 18.28% 18.53%
Table 9 - EBITDA Margin
Looking at EBIT (with depreciation included) we see that the operating result will decrease and consequently the margin will be reduced. Interestingly in simulations II, III and IV the margins that we get for each simulation are basically equal, meaning that the choice between each leasing strategy is almost indifferent for shareholders. In the case of simulation I, the margin variation is quite different but for this analysis it can be assumed to equal all other simulations. 2012F 2013F 2014F 2015F 2016F 2017F Simulation I 11.07% 10.49% 11.18% 9.58% 11.37% 10.92% Simulation II 10.00% 10.19% 10.39% 10.48% 10.57% 10.67% Simulation III 10.05% 10.26% 10.46% 10.56% 10.66% 10.77% Simulation IV 9.88% 10.04% 10.21% 10.29% 10.36% 10.44%
Table 10 - EBIT Margins
So, being indifferent between all the strategies in an operational point of view, undoubtedly the key element in terms of income will be interest payments. In line with the previous
analysis, interest can be expected to be higher in the cases where financial leases are used more. This means that the profit will be higher in simulation III where financial leases are used less and the debt has less weight in the Balance Sheet of the Group.
On the other hand, taxes are higher in the cases where we pay less interest associated with debt. However, even paying more tax, simulation I and III are the most profitable for the Group’s shareholders.
Although simulation II may be considered an alternative for the Group, this strategy will not be able to generate sufficient earnings to meet simulation III’s result. This leasing strategy is the one showing a clearer image about the Group to the market. Simulation IV is definitely not an option since that case was considered a last option for the Group, although it is interesting to see that the Group in 2015 is already able to generate sufficient operating income to meet debt requirements.
One of the most important questions that this work addresses is if Latam Group will be able to negotiate better contracts and also renegotiate some of the past ones. Looking at the present situation it seems to be clear that some of Tam agreements are not as good as the existing Lan ones. With the biggest weight of Latam in the market, some future contracts can be negotiated, with certainly better conditions on behalf of the joint group than the ones negotiated in the past for either one of the two companies. However, when it comes to renegotiating past contracts, it is not consensual that suppliers will be open to immediately review existing terms, since is those players (Banks, Aircraft Manufacturers, etc) will still be expectant with respect to the results of the merge. This is the opinion of some specialists in the aircraft leasing industry, which we interviewed for this project. , They claimed they are waiting for the first signs of the merge to see if the management is able to handle efficiently the consolidated operation. According to these opinions, it is expectable that banks will wait between one and two years to see the consistency of the results and take a solid position.
Although it is crucial to emphasize an overall optimism and enthusiasm about the success of the operation.
Taking into account that the leasing strategy of the group is fundamental for the financial position of the stakeholders, it is important to connect each simulation with a possible standpoint of these players. Simulation III will be the one that should become most favorable, since the company will have lower Debt Ratios and will be able to generate enough revenues to face to all the financial obligations. The most difficult situation to handle is the case of simulation IV since the group will get high levels of debt without an anticipation of decreasing those levels in a near future.
Simulation V & Simulation VI
In order to understand if Lan and Tam would be interested in a merger where the option of accounting for operational leases does not exist, Lan’s accounts were modeled to capitalize all the fleet as a financial lease since 2000. With these simulations we are able to understand if Lan would be in a good situation to face the challenges of the market in recent years. In the year of the change of strategy, Lan suffers abrupt changes in its debt ratios and margins as in the previous simulations. The debt ratio registered a value of 75% in 2000, although the capitalization of the assets will generate much more debt, which increases the debt ratio to 102%. This means that the company would have negative equity due to the negative income for the year of $245.72 million. After the first impact on the accounts due to the capitalization, the company will have negative results until 2007. In terms of the interest coverage ratio, Lan will only be able to generate ratios above 100% in 2008, when the company increased revenues to almost $1 billion.
In terms of margins, as we can see in the table below analyzing the EBITDA margin, we see that operating income will increase, due to the operating lease coming off the accounts and so increasing operating income before depreciation, as expected. In the case of EBIT Margin