Cyclic behaviour analysis of RC elements with plain reinforcing bars
C. Fernandes, J. Melo, H. Rodrigues & A. Costa
University of Aveiro, Portugal
H. Varum
University of Aveiro, Portugal ELSA, Joint Research Centre, Italy
A. Arêde
University of Porto, Portugal
ABSTRACT:
The seismic performance of RC elements with plain reinforcing bars is particularly sensitive to the bond-slip mechanism. In this paper are described the cyclic tests performed on a two-spans beam with plain reinforcing bars and two beam-column joints with the same geometry and reinforcement detailing, one with plain reinforcing bars and the other with deformed bars. The main experimental results are presented and the comparison between the global behaviour of the two joints is established. A numerical model of the beam was developed within the OpenSees platform and calibrated with the experimental results. Particular attention was given to the bond-slip mechanism. Additional numerical analyses were developed without considering bond-slip. The comparison between the main numerical and experimental results shows the great importance of considering the bond-slip mechanism in the numerical models in order to have a precise simulation of the cyclic response of RC elements with plain reinforcing bars.
Keywords: Plain reinforcing bars; Cyclic behaviour; Bond-slip; Experimental Tests; Numerical modelling
1. INTRODUCTION
An important number of existing reinforced concrete (RC) building structures were built before the introduction of seismic-oriented design standards, with plain reinforcing bars. As a consequence of poor seismic detailing, these structures are expected to behave poorly when subjected to earthquake actions. The hysteretic behaviour of RC structures, namely when subjected to alternate actions like the induced by earthquakes, is highly dependent on the interaction between steel and concrete, and bond degradation is reported to have been the cause of severe local damage and even collapse of many structures during past earthquakes. Recent experiments (Pampanin et al. 2000, Liu and Park 2001, Pinto et al. 2002, Varum 2003, Verderame et al. 2008, Marefat 2009, among others) show that RC elements with plain reinforcing bars under cyclic loading are particularly sensitive to the bond-slip mechanism. Thus, considering the bond-slip mechanism in the numerical models of structural analysis is essential to achieve a more accurate simulation of the real behaviour of RC structures with plain reinforcing bars. Considerable research work (Manfredi and Pecce 1998, Youssef and Ghobarah 1999, Kwak and Kim 2006, for example) has been developed in this line. Though, numerical analyses are usually made disregarding bond degradation and perfect concrete-steel bond is usually assumed.
2. CYCLIC BEHAVIOUR ANALYSIS OF A TWO-SPANS RC BEAM
This section addresses the experimental and numerical assessment of the cyclic behaviour of a RC beam built with plain reinforcing bars, that was collected from the Santa Joana Museum (an aggregate of ancient constructions, part of the cultural and historical heritage of the city of Aveiro, in Portugal), in 2007, during the partial demolition of one its buildings.
2.1. Geometry, support conditions and materials properties
The RC beam is characterized by a rectangular 0.18x0.22 m2 cross-section and a total span of 8 m (Fig. 2.1). The mechanical properties of the plain reinforcing bars could not be investigated since it was not possible to obtain bar samples for performing tensile strength tests. From the compression tests of cylindrical concrete samples that were extracted from the beam after the cyclic test, a mean strength equal to 19 MPa and standard deviation equal to 1.32 were obtained. According to the Eurocode 2 (EC2, CEN 2004) classification, the concrete class is between C12/15 and C16/20.
4.0 m 4.0 m
left
support left span right span
middle support right support (a) 2Ø10 Ø8//0.180 m concrete cover = 22 mm 0. 22 m 0.18 m 2Ø12 2Ø12 (b)
Figure 2.1 RC beam: a) spans and supports conditions; b) cross-section geometry and reinforcement detailing
2.2. Cyclic test
2.2.1. Test set-up, instrumentation and imposed vertical loading history
The beam was cyclically tested under force-controlled conditions, loaded by two vertical forces (F), symmetrically positioned at the mid-span sections (Fig. 2.2). The monitoring of vertical displacements was made resorting to draw wire displacement transducers placed along the two spans. The imposed loading history (Fig. 2.3) consists in series of three loading-unloading cycles of increasing amplitude, until a maximum force of about 25 kN, when it was observed the beam collapse.
F
FRONT VIEW SIDE VIEW
TOP VIEW reaction-floor servo-actuators F 2.0 m 2.0 m 2.0 m 2.0 m (m) 0 5 10 15 20 25 30 Fo rc e, F (kN ) Step F F
Figure 2.2 Test set-up Figure 2.3 Loading history
2.2.2. Experimental results
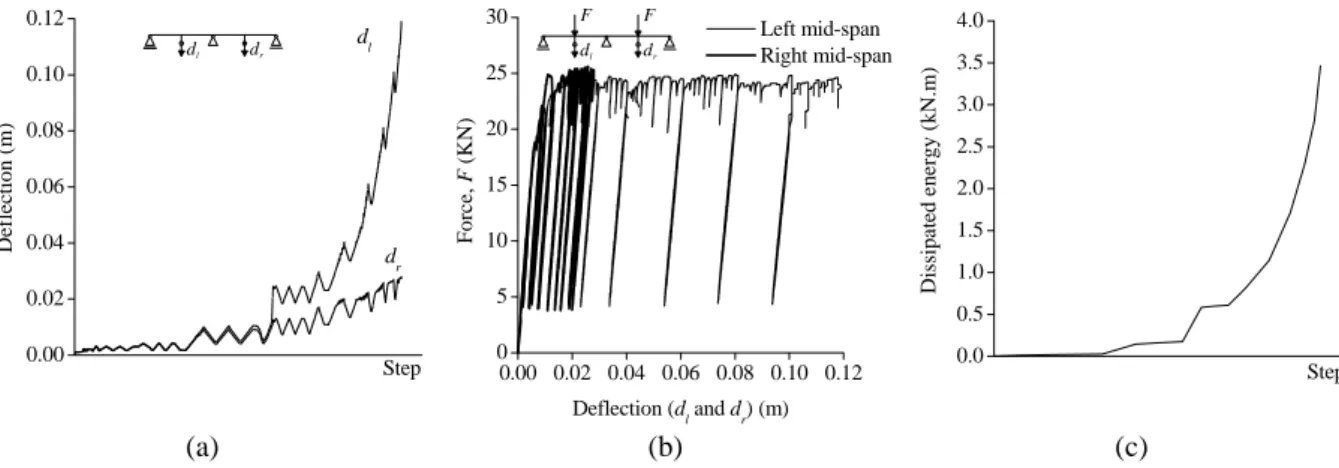
The main experimental results are shown in Fig. 2.4. Fig. 2.4a shows the deflection evolution for the left (dl) and right (dr) spans. The maximum deflection registered for the left and right spans is equal to
0.12 m and 0.03 m (about 25% of the left span deflection), respectively. The force-deflection diagrams plotted for the left and right mid-span sections illustrated in Fig. 2.4b show that the two spans have similar stiffness but a slightly higher resistant capacity is displayed by the right span. The energy dissipation evolution is represented in Fig. 2.4c.
0.00 0.02 0.04 0.06 0.08 0.10 0.12 dl Deflect ion (m) Step dr dl dr 0.00 0.02 0.04 0.06 0.08 0.10 0.12 0 5 10 15 20 25 30 For c e, F (KN) Deflection (dl and dr) (m) Left mid-span Right mid-span F F dl dr 0.0 0.5 1.0 1.5 2.0 2.5 3.0 3.5 4.0 D is si p a te d en erg y (k N .m ) Step (a) (b) (c)
Figure 2.4. Experimental results: a) deflections evolution; b) force-displacement diagrams; c) dissipated energy
evolution
2.2.2. Damage evolution and failure mode
Plastic hinges were developed at the middle support (PH1), left mid-span (PH2) and right mid-span
(PH3) sections, in that order. The hinges location and estimated length (LPH,i) are represented in Fig.
2.5. Cracks were concentrated around the plastic hinges region, reducing the plastic hinges length, and suggesting the occurrence of bar slippage. Flexural failure was suggested by the crack pattern. The shear diagram corresponding to the maximum load registered (25 kN) was computed considering a linear elastic analysis, so that an upper-bound limit for the shear in the beam could be estimated. The maximum shear (equal to 17 kN) is inferior to the beam shear resistance computed according to EC2 (equal to 61.3 kN), confirming that shear failure did not occur. Despite the symmetric loading conditions, the beam response was not strictly symmetric, namely after major damage begun in the left span. This is related to small differences in the geometrical characteristics, support conditions, material properties, etc., implying non-symmetrical distribution of stiffness and strength, which is consistent with the damage concentration on one span.
PH (L = 0.14 m)
left span PH - plastic hinge
L - plastic hinge length
PH,2 2 PH (L = 0.05 m)PH,1 1 PH (L = 0.15 m)PH,3 3 i PH,i right span
Figure 2.5. Plastic hinges location and length
2.3. Numerical model
2.3.1. Modelling strategy
In Fig. 2.6 is illustrated the RC beam numerical model built-up and implemented within the OpenSees platform. The elements lengths correspond to the effective distances between the support points and the plastic hinges lengths correspond to the values measured in the test (Fig. 2.5). The model was built with BeamWithHinges elements, in which plasticity is considered concentrated over specified hinge lengths at the element ends. Zero-length section elements were placed at the plastic hinges sections for simulating bond-slip, by concentrating the slippage mechanism within the plastic hinge region and at its vicinity.
BeamWithHinges Plastic Hinge
Zero-length section element
1.88 1.88 1.88 1.88
[m]
Left span Right span
Confined concrete Unconfined concrete 2φ12 2φ10 2φ12 0.18 m 0 .22 m
Figure 2.7. Model of the RC beam at: a) beam element dimensions, zero-length element; b) fibre modelling at
section level
For each BeamWithHinges element and Zero-length element, the section is idealized through fiber modelling, assigning to each fibre the corresponding material properties and cyclic behaviour rules (for confined or unconfined concrete or longitudinal steel). The average mechanical properties of the S235 steel class were considered. This assumption is supported by the excellent agreement between the numerical and experimental results. The mean concrete compressive strength (19 MPa) obtained from the compression tests was considered. The Steel02 steel model was used for the
BeamWithHinges elements, and to the Zero-length section elements was assigned the Bond_SP01
model for simulating the bond-slip mechanism. The bar stress-slip relationship associated to the bond model was developed for deformed bars (Zhao and Sritharan 2007), therefore some of the model parameters had to be adjusted for the plain reinforcing bars situation. The Concrete01 concrete model was used for the concrete fibres of the Zero-length section elements while Concrete02 was adopted for the BeamWithHinges elements. A bilinear model was adopted for simulating the monotonic tensile behaviour. The model was subjected to the displacement histories recorded during the test (Fig. 2.4a) and not to the imposed loading history, in order to account for the not perfectly symmetric beam response.
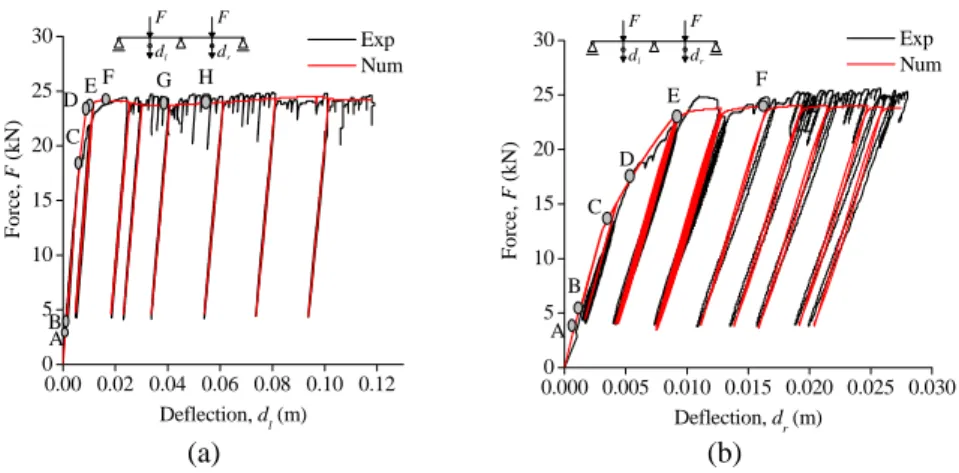
2.3.2. Comparison between the main numerical and experimental results
In general terms, a good match was found between the experimental and numerical results, as shown in Fig. 2.8. To better illustrate the importance of including the bond-slip effects in the numerical model, an additional numerical analysis was developed without considering the slippage mechanism. The corresponding numerical results are also shown in Fig. 2.8. The beam model is also able to well represent the damage evolution. The points corresponding to the beginning of cracking, steel yielding and concrete crushing were determined and are represented in Fig. 2.9. The sequence of events is totally in accordance with the damage evolution observed during the beam test.
0.00 0.02 0.04 0.06 0.08 0.10 0.12 0 5 10 15 20 25 30 Exp Num
Num (without slip
Force , F (k N ) Deflection, dl (m) 0.000 0.005 0.010 0.015 0.020 0.025 0.030 0 5 10 15 20 25 30 Exp Num
Num (without slip)
Fo rce, F (k N ) Deflection, dr (m) 0.0 0.5 1.0 1.5 2.0 2.5 3.0 3.5 4.0 En er g y D issipa te d ( k N .m) Step Exp Num
Num (without slip)
(a) (b) (c)
Figure 2.8. Comparison between the main experimental and numerical results: a) force-displacement diagram
plotted for the left mid-span section; b) force-displacement diagram plotted for the right mid-span section; c) dissipated energy evolution
0.00 0.02 0.04 0.06 0.08 0.10 0.12 0 5 10 15 20 25 30 F o rce, F (kN ) Deflection, dl (m) Exp Num C E G D F H B A F F dl dr (a) 0.000 0.005 0.010 0.015 0.020 0.025 0.0300 5 10 15 20 25 30 E F o rce, F (kN ) Deflection, d r (m) Exp Num A C D B F F F dl dr (b)
Figure 2.8. Damage evolution at: a) left mid-span section; b) right mid-span section
3. CYCLIC TESTS OF BEAM-COLUMN JOINTS
In this section is described the cyclic test of two full-scale RC interior beam-column joints with the same geometry and reinforcement detailing, one built with plain reinforcing bars and the other with deformed bars. Materials properties, test set-up and the main experimental results are presented and discussed.
3.1. Test specimens
The two beam-column joints specimens are representative of typical interior beam-column joints in existing RC structures built until the mid-70’s, without adequate seismic detailing. Both specimens have the same geometry and reinforcement detailing (see Fig. 3.1), but specimen JP was built plain reinforcing bars and specimen JD was built with deformed bars.
COL U M N 0 .30x0 .30 m² BEAM 0.30x0.40 m² 2.15 m 0.30 m 2.15 m 1. 00 m 0. 40 m 1.6 0 m A A' B B' 0.40 m 0.30 m 0 .30 m 4 Ø12 Ø8//0.25 m Ø8//0.20 m 4 Ø12 2 Ø12 0.35 m 0.25 m 0.25 m 4 Ø12 0.25 m 4 Ø12 2 Ø12 BB' AA' Ø8//0.20 m Ø8//0.25 m 0.30 m (a) (b) (c)
Figure 3.1. Joint specimens: a) beam-column structural joint under study; b) geometry and reinforcement
details; c) beam and column cross-sections
Table 3.1 shows the steel mechanical properties obtained from tensile strength test. Based on the results from the compression test of concrete cube samples casted during the construction of the joints, it was estimated for the concrete a mean average compressive strength and characteristic value equal to 23.5 MPa and 19.5 MPa, respectively, corresponding to a concrete class C16/20 according to Eurocode 2 (CEN 2004).
Table 3.1. Steel mechanical properties
Properties Plain bars Deformed bars Yielding strength (MPa) 590 430 Ultimate strength (MPa) 640 550
3.2. Test set-up and imposed lateral displacement history
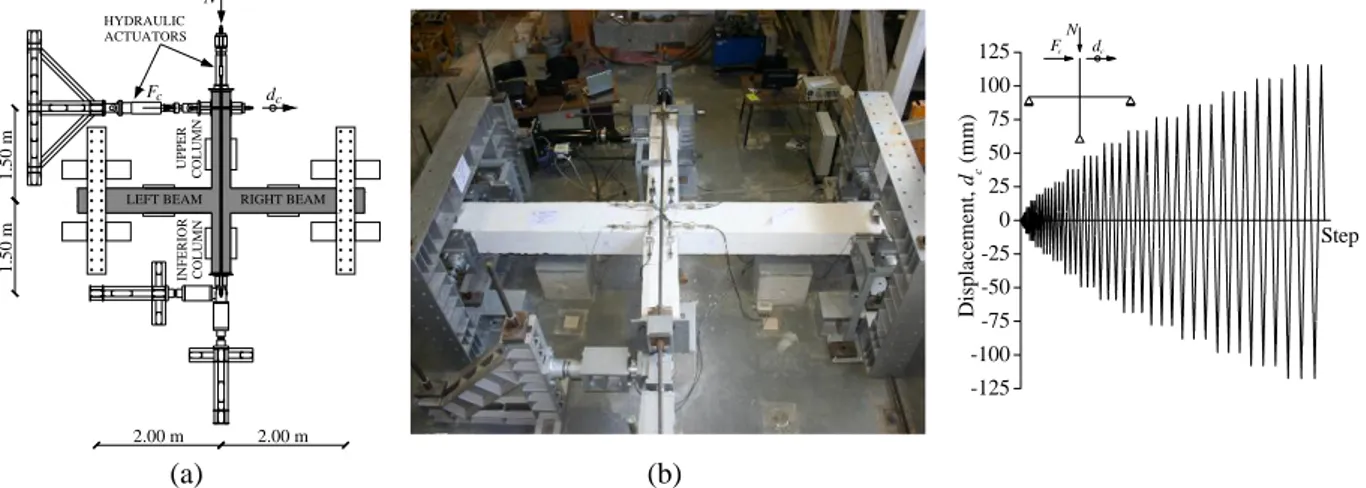
The joint specimens were tested horizontally (Fig. 3.2) and high load-carrying capacity devices with reduced friction were placed bellow the specimens to carry their self-weight. Steel reaction frames associated to sliding devices at beams extremities and to a pinned connection at column base were used to simulate the support conditions. Two hydraulic actuators were arranged at the column top, one to impose the lateral load (Fc) and other for the axial force (N). The test was made under
displacement-controlled conditions and the imposed lateral displacement history (dc) at the top of the column is
represented in Fig 3.3. Linear Variable Displacement Transducers (LVDTs) were used for monitoring the displacement evolution at the top of the column and beam supports, as well as in the beam-column interfaces for locally monitoring the cracks evolution.
N dc 2.00 m 2.00 m 1. 50 m 1. 50 m U PPER COL U M N IN FE RIO R COL U MN Fc
LEFT BEAM RIGHT BEAM
HYDRAULIC ACTUATORS -125 -100 -75 -50 -25 0 25 50 75 100 125 Displ ac em ent, dc (mm) Step N dc Fc (a) (b)
Figure 3.2. Test set-up: a) schematics; b) general view
Figure 3.3. Imposed lateral
displacements history (dc)
3.3. Experimental results
Fig. 3.4 shows the force-displacement diagrams and corresponding peak envelopes, for specimens JP and JD, with identification of the beginning of cracking and concrete spalling in the beam and column. From the analysis of Fig. 3.4, it is possible to concluded that: i) the initial uncracked stiffness is practically equal in both specimens, as expected; ii) after cracking, specimen JP displays smaller stiffness than specimen JD; iii) the maximum strength achieved by specimen JP corresponds to 87% of the maximum strength of specimen JD; iv) specimen JD achieves its maximum strength for a lower drift (2.00%) value than specimen JP (3.30~3.70%); v) at the maximum imposed lateral drift (4%), the force Fc is identical in both specimens.
-125 -100 -75 -50 -25 0 25 50 75 100 125 -40 -30 -20 -10 0 10 20 30 40 For ce, F c (k N ) Displacement, dc (mm) JP JD -4 -3 -2 -1 Drift (%)0 1 2 3 4 N dc Fc (a) -125 -100 -75 -50 -25 0 25 50 75 100 125 -40 -30 -20 -10 0 10 20 30 40 C O O O B B C C B B O O O O O Fo rc e, Fc (kN) Displacement, dc (mm) JP JD -4 -3 -2 -1 0 1 2 3 4 A C A A A O O O O Drift (%) N dc Fc (b)
A – Beginning of cracking at the beams B – Beginning of cracking at the columns C – Beginning of concrete spalling (at the beams for specimen JP and at the columns for specimen JD)
Fig. 3.5 shows the total dissipated energy evolution and the equivalent viscous damping vs. displacement ductility. The damping values presented correspond to average values for each level of displacement. The total energy for specimen JP and JD was 28.3 kN⋅m and 31.4 kN⋅m, respectively. Until an imposed drift of 2% the energy dissipation is similar for both specimens, becoming larger for specimen JD for drift values higher than 2%. The equivalent viscous damping was calculated according to Priestly et al. (2007). Annex B.3 of Eurocode 8 (EC8, CEN 2004) was used for the ductility computation. The fitted curves in Fig. 3.5b show that the equivalent damping tends to increase with the ductility. This tendency is more evident in specimen JD. Considering the fitted curves, the maximum equivalent damping of specimen JD, corresponding to the maximum drift imposed in the test, is 8% larger than for specimen JP and about 2.8 times lower than those referred in Priestley et al. (2007) for concrete frame building structures in general.
0 5 10 15 20 25 30 35 Drift (%) 4 3 2 1 En ergy Dis sipate d (kN.m ) Step JP JD (a) 0 1 2 3 4 5 6 0 1 2 3 4 5 6 7 8 ξ eq,JP = 0.92ln(μΔ) + 4.95 Eq ui valent Damping, ξeq (% ) Displacement Ductility, μΔ JP JD ξ eq,JD = 2.00ln(μΔ) + 3.63 (b)
Figure 3.5. Energy diagrams: a) total dissipated energy evolution; b) equivalent damping vs. displacement
ductility 3.4. Damage observed
The crack patterns observed at the top face of both specimens are illustrated in Fig. 3.6. In specimen JP, cracks and concrete cover spalling are concentrated at the beam-joint and column-joint interfaces, without significant damage at the joint core. In specimen JD, cracking began at the beam-joint and column-joint interfaces, spreading afterwards to the beam and column spans. Cracking and concrete cover spalling were observed at the joint core of specimen JD. The quotient between the plastic hinge length (Lh) and the corresponding section depth (h) are approximately 0.25h and 0.90h for specimens
JP and JD, respectively. The plastic hinges length was derived directly from the visual damage inspections, being the length of the region where damage was observed.
CO LU M N BEAM (a) CO LU M N BEAM (b)
The quotient between the plastic hinge length (Lh) and the corresponding section depth (h) are
approximately 0.25h and 0.90h for specimens JP and JD, respectively. The plastic hinges length derived directly from the visual damage inspections, being the length of the region where damage was observed.
4. FINAL COMMENTS
The experiments and numerical analysis reported on the present paper evidence the high influence of the bond-slip mechanism on the cyclic behaviour and performance of RC elements with plain reinforcing bars. The experimental results will contribute to upgrade and calibrate numerical models for the proper simulation of the cyclic behaviour of existing RC building structures built with plain reinforcing bars.
AKCNOWLEDGEMENT
This paper reports research developed under financial support provided by “FCT - Fundação para a Ciência e Tecnologia”, Portugal, namely through the PhD grants of the first and second authors, with references SFRH/BD/27406/2006 and SFRH/BD/62110/2009, respectively. Authors would like to acknowledge the following companies: (i) CIVILRIA, for the construction of the test specimens; ii) SOMAGUE, GRUPO MENESES, SILVA TAVARES & BASTOS ALMEIDA, PAVIÚTIL and ARLINDO CORREIA & FILHOS, for the construction of the structural reaction systems. Authors would like to acknowledge: i) Santa Joana Museum, for giving access to the building where the beam specimen was collected; ii) A. Costa, A. Figueiredo, E. Neto, H. Pereira and R. Vicente, for their collaboration in the tests preparation and execution.
REFERENCES
CEN (2004a). Eurocode 2: Design of concrete structures - Part 1-1: General rules and rules for buildings, EN 1992-1-1:2004, European Committee for Standardization, Brussels, Belgium.
CEN (2004b). Eurocode 8: Design of structures for earthquake resistance – Part 1: General rules, seismic actions and rules for buildings, EN 1998-1:2004, European Committee for Standardization, Brussels.
Kwak, H.-G. and Kim, J.-K. (2006). Implementation of bond-slip effects in the analyses of RC frames under cyclic loads using layered section method. Engineering Structures 28:12, 1715-1727.
Liu, A. and Park, R. (2001). Seismic behaviour and retrofit of pre-1970’s as-built exterior beam-column joints reinforced by plain round bars. Bulletin of the New Zealand Society for Earthquake Engineering 34:1, 68-81.
Manfredi, G. and Pecce, M. (1998). A refined R.C. beam element including bond-slip relationship for the analysis of continuous beams. Computers and Structures 69:1, 53-62.
Marefat, M.S., Shirazi, S.M.H., Rostamshirazi, R. and Khanmohammadi, M. (2009). Cyclic response of concrete beams reinforced by plain bars. Journal of Earthquake Engineering 13:4, 463-481.
OpenSees - Open System for Earthquake Engineering Simulation (OpenSees): available online at http://opensees.berkeley.edu/.
Pampanim, S., Calvi, G.M. and Moratti, M. (2000). Seismic behaviour of RC beam-column joints designed for gravity loads. 12th European Conference on Earthquake Engineering. Paper No. 726.
Pinto, A.V., Varum, H. and Molina, J. (2002). Experimental assessment and retrofit of full-scale models of existing RC frames. 12th European Conference on Earthquake Engineering. Paper No. 855.
Priestley, M., Calvi,G. and Kowalsky, M. (2007). Displacement-Based Seismic Design of Structures, IUSS PRESS, Pavia, Italy
Varum, H. (2003). Seismic Assessment, Strengthening and Repair of Existing Buildings, PhD Thesis, University of Aveiro, Portugal.
Verderame, G.M., Fabbrocino, G. and Manfredi, G. (2008). Seismic response of R.C. columns with smooth reinforcement. Part II: Cyclic tests. Engineering Structures 30:9, 2289-2300.
Youssef, M. and Ghobarah, A. (1999). Strength Deterioration due to Bond Slip and Concrete Crushing in Modeling of Reinforced Concrete Members. ACI Structural Journal 96:6, 956-966.
Zhao, J. and Sritharan, S. (2007). Modelling of strain penetration effects in fibre-based analysis of reinforced concrete structures. ACI Structural Journal 104:2, 133-141.