2018
UNIVERSIDADE DE LISBOA FACULDADE DE CIÊNCIAS DEPARTAMENTO DE INFORMÁTICA
Threat Detection in SIEM Considering Risk Assessment
Ana Mafalda Silva Osório
Mestrado em Engenharia Informática
Sistemas de Informação
Dissertação orientada por:
Profª. Doutora Ana Luísa do Carmo Correia Respício Engenheiro Pedro da Silva Dias Rodrigues
Acknowledgments
During the development of this work, I relied on the direct or indirect support of multiple people to which I am deeply grateful. My thank you to the DiSIEM project for financing this dissertation.
I would first like to thank my advisers, Prof. Doc. Ana Luísa do Carmo Correia Respício and Engineer Pedro Dias Rodrigues for accepting me for the development of this thesis. All your guidance, availability, support and encouragement in the crucial moments of this journey was indispensable and extremely valuable, either in the growth of the present project, whether in my growth as a person.
I would also like to thank the Security Operation Center experts from EDP. All your help was essential for this thesis development and without it, none of this would have been possible. I would like to give a special thanks to Ricardo Martins, Ivo Rosa, Gonçalo Martins, João Alves and Vanessa Gomes. Thank you very much for your ideas, your availability, all your patience, your jokes and all the laughs we shared in the SOC room. I am also very grateful for all my friends who accompanied me throughout this academic, and non-academic journey, and with who I shared unforgettable moments. A special thank you to my girls, Margarida Duarte, Anita Santos, Beatriz Riquito, Sara Loureiro and Lúcia Rodrigues. Thank you for all your encouragement on the development of this work, for our random conversations, and especially for all your help and advice throughout the years.
To my not so little brother the biggest thanks of them all. Thank you for your daily rant about life, for sending me a message every day we were apart and thank you for the understanding always manifested despite the lack of attention and absences. After 16 years, you are still the best gift I ever received.
Finally, I am very grateful to my family, especially to my parents for the encouragement received along these years as well as the economic support, to Gonçalo Lima for always believing in me and for all the patience, and to my grandparents for their company and for all our Sunday lunches throughout these five years.
This work is supported by the European Commission through the H2020 programme under grant agreement 700692 (DiSIEM).
Dedicated to my parents and my brother
i
ii
Resumo
Nos dias de hoje, a segurança informática é cada vez mais um assunto fundamental. Os sistemas informáticos são indispensáveis para o funcionamento das organizações e um dos seus maiores problemas é que estão sujeitos a ficar comprometidos, podendo assim afetar o desempenho e a reputação de toda a organização. As ameaças contra a segurança e a confiabilidade de infraestruturas críticas, nomeadamente redes elétricas, podem resultar em ocorrências fatais para a normal atividade tanto das organizações como da sociedade. Um ciberataque a uma infraestrutura crítica pode afetar a vida de milhares de pessoas, visto que pode ser fruto de um ataque terrorista.
Desta forma, as empresas têm investido em processos de gestão de risco de segurança de informação. Estes processos tornam possível proteger os diversos ativos, monitorizar os serviços, processos e projetos, de forma a conseguir reduzir tanto quanto possível a perda de tempo, esforço e custos com a recuperação de incidentes de segurança.
A gestão de risco tem como objetivo minimizar ou até mesmo eliminar o impacto negativo que os riscos possam ter numa determinada organização. O processo de gestão de risco é habitualmente composto por cinco etapas interligadas entre si: a comunicação e consulta, que ocorre ao longo de todas as etapas deve ser feita em conjunto com as partes interessadas e que deve abordar questões relativas ao risco, tais como as suas causas, consequências e medidas que devem ser usadas para tratar o risco; o estabelecimento de contexto, onde são definidos os critérios utilizados durante o processo de gestão de risco; o processo de avaliação de risco, constituído por fases de identificação, análise e avaliação do risco; o tratamento do risco, onde são selecionadas medidas que podem ser aplicadas com o objetivo de reduzir o risco anteriormente identificado; e por último a etapa de monitorização e revisão de risco, que garante que todo o processo de gestão de risco funciona corretamente, assegurando que as medidas aplicadas são as mais corretas, obtendo mais informações para melhoria do risco, detetando mudanças no contexto e identificando riscos emergentes. No final de todo este processo a organização conseguirá obter o conhecimento do risco a que está sujeita, podendo assim ter um processo de tomada de decisões ajustado às suas necessidades.
Uma das tecnologias mais usadas pelas empresas para realizar a monitorização de eventos de cibersegurança são os sistemas de gestão e correlação de eventos Security
iii
informação proveniente de várias fontes. Depois de recolhidos os dados, como os mesmos são provenientes de diversas fontes, são todos colocados na mesma estrutura, ou seja, são normalizados. Depois de normalizados, através da utilização de filtros e regras para a deteção de padrões de comportamentos maliciosos, é feita a deteção de possíveis anomalias nos sistemas da organização e são gerados alertas. Cabe à equipa responsável pela gestão dos incidentes de cibersegurança analisar e reagir a estes alertas gerados pelo SIEM. Atualmente estes sistemas têm algumas limitações, nomeadamente não conseguem comunicar o risco de uma forma simples e eficaz para os gestores das organizações. Assim, é necessário adicionar a esta tecnologia outros indicadores relevantes, com o objetivo de melhorar a eficiência das equipas de segurança.
Os processos de gestão de risco são, regra geral, básicos e não contemplam caraterísticas inatas das infraestruturas, tais como as dependências e diferenças entre os tipos de ativos monitorizados.
O projeto DiSIEM propõe colmatar este problema, através do desenvolvimento de extensões que são instaladas como componentes externas e integradas com os SIEM. No âmbito do projeto já foi desenvolvido um modelo e uma ferramenta, no entanto a ferramenta desenvolvida não foi integrada num ambiente real. A ferramenta consistia num modelo multinível para apreciação de risco, de forma a que fosse possível transmitir uma noção de risco às partes interessadas, utilizando as informações provenientes do SIEM. Esta ferramenta tal como este trabalho, foram desenvolvidos no contexto do projeto DiSIEM através de uma colaboração entre a Faculdade de Ciências da Universidade de Lisboa e a EDP - Energias de Portugal, SA.
O modelo desenvolvido faz uma apreciação de risco em três níveis diferentes: máquinas, aplicações e serviços. Esta apreciação é realizada com base em três versões diferentes do modelo, sendo sempre consideradas três componentes para o cálculo do risco: vulnerabilidades, dependências e incidentes.
Assim, o propósito deste trabalho consistiu em tornar a ferramenta operacional num ambiente empresarial, fazer novos desenvolvimentos na mesma e integrá-la com o SIEM existente na EDP, o Micro Focus ArcSight. Isto irá permitir aumentar a capacidade de comunicação de risco aos gestores da organização por parte das equipas de segurança; auxiliar o processo de tomada de decisão; e atribuir uma maior ou menor relevância aos eventos detetados pelo SIEM, devido à monitorização mais eficaz considerando os resultados da avaliação de risco.
A ferramenta conta com várias informações recolhidas no universo EDP, nomeadamente os ativos, as vulnerabilidades e os incidentes da empresa.
A informação acerca dos ativos foi obtida através de uma extração à base de dados da organização que, dada a grande escala e diversidade de operação, tem uma quantidade
iv
de ativos muito grande, na ordem dos milhares. No processo de identificação dos ativos da empresa foram identificadas algumas incoerências nos dados, o que levou à necessidade de cruzar as informações recolhidas com outras fontes de informação do universo EDP.
As vulnerabilidades são obtidas através da junção de informação de duas fontes diferentes: uma empresa responsável por realizar pen-testing e uma fonte adicional de dados, um detetor de vulnerabilidades de infraestrutura, o Nessus Vulnerability Scanner. Este software é responsável por detetar as vulnerabilidades existentes nas infraestruturas da EDP e, apesar de o mesmo já estar presente no universo EDP antes do desenvolvimento desta ferramenta, as vulnerabilidades detetadas não eram ainda tidas em conta pela equipa de segurança. Ao integrarmos as vulnerabilidades detetadas pelo Nessus com todas as detetadas através de pen-testing e já existentes no nosso modelo, conseguimos assim avaliar o risco de forma mais rigorosa por termos em conta todas as vulnerabilidades conhecidas no ambiente EDP.
Os incidentes tanto podem ser detetados por utilizadores ou podem surgir da monitorização de eventos por parte da equipa do SOC. Porém, os incidentes que se encontram incluídos na base de dados são apenas os provenientes do SIEM em uso na EDP.
Todos os dados recolhidos, depois de uniformizados e estruturados, são então importados para uma base de dados global, através de um módulo feito para esse propósito. Esta base de dados foi contruída com o objetivo de aglomerar todas as informações recolhidas e a mesma encontra-se adaptada ao ambiente EDP.
Depois de os dados estarem na base de dados, é possível aplicar o processo de avaliação de risco para cada um dos ativos identificados. Dado que o processo tem em conta as dependências entre ativos, inicia-se com o cálculo do risco ao nível das máquinas, passando depois ao nível das aplicações e por fim para o nível dos serviços.
Todos os dados relevantes são depois apresentados num dashboard que providencia capacidade para fazer risk analytics. Isto é, é possível analisar detalhadamente as componentes associadas ao risco de cada ativo. Este dashboard possibilita também que haja uma interação direta com a base de dados na interface, permitindo que as vulnerabilidades e os incidentes abertos possam ser fechados, permitindo inclusive que haja a inserção de novas vulnerabilidades ou incidentes pela equipa de cibersegurança. É ainda possível gerar relatórios pdf com os valores de risco para um determinado período de tempo, de forma a que seja possível auxiliar os decisores nas tomadas de decisão. Todas estas funcionalidades foram melhorias ao dashboard desenvolvido na etapa anterior do projeto.
v
A ferramenta encontra-se ainda interligada com o SIEM, o que forneceu à equipa de cibersegurança a possibilidade de priorizar os eventos que são detetados pelo SIEM. Esta priorização é feita com base nos resultados do cálculo do risco e permite que a equipa possa analisar e dar prioridade aos ativos que têm um maior nível de risco. Os dados relativos ao risco são importados para o SIEM através de um connector que realiza uma
query à base de dados. Esta query faz uma ordenação dos ativos pelo valor do risco,
permitindo assim ao SIEM considerar os ativos que têm um valor de risco não aceitável e, como tal, que devem ter especial atenção por parte da equipa de cibersegurança.
No final deste trabalho são ainda apresentados os resultados preliminares obtidos pela integração da ferramenta no universo EDP.
Palavras-chave: Avaliação de Risco, Gestão de Risco, SIEM.
vi
Abstract
Nowadays, security information is fundamental, as computer systems are indispensable to the functioning of organisations and one of their biggest problems is that they may be compromised, which can affect the performance and reputation of the organisations. Therefore, companies invested in risk management processes to monitor their services, processes, and projects, allowing them to avoid cybersecurity incidents.
One of the most used tools to monitor and detect security anomalies is the security information and event management system (SIEM). These systems support a team responsible for managing cybersecurity incidents to analyse and react to the alarms generated by the SIEM. However, these systems are expensive and have limitations, especially while assessing security risk in a simple and effective way.
The DiSIEM project aims to address this problem by developing a new model to assess risk hierarchically. A model and a framework have been developed however it was necessary to integrate it in a real environment.
This work consists in integrating the developed framework in the EDP environment so that it is possible to assess risk and communicate a notion of risk between IT managers and C-Level managers. The framework uses information coming from the SIEM and adds the results of the risk assessment it.
Our model has a risk assessment process based on assessing the vulnerabilities, incidents, and dependencies of the assets identified in the organisation. After the risk assessment process, all the relevant data are imported to the SIEM through a connector, so that the cybersecurity team can prioritize events. This will allow to improve the effectiveness of SIEM threat detection considering assets’ risk.
This dissertation is part of the H2020 DiSIEM project and results from a collaboration between Faculdade de Ciências da Universidade de Lisboa and EDP - Energias de Portugal, SA.
vii
viii
Contents
Chapter 1 Introduction ... 1 1.1 Motivation ... 1 1.2 Objectives ... 2 1.3 Contributions ... 31.4 Structure of the Document ... 3
Chapter 2 Context ... 5
2.1 EDP – Energias de Portugal ... 5
2.2 SIEM ... 7
2.3 Nessus Professional Vulnerability Scanner ... 9
Chapter 3 State of the Art ... 11
3.1 Security Risk Management Standards ... 11
3.2 Literature Review ... 14
3.2.1 Risk Dependencies and Risk Propagation ... 14
3.2.2 Risk Assessment in the DiSIEM project ... 19
Chapter 4 The Risk Assessment Model in DiSIEM ... 23
4.1 Structure of the Model ... 23
4.2 Risk Evaluation ... 25 4.2.1 Vulnerabilities Variable ... 26 4.2.2 Dependencies Variable ... 31 4.2.3 Incidents Variable ... 31 Chapter 5 Implementation... 35 5.1 Architecture ... 35 5.2 Database Structure ... 37
5.3 Identification of Assets and Dependencies ... 42
5.4 Identification of Incidents ... 43
5.5 Identification of Vulnerabilities... 43
ix
5.5.2 Infrastructure Vulnerabilities ... 44
5.6 Dashboard ... 45
5.7 SIEM Integration ... 50
Chapter 6 Evaluation of the Preliminary Component Integration ... 53
6.1 Description of the Experiment ... 53
6.2 Evaluation of the New Functionalities ... 55
6.3 Evaluation of the Integration with SIEM ... 56
Chapter 7 Conclusion and Future Work ... 59
References ... 63
Appendix A – Risk Assessment Model Parameters ... 65
x
List of Figures
Figure 2.1 – EDP Dashboard ... 6
Figure 2.2 – ArcSight Architecture at EDP, extracted from [1] ... 8
Figure 3.1 – Risk Management Process adapted from ISO 27005 ... 13
Figure 3.2 – Risk Propagaton in a supply chain network ... 16
Figure 4.1 – Bottom-up approach ... 24
Figure 4.2 – Example of the three-layer structure in EDP’s environment ... 25
Figure 4.3 – Risk score of Asset 1 ... 34
Figure 5.1 – Risk Assessment tool architecture ... 36
Figure 5.2 – Model’s Database ... 38
Figure 5.3 – Parameters table ... 41
Figure 5.4 – Asset identification process ... 42
Figure 5.5 – Nessus scan data flow ... 44
Figure 5.6 – Global Risk page ... 46
Figure 5.7 – Functionality to add a vulnerability ... 47
Figure 5.8 – Applications supporting Service 14 ... 48
Figure 5.9 – Services page ... 48
Figure 5.10 – Applications page with button to close vulnerabilities ... 49
Figure 5.11 – SIEM Integration ... 51
Figure 6.1 – Example of the query results ... 57
Figure 0.1 – Applications page ... 67
Figure 0.2 – Hosts page ... 67
Figure 0.3 - Page to add an incident ... 68
Figure 0.4 – Parameters page ... 68
Figure 0.5 – Report generation page ... 69
Figure 0.6 – Report result ... 69
xi
xii
List of Tables
Table 1 - Risk categories used by EDP ... 7
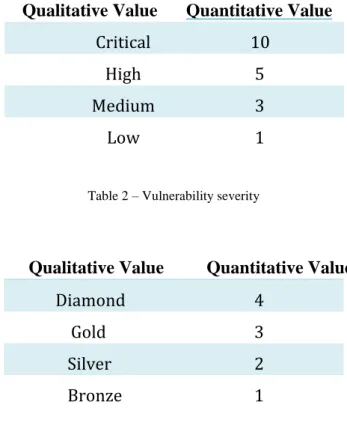
Table 2 – Vulnerability severity ... 29
Table 3 – Business value of assets ... 29
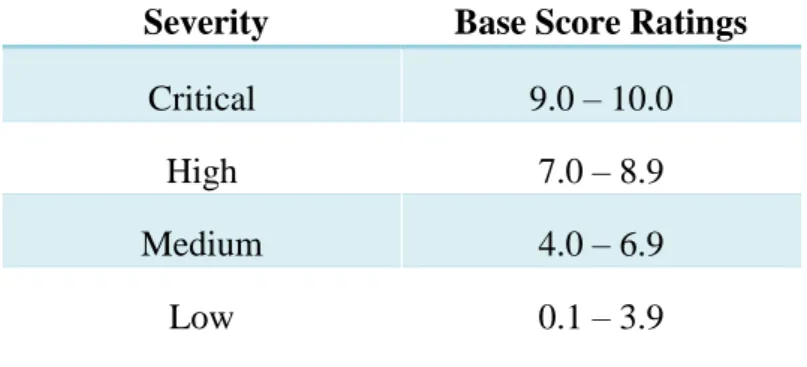
Table 4 – CVSS 3.0 Ratings ... 30
Table 5 – Properties for classifying incidents according to ArcSight ... 32
Table 6 – Vulnerabilities opening time in minutes while using the document and the dashboard ... 55
Table 7 – Vulnerabilities closing time in minutes while using the document and the dashboard ... 56
xiii
1
Chapter 1
Introduction
1.1 Motivation
These days, more than ever, companies are concerned with the cybersecurity of their environments. This concern is not only driven by legal issues, but also by the increase of large scale successful cyber-attacks and the influence that the impact of a successful attack, intrusion or illicit access can have on the company's own image and business. The effectiveness of cybersecurity critically depends on the technical and human resources available to support it, and cybersecurity is as much an issue of management as it is a technical issue.
Security risk, if not properly managed, can lead to the complete collapse of an organisation. Organisations are exposed to multiple risks, and if those risks are not identified and treated as part of the risk management process, the organisation might have a poor performance. Therefore, security risk management is a vital process that needs to be executed to maintain a productive IT infrastructure.
To identify and monitor a vast number of cybersecurity events, organisations have Security Operations Centers (SOC) that rely on Security Information and Event Management (SIEM) platforms. The SIEM systems produce detailed and contextualized alarms for possible real-time risks the organisation may have to face and help the SOC team to make security-related decisions.
Nowadays, SIEM systems are a fundamental tool in modern SOC, but current SIEM systems have many limitations on the methods and means used to store data and report information. By integrating the SIEM with other security technologies, this solution can be used as a single pane of glass for the threats and possible breaches that the organisation is facing. Since SIEM systems do not provide an adequate security risk assessment [1], there’s a gap between the SOC team and the business managers, regarding communication of security risk.
2
One of the objectives of the EU project DiSIEM is to bridge this gap by conceiving and implementing a SIEM extension to assess risk hierarchically. In this context, a framework has been developed.
This work results from a collaboration between Faculdade de Ciências da Universidade de Lisboa and EDP - Energias de Portugal, SA.
EDP is the most important Portuguese company in the energy sector, and to manage the security of its infrastructures, EDP has a Security Operation Center (SOC) that deals with security-related issues.
This work addresses the limitations of an already existing framework for assessing risk in three decision levels [2], services, applications and hosts, aiming to enhance it by embedding it in a real environment like the EDP SOC, and integrating it with the SIEM used by this organisation, the Micro Focus ArcSight. This framework will also consider a new source of information, the Nessus Professional Vulnerability Scanner [3], which is a software already used and operational at EDP.
1.2 Objectives
Considering the aspects referred to in the previous section, the main objective of this work is to enhance the effectiveness of SIEM systems considering the results of risk assessment. With this, we had the objective of adapt and enhance the implementation of an existing risk assessment framework to:
• Contemplate supplementary input sources, the Nessus Professional Vulnerability Scanner [3];
• Integrate the developed component with the SIEM in use at EDP environment, using the risk assessment results to improve risk mitigation; • Enhance the reporting mechanisms to communicate risk at different
management levels.
3
1.3 Contributions
This work offers three main contributions:
i. An integrated framework to assess risk that can be used in the daily basis of an organisation;
ii. Enhanced reports to support decision making at the C-Levels; iii. The possibility of risk analytics to know the source of the risk.
As a result of this work, the EDP SIEM now includes the results of risk assessment in their SOC operation. This allows EDP to have a better knowledge regarding the security of its assets since due to the risk assessment process it is now possible to know the risk value associated with each asset. By integrating the results obtained from the risk assessment with SIEM, the SOC team now benefits from the ability to prioritize events that occur in assets with a risk greater than a specific value. In addition to this, EDP also benefits from an improvement in the risk communication process to the top managers, due to the implementation of a dashboard to present the results obtained and due to the possibility of generating pdf reports with the historical values of risk.
This work is based on a database that is integrated with the organisation asset model, as well as diverse sources of information, including the SIEM. This database stores the collected assets, vulnerabilities and incidents and, after the risk assessment process has been completed, links the results obtained in the risk assessment process with the SIEM helping the SOC team in the prioritization of the detected events. The connection with the SIEM is bi-directional since it relies on the information coming from it (regarding incidents and vulnerabilities) and it also feeds it with new information.
As a result of the contributions of this work, the document “Multi-Level Risk Demonstrator” was written to guide DiSIEM partners while installing and using the developed framework.
1.4 Structure of the Document
This document is organized as follows.Chapter 2 introduces the context of this work. This chapter is divided into three topics: EDP, SIEM and Nessus Vulnerability Scanner. In the first topic we approach the EDP’s business and its SOC team; next, we give a little introduction to SIEMs, specifically the Micro Focus ArcSight since it is the one used in EDP; and lastly, we introduce the Nessus Vulnerability Scanner which is the new input source that is used to detect infrastructure vulnerabilities in EDP.
4
Chapter 3, State of the Art, introduces the security risk management standards and then reviews and discusses current publications and research around the risk analysis and SIEM topics.
Chapter 4, The Risk Assessment Model in DiSIEM, is the chapter where we describe the model upon which this work is based on. We also explain the issues existent in the current model and how it is improved by our development.
Chapter 5, Implementation, gives a global vision of the developed solution. It describes the current framework architecture with all its improvements: it contemplates the developed database used to store all the data and the process used to get the information that populates the database, and it describes the dashboard used to display all the information stored, as well as the SIEM integration.
Chapter 6, Evaluation of the Preliminary Component Integration, presents and discusses the results obtained by the implementation of the framework.
The document ends in Chapter 7 which contains the main conclusions of this work and future developments.
5
Chapter 2
Context
This work is part of the Diversity in Security Information and Event Management (DiSIEM) [4] project and results from a collaboration between Faculdade de Ciências da Universidade de Lisboa (FCUL) and EDP - Energias de Portugal, S.A., which are two of the partners in the consortium. This project is funded by the European Commission and aims to improve existing SIEM systems with several mechanisms.
The DiSIEM project has four main objectives [4]: • Improve the quality of the collected events; • Add support for collecting information;
• Create new methods for visualising the information; • Allow the use of cloud services for secure event storage.
Since the SIEM tools are expensive, all these improvements have been done as an extension to some of the systems currently available, allowing companies to make better judgment calls without spending a lot of money in additional plugins.
2.1 EDP – Energias de Portugal
EDP was founded in 1976, with the merge of 13 companies in the Portuguese electricity sector. Since then, the EDP Group has not stopped growing and evolving, becoming a multinational company, ranking among Europe’s major electricity operators, as well as being one of Portugal’s largest non-financial business groups [5].
To monitor and manage the security of its infrastructures, EDP has a Security Operation Center (SOC) that deals with security-related issues. The SOC team is responsible for the detection, collection, analysis, and reaction to cybersecurity events in real-time, using a combination of technology components and a set of defined processes. The SOC team also conducts awareness campaigns and security training sessions for the company employees through the use of case studies that happened in the past.
The existence of a SOC allows organisations to improve the security incident detection through 24/7 monitoring and analysis of security events, which provides an advantage to defend against incidents and intrusions, consequently reducing security risk.
6
EDP’s SOC obtains an integrated view of the monitored infrastructure by employing an ArcSight SIEM system from Micro Focus [6]. All the information about real-time events is constantly being updated and presented in a dashboard, fed by the SIEM, with several security metrics and visualization options. The SOC uses security metrics to analyse the tasks and the results obtained in each month and, to inform the C-level managers about the security status of the organisation, periodic reports are produced with relevant information for the current month and providing a baseline comparison with previous months.
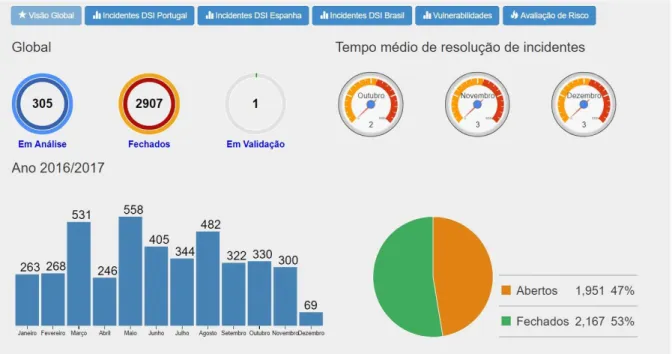
Figure 2.1 shows the dashboard currently used at EDP. This dashboard presents security metrics related to the number of incidents and the number of vulnerabilities detected, as well as the average response time of the SOC team. A history of the last 12 months is also available, which allows the team to understand the evolution of the efforts made to solve the incidents and vulnerabilities detected. Since EDP is an international company, the dashboard also contains a graphic representation of the incidents in Brazil and Spain. Finally, the dashboard includes a module for risk assessment.
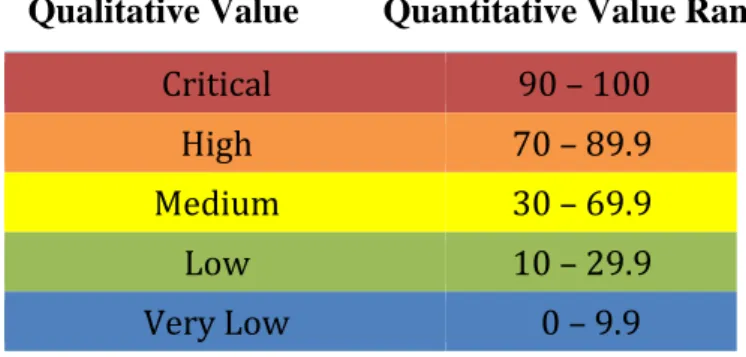
To classify the risks EDP is exposed to, the organisation uses the risk categories displayed in Table 1. These categories, along with its associated colour, were the ones used to classify the risks discovered throughout this work.
7
Qualitative Value Quantitative Value Range
Critical 90 – 100
High 70 – 89.9
Medium 30 – 69.9
Low 10 – 29.9
Very Low 0 – 9.9
Table 1 - Risk categories used by EDP
2.2 SIEM
A Security Information and Event Management system, or SIEM, has the general purpose to aggregate and manage event log data, allowing companies to monitor security events in real time, but they also have the means to search historical data. This provides more efficient and convenient analysis capabilities, making it easier to detect incidents and respond to them in a timely manner. The use of SIEMs in an organisation is one of the best practices in information security [7].
SIEMs can collect, normalize, filter, aggregate, correlate, and visualize the logs received from the technological components adopted by the organisation.
Firstly, the SIEM makes a collection of all the events obtained from the technological components. These data are obtained through various connectors that interact with the SIEM and retrieve data from the source where they are installed. Secondly, all the data must be normalized so that a common pattern between all types of data is established and, after the normalization phase, a filtration is needed in order to exclude all the unnecessary data. After the filtering phase, it is necessary to aggregate and correlate the data, so that it is possible to identify the most common and relevant events, in order to generate alerts. Lastly, the visualization allows the SOC to have an understandable view of the global cyber context being monitored, ranging from detailed technical data to high-level metrics. The SOC uses the processed information to engage key stakeholders, including C-Level managers, helping their decision-making process.
State-of-the-art SIEM systems present relevant technological advances, but this tool still has some limitations [8]:
• The threat intelligence capability is still very recent and limited; • The data visualization techniques have low quality;
• It is difficult to extract high-level information from all the correlated data; • The event correlation capacities of the SIEM depend on the quality of the
8
• Historical events are difficult to retain for a long duration.
Apart from that, the adoption and implementation of a SIEM by an organisation is expensive.
The DiSIEM project aims to improve the technology available today through the extension of current systems, using their capacity for extension and personalization.
SIEM systems are marketed in a variety of forms and the functionalities offered by the different manufacturers diverge. Therefore, it is up to each organisation to make its own evaluation and decide which SIEM system is the best fit and the most suitable for their needs.
The Micro Focus ArcSight is the SIEM used by the EDP SOC team. The ArcSight SIEM architecture is divided into three main components: Connectors, Loggers and Enterprise Security Management (ESM) (Figure 2.2).
The connectors are software components that collect events from each connected device, normalize the data to a common standard format, apply filtering and aggregation rules and then send the processed data to the Logger and ESM components. EDP uses two types of connectors: the SmartConnector and the FlexConnector. The
SmartConnector is the more standard connector since it does not require any adaptation
and it is developed by ArcSight. The FlexConnector is adaptable to the organisation’s needs but requires high implementation effort. This type of connector is the only option to gather and parse information from legacy systems or from custom applications.
9
The Logger component consolidates and stores all the events fetched by the connectors, and it also allows normalization and analysis of the events. A web interface is supplied with the purpose of helping the SOC team analysing the data collected. At EDP, the Logger processes about 3000 events per second.
The Enterprise Security Management (ESM) is a software component that correlates the data coming from the connectors and the loggers. It provides an interface where the SOC team can monitor the current security threats, offering visualization of alerts. This interface helps the team dealing with all the collected data, allowing them to monitor and analyse the events or the alerts generated.
2.3 Nessus Professional Vulnerability Scanner
A vulnerability scanner is used for the automated identification and detection of vulnerabilities in a company’s IT infrastructure, which may have misconfigured assets or even flawed software. The scanner digs through the organisation infrastructure and looks for open ports, outdated software or default passwords. The scanner uses a list of known vulnerabilities, already known by the security community, hackers, and the software vendors.
The Nessus Professional Vulnerability Scanner software [3] is the product most used and recommended for the vulnerability scanning process. This software provides asset coverage for the widest variety of network devices. Like the vulnerability scanners existent in the market, Nessus scans for viruses, malware, backdoor hosts and malicious processes to identify vulnerabilities. This software covers more technologies comparatively with other software in the market which allows it to have a detection rate higher than other solutions. It also provides a high-speed scanning with low false positives which allows the companies to quickly identify the vulnerabilities that need fixing first. The results of the scan are reported in the XML format, but the software also provides a dashboard to consult the scanned data, although this dashboard is not used by EDP.
Although Nessus is already operational in the EDP environment, the results from the scans were not used or included in the operation of the SOC team. The infrastructure vulnerabilities detected by the software, when added to the other vulnerabilities detected in EDP, are important for a better understanding of the risk of certain assets. An asset that previously had no risk, with the inclusion of this new tool, can see its risk changed if it has infrastructural vulnerabilities.
10
11
Chapter 3
State of the Art
We begin this chapter by introducing the security risk management standards. Nowadays, the use of these standards by organisations has become usual since they aim to guide organisations in how to deal with risks.
Then we review scientific literature related to hierarchical models that deal with dependencies between assets and related to risk propagation. At the end of the Literature Review section, we also introduce the previously developed model that was improved and integrated as result of this work.
3.1 Security Risk Management Standards
Risk is part of everything organisations do nowadays. Thus, security risk management is an essential process for the proper function of organisations because it allows them to identify potential risks in advance, taking precautionary steps to reduce them.
Security risk management is a cyclic process that focuses on discovering and assessing the risks inside an organisation and determining how those risks can be controlled or mitigated. Its main purpose is to identify the information assets of an organisation and their vulnerabilities, as well as to rank them according to the need for protection. Risk management plays a critical role in protecting an organisation’s information assets, and therefore its mission.
Information security risk management standards have been established by the National Institute of Standards and Technology (NIST) [9] and the International Organisation for Standardization (ISO) [10] with the purpose of helping organisations to implement an effective information security risk management program, allowing them to reduce risk.
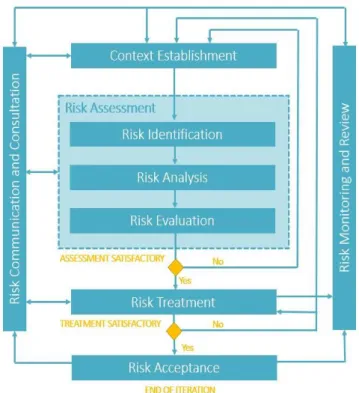
The ISO/IEC 27005:2011 - Information Security Risk Management [11] is the ISO standard that provides guidelines for information security risk management process. Figure 3.1 displays the process recommended by the standard.
This standard divides the process into six phases. The first one is the context establishment phase, where the purpose of the information security risk management is
12
determined. In this phase, the organisation should be able to define the internal and external context for risk management, specify the basic criteria and the scope and boundaries for the information security risk management process.
In the basic criteria definition phase, four criteria are defined: risk management approach, risk evaluation, impact, and risk acceptance. The risk management approach depends on the scope and objectives of the risk management and it is the phase where the decisions regarding the risk management approach are made. The risk evaluation criteria are used to evaluate the organisation’s information security risk based on the value of the business processes, the criticality of the assets, legal requirements, operational and business importance of availability, confidentiality, integrity and the expectations from the stakeholders. The impact criteria are used to specify the degree of damage or costs to the organisation caused by a security event. The risk acceptance criteria depend on the organisation’s policies and objectives but consist of the definition of risk acceptance rules for the company.
The risk assessment process is the second phase, where the identification, analysis, and evaluation of the risks are made.
The risk treatment is the third phase and consists in selecting the controls that should be applied to make a modification, retention, avoidance or sharing of the risk.
The fourth phase is the risk acceptance, where based on the risk acceptance criteria defined in the context establishment phase, a list of accepted risks should be made, with justification for those that do not meet the criteria defined. An acceptable risk is a risk that is understood and tolerated usually because the cost or difficulty of implementing an effective countermeasure exceeds the expectation of loss.
Risk Assessment is a process that analyses what can go wrong, how likely it is to happen, what are the consequences if it happens and how tolerable the identified risk is. It assigns a risk rating to each specific information asset of a company and allows the organisation to measure relative risk, which enables one to compare ratings later in the risk control process.
The risk assessment process is divided into three phases following the ISO 27005: risk identification, risk analysis, and risk evaluation (Figure 3.1). The risk identification phase has the purpose to identify what could cause a potential loss to the organisation and it should include all the risks, including the ones that are not under the control of the organisation. Managers must do a process of “self-examination” to identify the organisation assets. An asset classification scheme to categorize the assets should be developed, and it should be based on the sensitivity and security needs of the assets. After the identification of all the assets, an identification of all the threats and their sources
13
should be made, as well as an identification of the vulnerabilities that can be exploited by the threats and cause harm to the assets identified, followed by an identification of the controls already implemented by the organisation. Lastly, an identification of the possible consequences of the exploitation of a vulnerability should also be assessed. This phase leads to identifying the weaknesses and threats that the organisation is subjected to.
The risk analysis phase is where each identified risk is classified. There are three types of risk analysis methodology: qualitative, quantitative or a combination of these. The qualitative risk assessment is usually used first to obtain an indication of the level of risk and to reveal major risks. It uses a scale of qualifying attributes (e.g., Low, Medium, High) and its advantage is that this approach makes the analysis simpler and more understandable, but it also has the disadvantage that the analysis becomes more imprecise. The quantitative risk assessment uses a numeric scale to determine risk (e.g., 0,2,4,6,8,10). The quality of the assessment depends on the accuracy of the values used in the analysis, which means that even though the analysis becomes more precise, it also becomes more complex. The combination of these two types of analysis, the semiquantitative method, uses a scale in which each qualitative value corresponds to one single quantitative value. After the classification of the identified risks, an assessment of consequences, an assessment of incidents likelihood and a level of risk determination are also made.
Risk evaluation is the last phase of the risk assessment process and it relates the results of the risk analysis process with the criteria and risk acceptance defined in the
14
context establishment phase. Decisions made in the risk evaluation phase should include whether an activity should be undertaken and the priorities for risk treatment considering estimated levels of risks.
The ISO/IEC 31000:2009 – Risk Management [12], is a standard created by ISO and IEC that provides some guidelines for general risk management in an organisation and for dealing with processes. There are 11 principles that allow the risk management process to be more effective for the organisations:
• It must create value for the organisation;
• It is an integral part of all organisational processes; • It is part of decision making;
• Explicitly addresses uncertainty;
• It is a systematic, structured and timely process; • It is based on the best available information;
• It is tailored to the organisation that is being applied; • Takes human and cultural factors into account; • It is transparent and inclusive;
• It must be dynamic, iterative and responsive to change; • It facilitates the continual improvement of the organisation. These principles were used throughout the development of this work.
3.2 Literature Review
Our literature review focuses mainly on works considering hierarchical relationships between assets, taking into account the dependencies between them and the spread of risk throughout the hierarchy. We also introduce a previous work developed for the DiSIEM project in collaboration with EDP.
3.2.1 Risk Dependencies and Risk Propagation
In [13] a management methodology to address risk dependencies is proposed. This methodology has procedures to estimate each identified risk by taking account of risk dependency effects and enhances a set of risk management practices to manage the estimated risk. A risk dependency refers to an effect due to the occurrence of a risk and this effect can either increase or decrease the probability of occurrence of another risk(s). Risk dependencies can be detected by examining each pair of risks within a project or across other concurrent projects in an organisation and determining whether there is any dependency relationship between them.
15
The paper proposes three approximation methods to compute the combined risk dependency effect: the conservative method, that picks the highest value from among all the risk dependency values; the optimistic method, that picks the smallest value among all of the risk dependency values and minimizes the dependency effect to a risk or maximizes the dependency effect to an opportunity; and the weighted method that assigns a relative weighted value to each of the dependencies in order to calculate the combined dependency effect.
It is also defined a Risk Dependency Graph (RDG) in which nodes represent risks and edges represent the dependency between risks. From RDG, several useful metrics are defined for evaluating the extent of dependencies among identified risks. The first two metrics, the total number of Direct Successors (NDS) and the total number of Direct Predecessors (NDP), measure the dependency for a specific risk, while the other two metrics, the Total Risk Dependency Count (TRDC) and the Risk Dependency Index (RDI), measure dependency at the project level.
The risk dependency concept was applied to three case studies, which were managed by three different project teams within the organisation. These three projects aimed to enhance three independent systems that involved complicated system environments, and all three projects adopted the same common practices of risk identification and management. The case studies allowed to confirm that dependencies between risks do exist, especially if the risks were identified by different groups of stakeholders. The enhanced and new risk management practices for evaluating, prioritizing, and responding to risk and risk dependencies, as well as the designated metrics, showed valuable and supportive results.
Although the methodology had some benefits it also had some limitations, namely the fact that it does not consider opportunities that occur in IT projects; the process of identifying dependencies needs to be improved so that it can be applied to a larger amount of dependencies; and a management tool to simplify tracking and evaluating risks and risk dependencies is also needed.
A cascading failure model of risk propagation is described in [14]. This paper analyses the robustness of an assembly supply chain network (ASCN) when it suffers from catastrophe events, and its goal is to quantify the robustness index (RI) of ASCN against disruption, to provide a scientific basis for network protection. The robustness index measurement is based on production capacity loss, i.e., the quantity of product that can be delivered to customers after the risk propagates in the network.
An ASCN is composed of manufacturers located in different regions, therefore, the effects of risk are transferred to other organisations, affecting their supply chain partners indirectly. Every entity in a supply chain network faces risk, so the goal is to secure the
16
uninterrupted flow of materials. A supply chain network is formed by entities that represent network nodes. These nodes are connected by links, and those links can propagate risk, especially when one of the nodes of the network fails. Figure 3.2Figure 3.2 shows the process of risk propagation in a supply chain network.
The innovations of studying the cascading failure of ASCN are the risk propagation mode and the RI of ASCN. By applying the cascading failure theory, the paper describes the concept of risk propagation in an ASCN, constructs a cascading failure model to represent the process of risk propagation, and uses different disruption scenarios to assess the robustness of ASCN.
An approach to quantitatively measure the risk of interdependence is presented in [15]. This paper constructs a model for selecting risk response strategies considering expected risk loss and risk interdependencies. As stated before, project risks are not always independent so, this leads to the need to consider risk interdependences as a part of risk analysis. These interdependencies are very important since they define the complexity of the projects, and with complexity comes the issues in decision-making about prioritization of risks. If the risk interdependences are correctly analysed, the project managers will be able to take more effective risk response decisions.
The paper provides a way to measure risk interdependence using a discrete random variable with a probability distribution, which allows the strength of risk interdependence to be measured by the comparison of random variables. Further, an optimization model for selecting risk response strategies considering the interdependences is constructed. The model was applied to a substation during an engineering project of renovation to solve the problems of risk response strategy selection, considering the risk interdependence, costs of implementing strategies and risk response strategy selection. Critical risks were identified by experts involved in the case study, expected losses were estimated and each expert gave evaluations on the interdependent relationships between the risks. A risk network based on the analysis of the strength of risk interdependence was built and based
17
on the analysis of the risk events and the interdependences, the expert panel discussed and proposed risk response strategies.
To select risk response strategies and further investigate the effects of the risk interdependence, an integer programming model was constructed. This model considers the expected risk loss, risk interdependence, and their two directions by defining a weighting function. The results obtained after applying the model to a case study shows the necessity of considering risk interdependence in risk response analysis in pursuit of organisational benefits maximization.
The limitation of this paper is that the impact of the risk interdependence needs to be studied with greater depth and the paper conclusions lack verification. In addition, the author stated that more empirical field work is needed to study the risks and their interdependences.
A Service Dependency Framework (SDF) to assist the response process in selecting the policy enforcement points (PEPs) capable of applying a dynamic response rule is described in [16]. The uniqueness of this framework resides in its capacity to define dependency attributes, instead of assigning static dependency parameters as in most of the current models. The SDF specifies dependencies by modelling the data exchanged in each dependency, the paths followed by these data, the sequencing of dependencies during the operation of the dependent service and the impact due to the unfulfillment of each dependency. There are three dependency characteristics: dependency type, that defines the path of the network flow, and describes the data assets exchanged between the dependent and the antecedent service; dependency mode, that makes precise the occurrence of a dependency within the lifecycle and workflow of the dependent service; and dependency impact that evaluates the influence of the insatisfaction of the relation between antecedent and dependent services. A dependency type may be either service-side, user-side or proxy dependency. This paper demonstrates that service dependencies can be used for more than only a-posteriori evaluation of intrusion response impacts after these have been selected. It describes an apriori use of service dependencies, notably for the selection of suitable means to apply an intrusion response. One of the limitations of this work is that the treatment of responses is separated from the dependencies search.
In [17], a model for email malware propagation is reviewed. This paper aims to explore the impact of connection topologies along with the distribution of user action malware, amongst a population of computers and its associated users. It also explores the impact these factors have when patching or blocking interventions are applied to the population.
The model designates hosts to be in one of three compartments or states: Susceptible (S), Infected (I), or Removed/Recovered (R). User interaction is usually required for
18
email malware to spread, thus each node in the model has an associated human user. An important user aspect included in the model is the probability that a user will open an infected message. For modelling purposes, each user has an assigned probability threshold value for opening an infected message.
The model was applied to three email malware incident types and for the model types tested and the range of parameter values explored, model types using an exponential based distribution of user likelihood of opening infected messages produced a higher percentage of best-fit values. This shows that by using exponential based distributions of user likelihoods in models, this may provide a better estimation of the distribution compared to using random uniform distributions. Despite the obtained results, this model can be improved by expanding the types of distribution used to model the probability of users to open infected messages and exploring accuracy and robustness of model selection and parameter inference.
A framework for attack modelling and security evaluation in SIEM systems is proposed in [18]. This framework considers attack modelling security evaluation processes, intended to be implemented for the security analysis in SIEM systems. The implemented prototype of the Attack Modelling and Security Evaluation Component (AMSEC) can generate an attack tree and calculate security metrics for a predefined network. After constructing the attack graph, the AMSEC provides the malefactor knowledge after all possible attacks, the attack tree in the graphic form and the log of the malefactor’s actions.
In [19] a risk assessment methodology for information systems security with the application of Group Decision Making (GDM) and Analytic Hierarchy Process (AHP) methods is proposed. The proposed methodology is designed in four main sections:
(1) Identifying key assets, threats, and vulnerabilities;
(2) Data gathering of ai , tij, vik, where ai (i = 1,2,…, m) is the value of an asset,
tij (j = 1,2,…,m) represents the threat tj to the asset ai and vjk represents the danger degree
of vulnerability kin the asset ai;
(3) Calculating risk value Rijk and prioritizing risk incidents, where Rijk is the
risk value of asset ai caused by threat tj due to the vulnerability k.
The GAHP (GDM and AHP) model proposed in this paper was tested and, according to the test case, the priority of risk incidents was obtained. The proposed assessment methodology provides information from each unique risk incidents respective to the whole system view, which can better support the risk management activity compared with the original methods.
19
The issues identified with this framework are the need to develop techniques that can cope with large networks and the generation of attack trees must also be optimized to expand the list of parameters, characterizing the hosts and the network, to improve the malefactor model, and to add currently unrealized components.
3.2.2 Risk Assessment in the DiSIEM project
In previous work, a multi-level risk assessment tool model to support the EDP SOC team making decisions and communicating with the organisation top managers was developed [2].
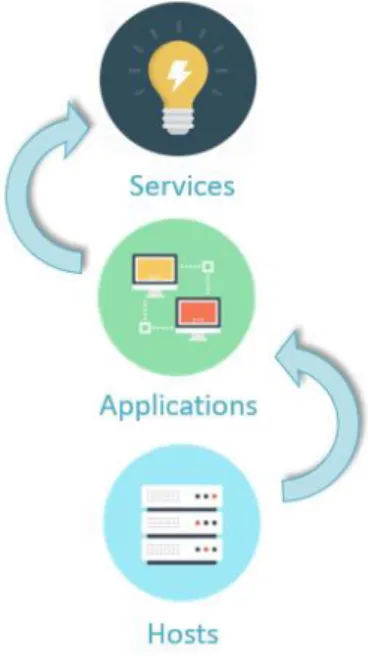
This model considers three layers of assets, it is based on three levels of decision making and it has three main objectives: calculate assets risk, supply information, and support the decision-making process. The three layers of assets considered in this model are Hosts, Applications, and Services, where the services’ layer is an abstract representation of the actions or functions supported by applications, and these applications are supported by hosts. The approach to assessing risk is bottom-up, which means that to be able to assess the risk of a service, it is required to assess all the applications that support it and the hosts that support the applications.
The model also considers three different models to assess risk: Generic Additive (GA), Modified Additive (MA) and Maximum Score (MS). The GA model adds all the vulnerabilities, dependencies, or incidents scores and it is compared with the risk appetite that the organisation considers for each variable. The MA model takes into account the impact that might exist when different levels of relevance for different factors are given. The MS model is the simplest since it assesses the risk by considering only the highest scores in terms of vulnerabilities, dependencies, and incidents.
The model also calculates risk for each asset of the organisation identified. This risk is calculated through three components: vulnerabilities, dependencies, and incidents. The dependencies variable is very important because it allows to consider the existence of two types of risk: imported risk (the risk that is inherited from other assets due to the dependency on them) and intrinsic risk (the risk of the asset itself). The assessment of the risk was based on numerically scoring the variables and was not based on a probabilistic model since there is some difficulty to determine the probability of a vulnerability to be exploited.
A quantitative approach was adopted in this model since this type of risk analysis methodology allows a better recognition of serious situations. The risk score value is comprehended in an interval established in advance: zero is the minimum score value and the maximum is a predefined value, set by the organisation.
20
In order to match EDP’s needs, a dashboard to display all the results of the model was created. This dashboard shows the global risk of the company through a graph that presents the evolution of the last twelve months; has a page for each one of the layers described above and has also the capability to create a pdf report for the selected assets with its calculated risk.
In [20] we find a review of the risk assessment process previously used by the SIEM solutions adopted by the DiSIEM project.
The Micro Focus ArcSight uses a threat level prioritization process for each one of the events detected in order to detect the threats with the highest priority that target an organisation. The threat level formula process gives an indication to determine if an event should be investigated and is applied to every single event ingested into the ArcSight.
The priority formula is based on four distinct parameters: Relevance, Model Confidence, Severity, and Criticality. All these priority factor values fall within a range of 0 to 10, where 0 is low and 10 is a high-risk factor.
The Relevance factor depends on whether an event is relevant to an asset based on if the event contains ports and/or known vulnerabilities and its maximum value is 10. The Model Confidence variable is about the level of information available about the asset under assessment. The Severity factor works as a history function since it evaluates if the system has been attacked or compromised before and it is calculated through the parameter Severity Level. This parameter depends on five factors: Recognition, Suspicious, Compromised, Hostile and Infiltrators. Finally, the Asset Criticality factor concerns about the importance of the asset in the context of the organisation as it is defined in its network modelling process.
This document also presents a model to assess multi-level security risk. This model is a consolidation of the three models proposed in [2]. The model is divided hierarchically into three levels of decision making but it considers only one type of formulas to make the risk assessment process.
3.2.3 Discussion
As identified in the works presented in the previous sections, there is still no ideal way to assess risk while considering dependencies between assets. The existing works in the literature present some gaps, namely difficulties while identifying dependencies, lack of verification and evaluation of the results, and apart from that, there is also a lack of integration in a real environment. Although a model has already been conceptualized to aid in the risk management process of organisations in [2], it has not yet been integrated or tested in a real environment. Integrating the model within an organisational
21
environment is essential to prove its functionality and usefulness. There is also the necessity to integrate the model with the SIEM, given that this is one of the main objectives of the DiSIEM project.
23
Chapter 4
The Risk Assessment Model in DiSIEM
As stated in the Introduction, a model for multi-level risk assessment was already developed and implemented in the EDP context.
The main objective of this model was to help the SOC team making decisions as well as to facilitate the communication between the SOC team and the organisation top managers. By the possibility of assessing the amount of risk in the three different layers and the implementation in EDP environment, this objective should have been achieved. Although this framework had been developed in the EDP context it had some flaws and was not integrated within the EDP environment, so there is a necessity to adapt it to meet the needs of the company. Even though the proposed framework is mainly focused around assets and organises them to allow the SOC to know which asset has the highest value in each one of the layers, it needed some improvement regarding reporting and risk communication mechanisms. Furthermore, there was no connection between the framework and the SIEM, which was essential for EDP.
With this starting point, our main objective was to integrate the framework in EDP environment and with the SIEM. This framework update should also make it easier for the SOC team to identify the applications that need special care, contributing to an improved security status of the organisation.
This chapter presents the general concepts of the model. We begin by introducing the structure of the model and then we explain all the formulas used in the risk calculation process.
4.1 Structure of the Model
The structure of the model presented in [2] is divided into three layers of decision making. The model divides the assets of the organisation into three types: services, applications, and hosts. It also considers dependencies between assets and the risk spreading between them.
As displayed in Figure 4.1, a bottom-up approach is used to assess risk, which means that to be able to know the risk of a service, it is required to first assess the risk of applications and hosts that support it.
24
The hosts layer works as the most operational layer of the decision-making process as it regards mostly technical or infrastructure details.
The middle layer, corresponding to the applications layer, is very similar to the previously mentioned one but there is an abstraction of the IT technical details and infrastructure. This allows us to start focusing on the business side.
The services layer improves the communication between security managers and C-Level managers. The C-C-Level managers set the company’s strategy by making higher-stakes decisions, which means that they are more concerned with business instead of the technical issues. The risk assessment at the services level allows the C-Level managers to make their decisions based on the business-related information.
Although the model is organized in a three-layer structure it provides a risk score for each asset present in each layer, which provides the ability to determine which assets must be treated first, creating better and more efficient management process for the organisation.
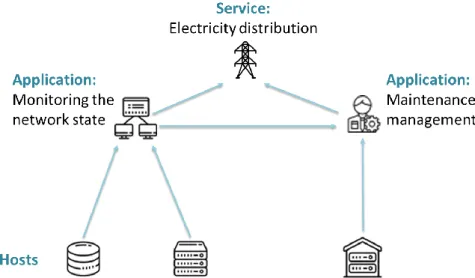
An example of the three-layer structure in the specific environment of EDP is given in Figure 4.2. The hosts level corresponds to a set of physical assets, which means that these hosts can be servers, virtual machines, routers, switches or others. The applications level is where we find the assets that support the organisation. These assets are responsible for monitoring the network state and for maintenance management. Lastly, the services level is supported by the applications and hosts and this level is responsible for a business function, such as the country’s electricity distribution service provided by the company.
25
For the model to work as expected, it is necessary to identify all the existing assets in the organisation. After identifying the assets, it is also necessary to identify the dependencies between them. While applications are supported by hosts and can depend on other applications, services typically work as a set of applications and do not have dependencies between them.
It is relevant to mention that this model considers two types of risk: the intrinsic risk which is relative to the asset itself, and the imported risk that is the risk inherited from all the dependencies. It is only after all the assets and dependencies are identified that the company's risk assessment process begins.
The multi-level risk scoring is made for each asset previously identified and it considers three elements: vulnerabilities, dependencies, and incidents.
4.2 Risk Evaluation
All the formulas present in this document are the ones in [20], with the exception of Equation (2). This formula was added to the risk calculation process to make it more complete and so that it considers historical data regarding the vulnerabilities variable.
The DiSIEM project adopts a quantitative approach to evaluate risk which allows a better differentiation of critical situations that occur in the assets under evaluation.
The risk of a generic asset j is calculated by the weighted sum of three components: the vulnerabilities variable, the dependencies variable, and the incidents variable. The risk score formula is present in Equation (1).
26
𝑅𝑖𝑠𝑘𝑆𝑐𝑜𝑟𝑒𝑗 = 𝑊𝑒𝑖𝑔ℎ𝑡𝑒𝑑𝑆𝑢𝑚(𝑉𝑉𝑗, 𝐷𝑉𝑗, 𝐼𝑉𝑗) (1)
Where,
• 𝑉𝑉𝑗 is the vulnerability variable score for the asset j,
• 𝐷𝑉𝑗 is the dependencies variable score for the asset j,
• 𝐼𝑉𝑗 is the incidents variable score for the asset j.
The risk score value of all the assessments is comprehended in a specific interval defined by the organisation, being 0 the minimum score and the maximum score is the value predefined e.g. 100. The function 𝑊𝑒𝑖𝑔ℎ𝑡𝑒𝑑𝑆𝑢𝑚 indicates that each one of the variables has a specific weight attribute.
In a Service, the assessment only considers the dependencies variable score since a Service does not have vulnerabilities or incidents because usually, a service works as a set of applications. Otherwise, all the variables are considered.
4.2.1 Vulnerabilities Variable
The vulnerabilities variable represents the risk associated with the vulnerabilities present in the asset. This variable, represented by Equation (2), is obtained through the score of the vulnerabilities occurred in the present month and the history score of the past three months.
𝑉𝑉𝑗 = 𝑊𝑒𝑖𝑔ℎ𝑡𝑒𝑑𝑆𝑢𝑚 (𝐶𝑢𝑟𝑟𝑒𝑛𝑡𝑀𝑜𝑛𝑡ℎ𝑆𝑐𝑜𝑟𝑒𝑗, 𝑃𝑟𝑒𝑣𝑖𝑜𝑢𝑠𝑀𝑜𝑛𝑡ℎ𝑆𝑐𝑜𝑟𝑒𝑗) (2)
This equation is not present in [20] since it is one of the improvements made to the model. It allows the risk assessment process to consider historic data regarding the vulnerabilities that affected the organisation in previous months. This allows the organisation to understand if the asset is susceptible to vulnerabilities since the asset may have few vulnerabilities in the current month but may have had many vulnerabilities in the previous ones, which indicates that the SOC team should be giving greater attention to this specific asset.
The equation used to assess the 𝐶𝑢𝑟𝑟𝑒𝑛𝑡𝑀𝑜𝑛𝑡ℎ𝑆𝑐𝑜𝑟𝑒 variable has into account the highest scored vulnerability and the sum of the score of all the other vulnerabilities present in the asset. This is based in the use of weights, so that the company can decide which variable values most, if the highest scored vulnerability, or the sum of all the others. It allows the users to focus only on the most severe vulnerability by setting the weight of
![Figure 2.2 – ArcSight Architecture at EDP, extracted from [1]](https://thumb-eu.123doks.com/thumbv2/123dok_br/15623339.1055224/26.892.175.732.724.1028/figure-arcsight-architecture-edp-extracted.webp)
![Figure 3.2 – Risk Propagaton in a supply chain network, extracted from [14]](https://thumb-eu.123doks.com/thumbv2/123dok_br/15623339.1055224/34.892.268.626.392.557/figure-risk-propagaton-supply-chain-network-extracted.webp)