Contents lists available atScienceDirect
International Journal of Disaster Risk Reduction
journal homepage:www.elsevier.com/locate/ijdrrThe contribution of historical information to
flood risk management in the
Tagus estuary
Ana Rilo
a,d,⁎, Alexandre Tavares
b, Paula Freire
a, Pedro Pinto Santos
c, José Luis Zêzere
daLNEC - National Civil Engineering Laboratory, Estuarine and Coastal Zones Unit, Avenida do Brasil 101, 1700-066 Lisbon, Portugal bCentre for Social Studies and Earth Sciences Department, Coimbra University, Rua Sílvio Lima, Pólo II UC, 3030-790 Coimbra, Portugal cCentre for Social Studies, Coimbra University, 3000-995 Coimbra, Portugal
dCentre of Geographical Studies, Institute of Geography and Spatial Planning, Universidade de Lisboa, Edifício IGOT, Rua Branca Edmée Marques, 1600-276 Lisboa,
Portugal
A R T I C L E I N F O
Keywords: Database Flood impacts Risk Public policiesA B S T R A C T
Estuarine areas are often affected by flood episodes with significant infrastructural and human damages caused by the overlap of different triggering factors. Currently flood risk management practices are subject to increased scrutiny by the public and relevant stakeholders requiring rigorous justification by flood risk managers and careful validation of the technical options and human andfinancial resources allocated to the management practice. Therefore,flood risk diagnosis through historical sources might constitute an important and effective first approach to public policies validation.
In this paper is presented an estuarineflood damage database based on historical information and discussed as to the extent these types of sources can contribute to improve estuarineflood risk management in the Tagus estuary (Portugal). The paper discusses the methodologicalfindings and limitations and highlights the usefulness of historical information integrating the results into the International Risk Governance Council (IRGC) risk management framework.
1. Introduction
Low lying areas and estuarine margins are often highly populated and have been subject to high risk of flooding, as demonstrated by recent events such as Hurricane Katrina in New Orleans in 2005[49,65] or the storm Xynthia on the French coast in 2010 [15,52], causing significant human loss [48], direct and indirect economic impacts across sectors[53,64].
The complexity offlooding process in these areas is related to the overlap of different factors (e.g. high tides, fluvial discharge, storm surge events, wind) that contribute to flood hazard. Moreover, pre-cipitation and urban drainage systems in urbanized margins also in-fluence flood hazard[20,58,75]. The actual trend of urban expansion together with expected climate change effects that might bring a pos-sible increase in sea level pose new challenges in estuarineflood risk assessment[69].
The importance of historical information registered in newspapers, technical reports, photographs and other published material has been highlighted from a geomorphologic point of view (e.g.[79,95]) to a more applied perspective[21,85]and plays an important role to better
understand flood extent, damages and losses giving a valuable per-spective of historical evolution about these hazardous processes.
Historical information is often organized in data bases in order to assure consistency, assist queries and analysis and maintain a record track. There is a worldwide multiplicity of disaster databases that use different inclusion criteria. In terms of global databases, the EM-DAT from the Center of Research on Epidemiology of Disasters[26]is the most well-known but NatCatService from MunichRe [67] or De-sInventar databases[55]can also be mentioned. Concerning national databases other examples can be cited such as the Italian AVI project [39], the Spanish Catalonian [56]or the Swiss flood and landslide damage database collected and maintained by the Swiss Federal Re-search Institute[42]. More recently a database of coastalflooding in the United Kingdom from 1915 to 2016 was presented[40]integrating a variety of historical sources to document the consequences offlood events around the coastal UK.
In Portugal, until 2010, the information on hydro-geomorphologic disasters at the national level was scarce. However, the work of Quaresma and Zêzere [76]that built a national database of hydro-geomorphologic disasters based on newspaper records for the period of
http://dx.doi.org/10.1016/j.ijdrr.2017.07.008
Received 30 March 2017; Received in revised form 22 July 2017; Accepted 23 July 2017
⁎Corresponding author at: LNEC - National Civil Engineering Laboratory, Estuarine and Coastal Zones Unit, Avenida do Brasil 101, 1700-066 Lisbon, Portugal.
E-mail addresses:[email protected],[email protected](A. Rilo),[email protected](A. Tavares),[email protected](P. Freire),[email protected](P.P. Santos), [email protected](J.L. Zêzere).
Available online 25 July 2017
2212-4209/ © 2017 Elsevier Ltd. All rights reserved.
1970–2006, is significant. In 2010 a national research project called DISASTER (http://riskam.ul.pt/disaster/) collected and built in a WebGIS environment an exhaustive national database of hydro-geo-morphologic disasters based on national and regional newspaper re-ports for the period 1865–2010, providing an extensive and valuable contribution to the long–term knowledge of this kind of natural disaster [104]becoming a reference database in Portugal.
The usefulness offlood damage information based on newspapers and historical records rely on the fact that these kinds of sources fre-quently cover more occurrences and events since they can provide news coverage on a local scale[84]. In addition, one can frequentlyfind the same occurrence described in different newspaper sources which can contribute to a more refined and detailed description of the registered damages. Moreover, this kind of source usually covers a wide period of time and presents a continuous record, assuring consistency on the sources[55,85]and is relatively easy to access at a low-cost. For in-stance the UK Natural Hazards Partnership (http://www. naturalhazardspartnership.org.uk) collected, analyzed and scored im-pacts for eleven flood events case studies used to validate a hazard model, with information extracted from UK newspapers[27].
The information extracted from those sources is diverse and varies from quantitative information as to human loss (deaths, injuries, missing or displaced people) to the number of effected houses or in-frastructure and geographic location, to more qualitative information such as the type of damage (ranging from direct economic losses to indirect losses like traffic interruption and disruption of functions). It is also common to find information regarding the weather/triggering conditions although it may be less precise[104,83].
The richness of this information associated with the widely covered period of the sources allows analysis from a social perception of risk [57]and risk governance strategies [92]as well as extraction of in-formation on severity and probability offlood events, providing valu-able information for risk management.
Risk management models articulate process analysis, risk assess-ment and judgassess-ment of territorial impacts, along with the impleassess-menta- implementa-tion of mitigaimplementa-tion and decision acimplementa-tions[103,9]. There is an increasing need for a comprehensive and strategic view of mitigation processes and actions, as well as for the institutional settings and decision me-chanisms[50,73]. As Van Asselt and Renn[98]and Renn and Klinke [81] pointed out, the aim is to improve decision-making processes based on social dimensions and institutional capacity, framed by rou-tine/linearity, complexity, uncertainty and ambiguity. In particular, this allows for the dimensioning of institutional andfinancial resources for the decision-making process, as well as the assessment of available technical and human resources[87,99]. The design of risk response or mitigation measures, the definition of the level of monitoring, together with the knowledge of the costs and benefits associated with each op-tion contributes to improving systems’ responsiveness based on a pre-cautionary approach [9], as well as supporting organizations in re-source sharing, local involvement and effectiveness of adaptation measures[18].
Risk matrices are a tool used to manage risk built on the intersection of probability and damage. They can be drawn up from database ana-lysis and are a widely used instrument in risk management, present in different national and international standards and guidelines (e.g. [80,5,47]). They are semi-quantitative tools, belonging to probability vs. consequence diagrams that prioritize risk and present it graphically in order to provide a simplified version of complex concepts to a wider audience [1]. Nevertheless, it is worth mentioning the debate on the advantages and disadvantages of risk matrices with some authors ar-guing for a more careful use of this instrument [19,23]. Despite the ongoing debate, this tool is widely used from corporate governance to natural hazards management playing an important role in the risk management process, especially for risk information purposes[63].
Flood risk management[51]is a continuous and developing process usually conducted by public authorities that involves a decision making
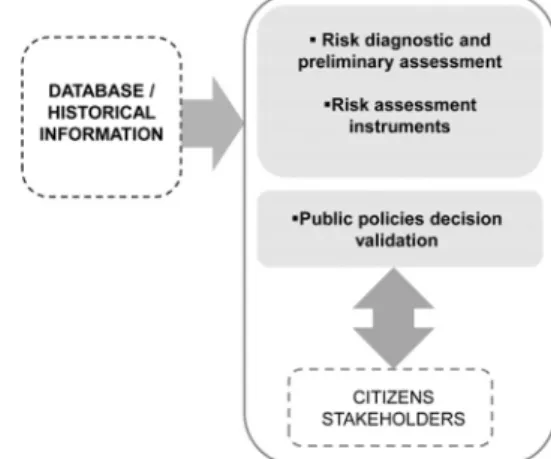
process with options’ identification, assessment and implementation measures along with feedback from theflood risk management practice, including risk communication[101,25], local knowledge[86]and re-silience[10]. Currently, citizen and stakeholder scrutiny is growing and becoming more important having a huge influence on the way in-stitutions communicate with the public [17,88]. On the other hand, flood risk managers need to justify and validate options concerning flood risk public policy, including institutional means and human, fi-nancial and technical resources allocated to flood risk management practice[89]. Thus, historical information, namely long-term database records are an important starting point forflood risk management di-agnosis, allowing risk assessment through risk matrices and being an effective first approach to public policies validation (Fig. 1)
The present work uses a database of historical records (based on a systematic collection of printed newspapers) as a starting point to present an innovative contribution to improve estuarine flood risk management. This is implemented through the definition of impact profiles based on information collected in the above mentioned data-base and the integration of those profiles into the IRGC risk manage-ment framework.
Overall, this paper aims to discuss to what extent the analysis of historical sources can contribute toflood risk management in the Tagus estuary (Portugal). To address this objective two conceptual questions were formulated: (1) is it relevant to know the spatial and temporal evolution of past estuarine flood occurrences? (2) Is historical in-formation able to inform impact profile definition that can be in-tegrated into a risk management framework?
The paper was structured as follows:first, the overall database ex-ploration is presented, including the spatial and temporal evolution of estuarineflood occurrences, the main triggering factors found in the historical sources and the temporal and spatial characterization of da-mages associated with past estuarinefloods. The temporal distribution offlood occurrences allowed the definition of three time periods; each was analyzed and the human losses typology distribution is presented. Second two different tools for risk management were applied: risk matrices (two different standards were used) along with the definition of impact profiles based on cluster analysis of the damage data. Finally the hypotheses are discussed and analyzed as to what extent historical information can contribute to improve flood risk management, in-serting the results into the IRGC risk management escalator.
1.1. Study area
1.1.1. Geophysical context of the Tagus estuary
The Tagus estuary is located in the western part of the Iberian Atlantic coast (Fig. 2a) which extends from the Strait of Gibraltar, in the south, to the Spanish-French border in the north. According to For-tunato et al.[32], on the Iberian Atlantic coast, tides are semi-diurnal
and storm surges increase from south to north. Furthermore, the wes-tern and northern parts of the coast are affected by a very energetic wave regime that is explained by its direct exposure to the waves coming from the Atlantic Ocean[32].
Water levels in estuaries depend on the relative importance of dif-ferent triggering factors. In the case of the Tagus estuary, water levels are influenced by the particular estuarine morphology that promotes tidal range amplification by resonance[37]. The estuary has a deep and narrow inlet channel and an extensive, shallow inner domain that corresponds to 43% of the total estuarine surface[71]. The existence of a narrow inlet channel constrains the propagation of ocean waves into the estuary, but the geometry of the inner domain favors the local generation of waves[29].
Storm surges can also contribute to water level increase and have been estimated at 46 and 58 cm in Cascais (estuary mouth) for return periods of 5 and 100 years, respectively[3]. Recent studies in the Tagus estuary[30]estimated water level variations for the 100-year return period of 4.5 m (CD-chart datum:2.08 m below mean sea level (MSL)) in Cascais, at the mouth, to 5.1 m (CD) at its head in Vila Franca de Xira, 50 km upstream from Cascais.
Additionally,fluvial discharge influence on water level is restricted to the upstream areas of the estuary[100], the Tagus and Sorraia rivers being the main sources of fresh water (Fig. 2b). The Tagus estuary is drained by an extensive hydrographic basin of about 80,629 km2[12]. The main Tagus estuary tributaries are the Tagus river and the Sorraia river (Fig. 2b). Over the last century, the Tagus and Sorraia rivers discharges have been largely modified by the construction of a large number of dams (more than 140 including Portuguese and Spanish territories) mainly between 1951 and 1957[16,6]. Since the beginning
of the 20th century, with the 1912 Treaty between Portugal and Spain, the two countries have agreed on the industrial exploitation of trans-boundary rivers among other issues, but only in 1998 with the Albu-feira Convention[12]did the two countries agree to the shared man-agement of the water discharges of dams, especially those located upstream in Spanish territory.
1.1.2. Regional land use and social vulnerability
The Lisbon metropolitan area comprises twelve waterfront munici-palities, five in the north margin and seven in the south margin (Fig. 2a). The northern margin is mostly occupied by urban areas (Fig. 2a), whereas natural and semi-natural spaces are predominant in the southern part, along with extensive agricultural areas located be-tween the Tagus and the Sorraia rivers and across the Benavente mu-nicipality (Fig. 2a). Additionally, the area is classified and legally pro-tected as a Natural Reserve and a Special Protection Area for birds playing a crucial role in the ecological functions of the Tagus estuary. The Lisbon metropolitan area plays a strategic role in the economic framework of the country, since the vast majority of governmental agencies are located here along with the largest public and private Portuguese companies and critical infrastructures.
The social and economic exchanges between the two margins are a crucial feature for understanding the metropolitan dynamics. In fact, 26% of Portugal's total population is concentrated here particularly in the northern margin, namely in the Lisbon, Loures and Oeiras munici-palities. The Lisbon municipality alone was responsible for about 26% of the total turnover in Portugal in 2011[44]. The last census data from 2011 demonstrated there is a high proportion of residents that work or study outside their municipality of residence, justifying the intense
commuting movements between the two margins particularly towards the Lisbon municipality, the national capital, but also between other municipalities[28]. The education level of northern margin stands out with a higher number of the resident population holding a university degree (22. 1% compared to 11. 9% in the south margin). In addition, the percentage of the resident population with no formal educational level is slightly higher in the southern margin (17. 5% compared with 15. 8%)[93].
Important commuting movements between the two margins of the estuary are a strong feature of the study area [28]. About 135,000 vehicles per day[45]cross the two existing bridges (25 de Abril and Vasco da Gama) along with more than 40,000 passengers by train[28]. The river is also crossed by 65,000 boat passengers each day [45]. Additionally, commodities transport and tourism are growing sectors. In fact, the Lisbon Port Authority verified an increase of 20% in cruise ship dockings between 2009 and 2013 along with a 13% increase in commodities commerce between 2012 and 2013[93].
Recently, Tavares et al.[93]studied the territorial vulnerability to flooding of the Tagus estuary margins applying statistical methods to census data and identified the urban context, the family structure and the socio-economic conditions as the main vulnerability drivers. The authors acknowledge that housing characteristics (namely the age of the buildings), education of the individuals (namely age and level) and mobility (namely the proximity tofluvial transport interfaces) are the most important dimensions to explain the territorialflood vulnerability in the Tagus estuary.
1.1.3. Historical evolution of estuarine margins
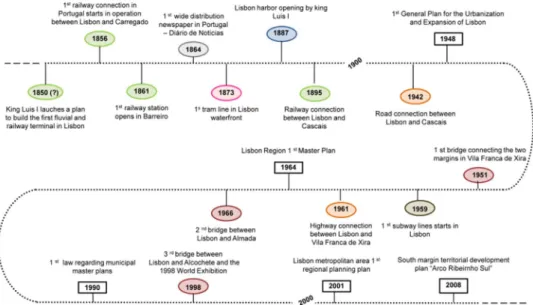
During the second half of the 19th century, the city of Lisbon was the main center of social and economic activities and the population doubled in less thanfifty years, along with extension of urbanized areas driven by the late industrialization period that occurred in Portugal [94]. Also during that period Oeiras, Cascais and Vila Franca de Xira in the northern margin and the Almada and Barreiro regions in the southern margin followed this growth trend [72] which led to un-planned urban areas with deficient sanitary conditions. During this period, the first widely circulated Portuguese newspaper, “Diário de Noticias” was launched and it still exists[90]. At the beginning of the 20th century (Fig. 3), thefirst harbor infrastructures were built on
landfill terrains along the Lisbon waterfront[24].
From the middle of the 20th century onwards, almost all the mu-nicipalities grew rapidly in terms of population bringing into existence a continuous urban area between Lisbon and the surrounding regions. This was especially prevalent in the northern margin[72]. The 1950s and 1960s were marked by intense industrialization, with construction of transport infrastructures accompanied by a growing awareness of the need for urban planning guidelines (Fig. 3).
The Tagus estuary now frames the largest metropolitan area in Portugal, containing about 1.6 million inhabitants mainly concentrated in the northern margin. The Lisbon world exhibition in 1998 along with the construction of a 3rd bridge (called Vasco da Gama), linking Lisbon and Alcochete in the southern margin, were responsible for the main territorial developments.
More recently in 2008, an extensive territorial development plan was launched in the southern margin called“Lisbon South Bay”[60] which sought to reclaim about 912 ha of the southern margin water-front, formerly occupied by one the of largest ship repair companies, Lisnave; an important steel company, Siderurgia Nacional, and an in-dustrial chemical company, Quimiparque. The target territory located on the Almada, Seixal and Barreiro waterfronts was environmentally degraded with unoccupied areas. Therefore, the project goals were environmental reclamation with an ecological corridor linking the three municipalities, along with new urban infrastructures dedicated to education, services, health, and sport facilities.
Furthermore, the government's recent intention to expand the cap-abilities of Lisbon airport might lead to new airport facilities in Montijo's estuarine margins, along with a new metropolitan line on Vasco da Gama Bridge which would generate new and intense com-muting between the two margins[36].
2. Methods
The conceptual methodology followed in this study is summarized inFig. 4. The outlined scheme was organized in two central steps that are described in detail below.
Previous studies conducted in Portugal [104] have provided an unprecedented and extensive compilation of information regarding hydro-geomorphologic (i.e., floods - except coastal floods - and
Fig. 3. Tagus estuary margins historic milestones of planning and infrastructures development from the mid 19th century to the beginning of the 21st century. Sources: Leite[59]; Sousa [90]; Durão[24]; Lisbon Metropolitan Area Atlas - AML[4]; Lisbon south bay[60].
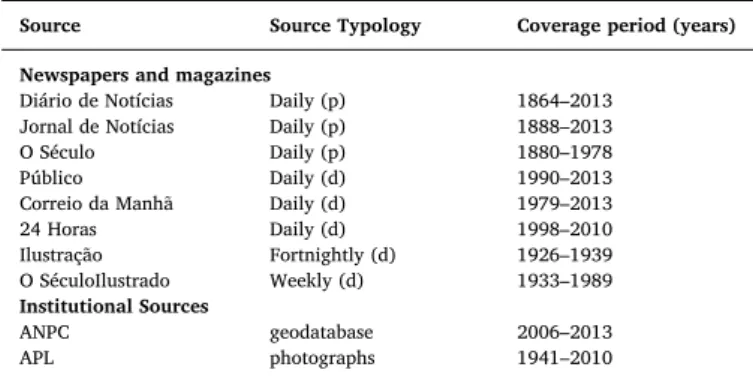
landslides) disasters for the whole country, based on a broad and sys-tematic collection of newspapers covering the period 1865–2010. Learning from this experience, the project DISASTER (http://riskam.ul. pt/disaster/) that gathered all the newspaper articles provided the vast majority of the printed sources used in the scope of this study. For completion, other institutional sources were collected (ANPC- National Authority for Civil Protection; APL - Lisbon Port Authority).
Due to the societal and economic national importance of the Lisbon Metropolitan Area, only national newspapers and national institutional sources were used as data sources (Table 1). From all the consulted printed media sources, a total of 147 newspapers and magazines spe-cimens were used, one geodatabase offlood occurrences provided by the National Authority for Civil Protection (ANPC) and 21 photographs provided by the Lisbon Port Authority (APL) historical archives (Table 1).
The consulted sources (Table 1) were used to build a geodatabase of Tagus flood occurrences considering losses, damages and flood trig-gering factors, comprising 235flood occurrences. An occurrence is de-fined as a geographically dede-fined place described in the consulted sources as affected by estuarine flooding, independent of its severity [85]. An event is defined as a group of occurrences with the same date or identified in the sources’ descriptions as being part of the same episode.
The internal organization of the geodatabase is provided inFig. 5 and comprises four groups of information.
To assure that the geodatabase would only capture estuarineflood occurrences, the geographic incidence was constrained to the area where estuarine processes prevail, between Oeiras and Vila Franca de Xira, corresponding to the upstream limit of the salt intrusion (Fig. 1), and between the highest astronomical tide line – the upper limit of intertidal domain [82]– and 20 m. above mean sea level but suffi-ciently near the margin to be clearly associated with estuarine pro-cesses. The topographic data was obtained from Portuguese Topo-graphic Maps, series 888, at 1:25,000 scale by the Portuguese Military Center for Spatial Information (IgeoE).
The methodology for content analysis and extraction of information from the newspapers was based on Berelson [11], GAO [34] and Krippendorf[54], methods that focus on the conceptual and relational elements present in the documents.
The approach followed to introduce newspaper information into the geodatabase started with extensive reading of each individual news-paper, then extraction and compiling the information in a spreadsheet based on geographic coordinates, for each occurrence and later in-troduced in a geodatabase using ArcGIS 10.1 software. Moreover for each occurrence the geodatabase fields (Fig. 5) were filled with the information retrieved from the consulted sources (Table 1).
The geographical locations extracted from the information given by the sources were geo-referenced in ETRS89 PT TM06 geographic co-ordinate systems, using a toponymical database supplied by ANPC and a geographical database of municipalities and civil parishes by Statistics Portugal (INE). In the cases of old street names and locations, a series of online data sources were accessed (e.g.[41,59]). When convenient a collection of orthophotographs from 2007 provided by the Directorate-General for the Territory (DGT), with 0.50 m. of spatial resolution and RGB spectral resolution were used for validation purposes.
To extract the relevant occurrences from the two institutional sources consulted (Table 1) the ANPC geodatabase wasfiltered by lo-cation and by triggering factors using the ANPC internal manual for occurrence classification. Furthermore, the information extracted from the photographs provided by APL was incorporated through cross-checking with other online sources (e.g.[41,59]).
To assure data integration consistency a set of rules were followed, namely, that the database would befilled in by one person only, who
Fig. 4. Methodological scheme followed in this study.
Table 1
Sources used to construct the Tagus estuarineflood geodatabase.
Source Source Typology Coverage period (years)
Newspapers and magazines
Diário de Notícias Daily (p) 1864–2013 Jornal de Notícias Daily (p) 1888–2013 O Século Daily (p) 1880–1978 Público Daily (d) 1990–2013 Correio da Manhã Daily (d) 1979–2013 24 Horas Daily (d) 1998–2010 Ilustração Fortnightly (d) 1926–1939 O SéculoIlustrado Weekly (d) 1933–1989 Institutional Sources ANPC geodatabase 2006–2013 APL photographs 1941–2010
(p)– printed source; (d) –digital sources consulted individually for validating and cross-checking purposes.
ANPC- National Authority for Civil Protection; APL - Lisbon Port Authority.
consulted all the sources andfilled in the geodatabase fields (Table 1 andFig. 5). Information was gathered and compared to acquire more refined details in the cases where the same event was recorded in more than one data source. When the source was considered vague or im-precise in terms of damages andflood processes the occurrence was not incorporated (for instance when is referred aflood in a neighborhood but no other information is given).
Concerning database exploration a simple spatial and temporal analysis was done,filtering the 235 occurrences by location (munici-pality) and representing the geographic distribution of estuarineflood occurrences as well as their distribution over time. The classification of occurrences into events allowed a simple probabilistic analysis using the Poisson distribution function since each event was considered in-dependent[85].
The temporal distribution offlood occurrences was graphically re-presented and allowed the empirical visualization of three distinct time periods between 1865 and 2013. The exact time intervals were achieved through the cumulative curve obtained using the relative frequencies for 10 year periods between1865 and 2013, where time intervals correspond to the points that marked a slope change of the curve. These three time intervals were used to perform a temporal risk analysis through the application of risk matrices as risk assessment tools. Two distinct standards were followed namely the AS/NZS 4360:2004 Risk Management Guidelines[8]and the HB205-2004 OHS Risk Management Handbook[7].
Thefirst standard provides a level of risk through the combination of likelihood and consequence (or severity). Occurrence likelihood was calculated for each time period and classified according to the standard classification. The AS/NZS 4360:2004 Risk Management Guidelines consider seven levels of likelihood: (A-almost certain; B- likely; C-pos-sible; D-unlikely; E-rare; F-very rare; G-almost incredible) and the re-spective indicative frequency (A-once a year or more frequently; B-once every three years; C-once every ten years; D-once every thirty years; E-once every 100 years; F-E-once in 1000 years; G-E-once in 10,000 years). The severity level for each time period was classified using the health and safety type of consequences established by the standard, con-sidering the different types of human injuries reported in the Tagus estuary database. The standard establishesfive levels of severity (I-no medical treatment required; II-objective but reversible disability re-quiring hospitalization; III-moderate irreversible disability or impair-ment (< 30%) to one or more persons; IV-single fatality and/or severe irreversible disability (> 30%) to one or more persons; V-multiple fatalities, or significant irreversible effects to > 50 persons). The overall risk level is obtained using the risk classification matrix of the standard. The second standard provides a level of risk, called risk rating, based on the overlap of three descriptors– consequences (C), exposition (E) and likelihood (L). The HB205-2004 OHS Risk Management Handbook considers six levels of consequences rated between 1 and 100: 1-notable (with small cuts and bruises; small environmental lea-kages with no relevant spatial incidence); 5-important (requiring medical assistance; with spatial environmental incidence but without damages); 15-serious (with injuries but without permanent effects in public health; adverse effects in the environment); 25–very serious (with permanent effects in public health and non-permanent effects in the environment); 50– disaster (with deaths and permanent effects in the environment); 100 – catastrophic (with multiple deaths and ex-tensive and permanent environmental damages).
Regarding exposure, the standard also specifies six levels ranging from 0.5 to 10: 0.5–very rare (unknown occurrences); 1–rare (one oc-currence is known); 2–infrequent (from once a month to once a year); 3–occasional (once a week to once a month); 6–frequent (almost daily); 10–continuous (various occurrences in one day).
Finally, in what concerns likelihood (L) the standard stipulates six levels ranging from 0.1 to 10: 0.1-almost impossible (unknown occur-rence) with a residual incidence (1/10000); 0.5–conceivable (very low incidence (1/1000)); 1-remote (low incidence (1/100)); 3-possible but
not common; 6–probable (common occurrence with a probability of 50%); 10– almost certain.
For the different periods of time each descriptor was assessed and thefinal risk score was obtained by equation 1.
= × ×
Risk score C E L
The level of risk (risk rating) for each result of equation 1 is achieved through reference to the standard classification table which establish four risk ratings accordingly: for a risk score higher than 600 the risk level is classified as Very High; for a risk score between 300 and 599 the risk level is classified as High; for a risk score between 90 and 299 the risk level is classified as Moderate and for a risk score lower than 90 the risk level is classified as Low.
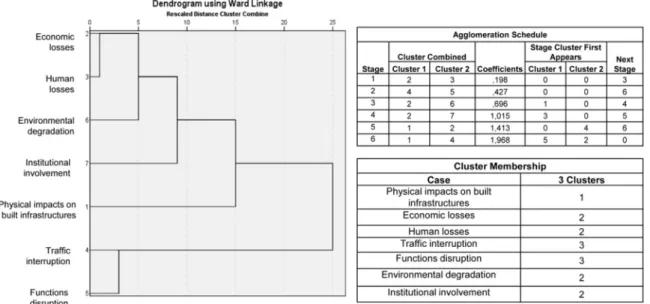
To evaluate the relational degree between the different damage typologies the data was processed using cluster analysis. This is an exploratory statistical technique of multivariate analysis that allows grouping variables into homogeneous groups based on common char-acteristics of those variables[62]. The geodatabase group of informa-tion b)“type of impacts” was used to do a statistical exploration using cluster analysis techniques to assess the degree of relation between the different types of impacts. For the classification a hierarchical cluster analysis was used considering 3 clusters using the Ward method and phi coefficient as a similarity measure. The procedure was done using SPSS Statistics® software.
3. Database exploration
3.1. Spatial and temporal occurrences
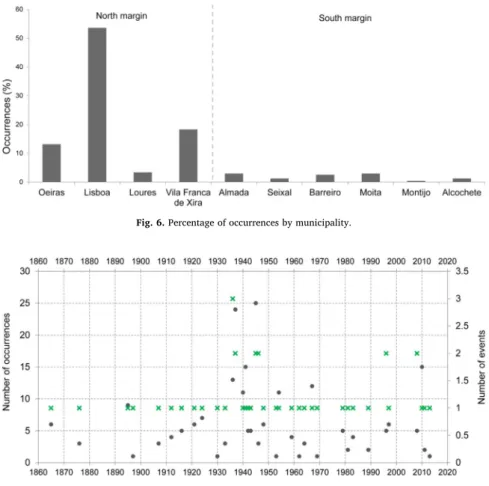
The acquired data comprise 235 occurrences corresponding to 44 events over a period of 148 years, between 1865 and 2013 that affected 10 municipalities in the Lisbon metropolitan area between Oeiras (downstream) and Vila Franca de Xira (upstream) (Fig. 6). Of the 235 occurrences, 54% were registered in the Lisbon municipality followed by 18% in Vila Franca de Xira and 13% in the Oeiras municipality. Fig. 6demonstrates the contrast between the two margins regarding occurrence distribution, with the Montijo municipality registering only one occurrence.
The temporal distribution of flood occurrences and events is re-presented inFig. 7and reveal that the period from 1900 to almost 1970 is characterized by an increase inflood occurrences and events. The decades of the 1930's and 1940's showed the highest number of oc-currences registered during the study period.
3.2. Triggering factors
The relative percentage of each forcing factor by municipally is presented in Fig. 8and reveals that in the majority (exceptions are Alcochete and Montijo) of the Tagus estuary municipalities estuarine flood processes are associated with the simultaneous action of multiple triggering factors. However, these assumptions should be regarded carefully since in the cases of the Alcochete, Montijo and Seixal mu-nicipalities, only a limited number of occurrences were registered.
Thefigure indicates that rainfall has been cited by the historical sources as the most relevant triggering factor, in all estuarine munici-palities along with the tide influence, although the latter has less im-portance when compared to the rainfall. Also, other anthropogenic factors are worth noting (destruction of flood protection walls and dykes) that are particularly relevant for the upstream municipality of Vila Franca de Xira.
3.3. Spatial and temporal impact
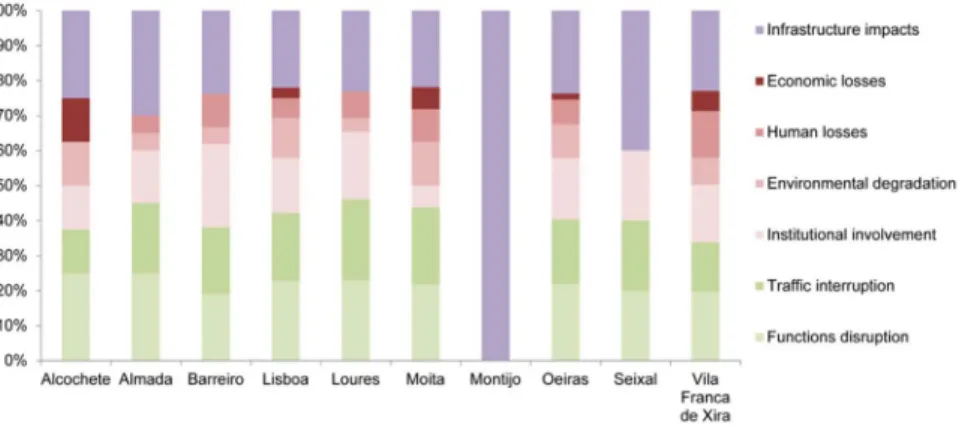
In order to reveal which impacts are relevant in Tagus estuary floods, an impact analysis was made through the exploration of direct and tangible damages (infrastructures impacts and reported economic
losses), intangible damages (human losses and environmental dete-rioration) and indirect and tangible records (traffic interruption and function disruption).
Fig. 9shows the percentage of each type of impact by municipality. Herein, the percentages have to be interpreted considering the total number of occurrences with registered impacts by each municipality. The analysis revealed that out of the 235 occurrences registered in the database only 15 do not have any associated impact. The majority of impact typologies are widely distributed among Tagus municipalities with exception of the Montijo municipality registering only infra-structure-related impacts (Fig. 9).
Infrastructure impacts (physical damages on built infrastructures) are widely distributed among all the Tagus estuary municipalities (Fig. 9). Economic losses (only direct economic losses were considered) were found infive of the ten municipalities (Alcochete, Lisboa, Moita, Oeiras and Vila Franca de Xira) and human losses were present in seven of ten municipalities (Almada, Barreiro, Lisboa, Loures, Moita, Oeiras and Vila Franca de Xira). Environmental degradation was registered in
eight municipalities (Alcochete, Almada, Barreiro, Lisboa, Loures, Moita, Oeirasand Vila Franca de Xira) and institutional involvement, traffic interruption and functions disruption were registered in nine of the ten municipalities (Fig. 9). At a glance,Fig. 9reveals that histori-cally, Tagus estuaryflood damages are diverse and were registered at the vast majority of the municipalities with the exception of Montijo where only one typology of damages is associated.
Human losses were described by typology (dead, injured, evac-uated, missing and displaced persons) and by municipality (Fig. 10). None of the ten municipalities registered any record of missing people and Alcochete, Seixal and Montijo did not register any record of human losses. Lisbon and Vila Franca de Xira are the municipalities that stand out with the largest number of recorded human losses. The other mu-nicipalities have a residual number of records with the evacuated and displaced being the most common features. Database records also re-vealed that the number of occurrences with registered evacuees are relevant in Lisbon (17 records), Vila Franca de Xira (15 records) and Oeiras (4 records) along with the death records that account for 2 in
Fig. 7. Temporal distribution of estuarineflood occurrences and events between 1865 and 2013 Green crosses represent events and grey round dots represent occurrences.
Fig. 8. Percentage of each forcing factor by municipality and the number of occurrences by municipality. Fig. 6. Percentage of occurrences by municipality.
Lisbon, 3 in Oeiras, and 8 in Vila Franca de Xira.
Overall,Fig. 10reveals the historical relevance of evacuees as the preponderant human loss typology in the Tagus estuary, since they occurred infive of the ten municipalities and have the highest number of records.
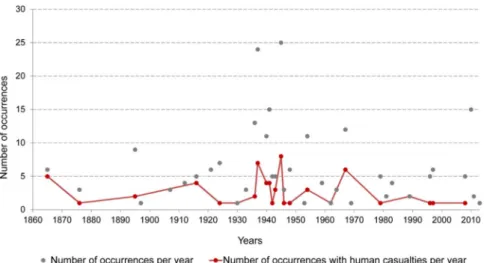
Fig. 11illustrates the historical overview of the total number of occurrences per year and the number of occurrences with registered human casualties per year between 1865 and 2013. Between the early and the middle part of the 20th century there were a higher number of occurrences registered which led to the definition of three distinct time periods (Table 2).
Thefirst period (1865–1916) registered the lowest number of oc-currences and only two typologies of human losses are found (deaths and evacuated). In the second period (1917–1962) there is a significant increase in the number offlood occurrences along with human losses typology diversification. More recently (1963–2013) the number of occurrences and related human losses typologies decreased sig-nificantly. Generally, the Tagus estuary flood history reveals a distinct prevalence offlood occurrences and related human consequences over the considered time periods.
4. Tools for risk management
4.1. Risk matrices
Risk matrices provide a broad view of risk assessment synthesizing the evolution of estuarineflood risk over time.Table 3presents the risk classification obtained according to the described methodologies ([8,7]) for each considered time period. Despite the different indicators and assumptions considered by each standard the results are similar and indicate that the period 1917–1962 registered the highest risk
within the entire geodatabase time frame. The oldest and the more recent time periods have similar risk classifications.
4.2. Impact profiles
Damage types were assessed through pre-defined groups of damage typologies that were considered in the database. The typologies range from physical damages on built structures to human losses or traffic disruption. We evaluated the degree of relation between the different typologies using cluster analysis. Fig. 12 represents the operational steps used to establish the three clusters.
These clusters express the relationship between the different types of damages. Considering that the information is obtained from news-paper analysis, it is possible to assume that the results reflect a social and political context that those types of sources are frequently em-bedded in. Therefore, each cluster is understood as a unique and in-dividual impact profile that might be interpreted in the context of Tagus estuaryflood risk evaluation (Table 4).
Impact profile A (operational impacts) is related to episodes with small physical damages and no significant human or economic losses. Typically, this corresponds to episodes where there is traffic or public transport interruption with associated functions’ disruption. Profile B concerns infrastructure impacts and is associated with episodes where the destruction of built structures is the relevant feature, sometimes with economic damages mentioned in newspapers but with no sig-nificant human losses. Finally, profile C is associated with major public impacts and is linked to episodes where significant human and eco-nomic losses are the most relevant feature, but where other types of damages also appear due to the importance of the episode. Hence, damage profiles constitute a snapshot of estuarine flood damage typologies giving valuable insights onflood risk management policies.
Fig. 9. Percentage of each type of impact by municipality.
5. Discussion
5.1. Historical information appraisal
In agreement with other studies (e.g. [78,104]85]), the present work shows that databases built upon newspaper reports have the po-tential to give valuable information on historical flood occurrences. However, the results have some limitations since it is recognized that newspaper reports carry a clear bias (e.g.[91]). As already recognized by other authors[14,38]these types of sources usually give excessive media coverage to events with significant societal consequences (namely with human causalities or significant social disruption) which might lead to an underrepresentation of the real number of events, compromising the completeness of the database. Another acknowl-edged pitfall is a frequent lack of scientific accuracy in the reported information[43]. Relevant to the case of the Tagus estuary, it was also recognized that newspapers due to their intrinsic characteristics, reflect journalistic criteria and the socio-political importance relative to cer-tain municipalities when compared to others which might explain the larger percentage of occurrences registered in the Lisbon municipality. Another source of bias is related to the methodology used to per-form content analysis and inper-formation extraction in media sources. There are two main types of content analysis: the one performed by human coders executed by people, and computer aided text analysis (also designated as CATA), which involves the use of software to exe-cute analyses[70]. Although it is recognized that the latter type favors
reliability and comparability, the two types are equally effective when compared[66]. Furthermore, despite all efforts in algorithm develop-ment it is acknowledged that CATA is not able to interpret subjective messages as human coders can[54]. For instance, during this work information onflood extent was frequently encountered like this ex-ample:“só se viam os dois últimos degraus da escadaria do Teatro Na-cional” – only the last two steps of the stairs were visible in the front of the National Theatre” (Jornal de Noticias 25/10/1954). This type of sen-tence needs to be interpreted in order to be translated into useful in-formation, only possible if interpreted by human coders. Following the best practice[54]a set of previously established rules of content ana-lysis were followed to improve accuracy and reliability.
In order to extract the maximum amount of information possible from the sources, afield was added in the database structure to capture the information about triggering factors (Fig. 5). Although efforts were made to incorporate accuracy, the limitations of the data sources in describing meteorological and hydrodynamic conditions have to be acknowledged. In fact, this has already been noticed by others[43]. The lack of accuracy and detail in this particular type of information reveals that media sources (specifically newspapers) are not the most adequate base for study and analysis of triggering factors of natural hazards, especially if the hazard is a result of compound triggers such as es-tuarinefloods. Nevertheless, the data presented inFig. 8was able to capture the estuarine system complexity, demonstrating that flood events are associated with the simultaneous presence of multiple for-cing factors with rainfall being particularly relevant.
Fig. 11. Temporal distribution of total number of occurrences per year along with the number of occurrences with registered human casualties.
Table 2
The three time periods defined and the number of occurrences for each one of them along with human losses typology distribution. Time periods Number of years Number of occurrences Human losses typology
Deaths Missing Injured Evacuated Displaced
1865− 1916 51 31 15 0 0 35 0
1917− 1962 45 141 33 0 24 1021 44
1963− 2013 50 63 7 0 0 408 131
Table 3
Tagus estuaryflood risk classification for the three time periods according to the two standards used in this study.
Temporal interval HB205-2004 OHS Risk Management Handbook AS/NZS 4360:2004 Risk Management Guidelines
C E L Risk score Risk rating Likelihood label Severity label Level of risk
1865–1916 25 6 3 450 High B III High
1917– 1962 50 6 3 900 Very high A V Very high
In previous work, Ramos and Reis[77]and Trigo et al.[96] asso-ciated importantflood episodes in the Tagus basin with two different meteorological situations, a) relatively long lasting rainfall periods in winter months, and b) the existence of a strong, regional convection activity and a low pressure system that triggers intense and short term rainfall episodes. In the estuary, particularly in urban areas, the coin-cidence of heavy rainfall episodes with high tide, along with the limited capacity of the sewer system can cause severe urban floods[13]as observed along the estuary margins[97]. The results of database ana-lysis (Fig. 8) indicate the relevance of thefluvial discharges in the flood episodes in the upstream areas, especially in the Vila Franca de Xira municipality, which is in agreement with the results of a previous study that analyzed the influence of Tagus discharge on the estuarine water level[100].
Fig. 8also reveals the importance of other anthropogenic factors in the Vila Franca de Xira municipality. The newspapers indicated the destruction offlood protection walls in the agriculture lands namely on the three islands formed by alluvial deposition (Fig. 2b) and in the extensive agricultural areas located between the Tagus and the Sorraia rivers (called Lezírias) as a triggering factor in the above mentioned municipality. This is consistent with area development since 1836 in establishment of a large farmstead company (called Companhia das Lezírias) that built and maintained flood protection walls and dykes along the margins to prevent salt water from entering these fertile lands. In spite of this, other studies revealed that this area has been subject toflood events during the last century[2,33,61].
As already acknowledge by Grantham and Vieira[35]newspapers and content analysis of them have been a primary source of environ-mental information playing an important role in risk communication and political decisions. The present work brings to light the fact that in
spite of the various sources of bias, the extended analysis of newspaper stories made possible the acquisition of valuable knowledge regarding the dimension of damages/consequences of flood risk. In fact, the richness of detail those newspapers provide on damages quantification and description is significant as demonstrated in theFigs. 9, 11 and Table 2.
5.2. Spatial and temporal evolution of past estuarineflood occurrences The historical perspective given by this study revealed the relevance of geographical context since Lisbon, followed by the Oeiras and Vila Franca de Xira municipalities account for the vast majority of the re-gistered occurrences. Furthermore, the contrast between the two mar-gins is remarkable, the northern margin being the most affected by estuarinefloods (Fig. 6). This circumstance reflects the socio-political importance, replicated in the data sources that Lisbon and the northern margin municipalities have had over time when compared to the southern margin municipalities, as previously described in Section 1.1.3.
The temporal distribution offlood occurrences allowed the defini-tion of three time periods that differ in number of occurrences and si-multaneously on the features of human losses. The first period (1865–1916) presented the lowest number of occurrences and asso-ciated human losses. This period corresponded to the beginning of the industrialization and transport infrastructure planning in the Lisbon metropolitan area and the rest of the country. The population was thus concentrated in Lisbon and in relatively small urban areas, poorly connected with the capital.
The second period (1917–1963) presented the highest number of flood occurrences along with the diversification of the human losses typology. This period corresponds to the consolidation of infrastructure development and the acceleration of urban expansion, along with po-pulation growth on both margins of the estuary. In the Lisbon me-tropolitan area, the construction of landfills to install the Lisbon harbor facilities was especially relevant, changing dramatically the waterfront landscape[24]along with marginal roads, tram and railway lines and the increase of fluvial connections between the two margins of the Tagus estuary. These historical occurrences might help to explain the higher number of human losses, when compared to the other two periods. Regarding the exceptional number offlood occurrences regis-tered, Zêzere et al.[104]computed the mean annual precipitation per decade in Lisbon during the 20th century and concluded that the dec-ades between 1930 and 1960 presented an increased trend in mean
Fig. 12. SPSS cluster analysis dendogram displaying three clusters association.
Table 4
Cluster analysis and impact profiles definition.
Impact profile Types of impacts Cluster name A Traffic interruption Operational impacts
Functions disruption B Physical impacts on built
infrastructures
Infrastructures impacts
C Economic losses Major public impacts Human losses
Environmental degradation Institutional involvement
annual precipitation. This fact, associated with a larger urban area with limited drainage capacity might also help to explain the highest number offlood occurrences.
More recently (1964–2013), a decrease in flood occurrences and associated human losses was registered. The end of the 20th century and the beginning of the 21st century corresponded to a relative stag-nation of new infrastructure development and to a decrease in urban expansion projects. The exceptions were the World Exhibition in 1998 that transformed a large degraded area on the northern margin into a new urban area, and more recently, the so called“Lisbon South Bay” project in the southern margin. Concerning triggering factors, Zêzere et al.[104]verified a decrease of mean annual precipitation between the end of the 1960's and the 1980's followed by an increase until the decade following 2000. This recent decreasing trend in flood occur-rences and associated impacts might also be associated with the re-inforcement offlood protection measures in the upstream area of the estuary (Lezírias) and is consistent with the past knowledge of the system[30].
Over time and regardless of the number of occurrences, there is a background record of human casualties, as illustrated inFig. 11. Also worth noting is the importance of evacuees and displaced people when compared to the number of dead, injured and missing (Fig. 10). The results illustrate that typology of human losses is dependent on the land use, and thus urban and populated municipalities registered a higher number of human losses (Fig. 10). This fact might be a crucial con-sideration inflood risk management strategies for this area, especially with recent trends towards reconversion of degraded industrial areas into new urban centers along the Tagus estuarine margins. Despite the information constraints discussed in the previous section, the overall knowledge on past estuarine flood occurrences and related impacts provides a strong base to inform flood risk management plans that usually use historical data to validate options and models.
5.3. The use of historical information to define impact profiles
In the framework of this study two risk management tools based on historical information were applied: risk matrices and impact profiles. The application of risk matrices to three time periods revealed that risk level is high in the overall period of analysis increasing to very high between 1917 and 1963. This might be explained not only by a con-solidation of infrastructure development and population increase, but also because during this period the Tagus estuary was hit by two major events recorded in the database. Namely the storm of January 27th, 1937 [74] and the February 15th, 1941 windstorm [31,33,68] that contributed to 31 of the 33 deaths registered during that period, along with 14 of the 24 registered injured and 293 of the 1021 registered evacuees (Table 2). The November 25th, 1967 event[97]is acknowl-edged as the more recent and significant flood event represented in the third period of analysis (1963–2013) with an overall of 12 occurrences in the database. The event was responsible for the 7 deaths registered during that period along with 155 of the total 408 evacuees (Table 2). The analysis of historical information allowed a comprehensive view of past Tagus estuaryflood episodes, giving at the same time a snapshot offlood risk assessment. As Van Asselt and Renn[98]or Renn and Klinke [81]point out, the enhancement of decision making pro-cesses based on the correct dimension of technical, human, institutional andfinancial resources available for those decisions is crucial to ad-vanceflood risk mitigation. Therefore, the impact profiles outlined in Table 4represent a conceptual tool for Tagus estuaryflood risk man-agement, since they present three different risk problems whose ana-lysis might give valuable insights on future resource allocation to face estuarineflood episodes. The three outlined profiles can be situated in the IRGC risk management framework[46](Fig. 13), giving a com-prehensive view on the type of risk problems faced in the Tagus estuary along with the set of actors involved and type of resources needed.
Profile A (Fig. 13) exemplifies damages related to traffic
interruption and functions disruption caused byflood episodes. These types of damages are mainly operational and require minimal institu-tional staff intervention (only municipal and national civil protection agents) who configure a simple risk problem with a straightforward answer. Typically, this profile stands for routine interventions with a small amount of resources allocated by public authorities. Nevertheless, given the intense commuting verified between the two Tagus estuary margins, it is reasonable to expect that public and private transport companies might be the most affected.
Profile B (Fig. 13) typifies essentially infrastructure damages but with no human or economic losses described in the sources. Usually, infrastructure damages signify damages to small business like water-front cafes, public leisure facilities, harbor facilities or even private houses. Considering the IRGC risk management framework these types of damages configure a complex risk problem requiring scientific si-mulation, and therefore, civil protection agents are insufficent to ad-dress the challenge. Thus, external experts from national institutions from different sectors should be called to share their insight.
Profile C (Fig. 13) illustrates major public impacts due to significant and relevant flood episodes with human and economic losses, en-vironmental degradation and consequently, institutional involvement. The damages are associated with human losses (dead, injured, dis-placed and evacuees) along with economic losses whose relevance is reflected by the fact that, in the reports, the money estimated lost due to theflood is frequently recorded. Environmental degradation usually corresponds to large amounts of waste and wreckage left by theflood. Institutional involvement is thus a transversal feature often mentioned in the sources specially when there are human and economic losses. Sometimes traffic interruption can be deduced from the sources but is not described and thus does not appear associated with the profile.
This impact profile embodies an uncertainty induced risk problem and therefore requires a cost-benefit analysis with the crucial involve-ment of other relevant stakeholders, like the state-owned agro-forestry farmstead that owns the northeast Lisbon agriculture areas, civil parish councils, residents’ associations or public transport users’ associations, besides civil protection agents and external experts. The February 1941 storm or, more recently, the November 1969floods can be considered examples of episodesfitting into this profile.
A noteworthy outcome of this study is the recognition that past records do not reveal an ambiguous risk problem. In fact, although some relevant and destructiveflood episodes took place in the Tagus estuary, none of the profiles show a severity of records that configure disruption lacking a debate of conflicting views about flood risk or even flood risk protection measures which is in line with what is known about pastflood records in the area.
6. Conclusions
The study discussed the usefulness and relevance of information from historic sources particularly concerning damage assessment along with an appraisal of constrains related to the use of these types of sources and methods. An analytical overview of the spatial and tem-poral distribution of Tagus estuary flood occurrences was done and demonstrated that in spite of historical information constrains, this knowledge is useful to inform futureflood risk management plans, since those instruments usually validate options based on the historical re-cord. Finally, based on historical damage information, impact profiles were outlined that were placed into the IRGC risk management esca-lator, giving a complete portrait of Tagus estuaryflood risk manage-ment options.
The appraisal of historical information made in this study indicated that in spite of the intrinsic constrains of the sources and methods used newspapers, are still useful to extract damage data that can be a very valuable asset for improved flood risk management strategies. Moreover the easy, almost free access to a systematic source like this with such a wide cover period should be acknowledged. However, it is
worth noting that there is a lack of a systematic standard for damage data extraction from this type of source as well as from other types of sources that register losses and damages and without a common on-tology for the terms used to describe damage types. These are issues that call for further research.
However given the absence of spatial impact profiles and taking into account the discussed constrains on the sources and methods used, these results are not suitable for direct use by operational actors or to inform future flood risk assessments considering climate change sce-narios. Nevertheless, the conceptual development made in the frame-work of this study contributes an overview of the different risk pro-blems, including the relevant actors and the type of answers that inform the relevant stakeholders about the necessary resources for emergency and mitigation planning, thus contributing to avoidance of over-sizing or downsizing of measures and resources.
From a more theoretical point of view the study contributes to policy learning practices as presented by Voss and Wagner[102], who recognize that small scale events create valuable opportunities to put into practice learning processes that will allow coping with larger da-maging events in the future, further demonstrating the richness of historical sources onflood damages magnitude that provide a valuable set of information toflood risk managers. The necessity of justification and validation offlood risk public policy options, namely the institu-tional means and resources allocated to the risk management practice is inevitability growing. Thus, historical information based on long-term database records can establish an important basis for diagnosis and management offlood risk.
Acknowledgements
This work was supported by the projects FORLAND – Hydrogeomorphologic risk in Portugal: driving forces and application for land use planning [PTDC/ATPGEO/1660/2014] and MOLINES -Modelingfloods in estuaries. From the hazard to the critical manage-ment [PTDC/AAG-MAA/2811/2012] both funded by the Portuguese Foundation for Science and Technology (FCT), Portugal. The work was
also supported by European Union's H2020 Programme (BINGO, Grant Agreement: 641739). Thefirst author benefits from a doctoral grant funded by the Portuguese Foundation for Science and Technology (FCT) – (SFRH/BD/111166/2015).
The authors thank the data provided by the project DISASTER (PTDC/CS-GEO/103231/2008) also funded by FCT and the following institutions: Administração do Porto de Lisboa (APL), Autoridade Nacional de Proteção Civil (ANPC).
The authors would also like to thank the three anonymous reviewers for their valuable comments which helped improve the quality of this paper.
References
[1] B. Ale, P. Burnap, D. Slater, On the origin of PCDS– (probability consequence diagrams), Saf. Sci. 72 (2015) 229–239,http://dx.doi.org/10.1016/j.ssci.2014.09. 003.
[2] J.F. Alves, Companhia das Lezírias. Sulcos de uma empresa centenária, 1836– 2003. Companhia das Lezírias (Ed.). ISBN: 972-797-073-7 (in Portuguese), 2003. [3] C. Andrade, H.O. Pires, P. Silva, R. Taborda, M.C. Freitas. Zonas Costeiras, in:
Alterações climáticas em Portugal. Cenários, impactes e medidas de adaptação. Projecto SIAMII 169–208, Lisboa: Gradiva. ISBN: 989-616-081-3, 2006. [4] AML. Atlas da Área Metropolitana de Lisboa. 231p. ISBN 972-98655-7-4.
〈[https://www.aml.pt/]〉.
[5] ANPC. Guia para a Caracterização do Risco no Âmbito da Elaboração de Planos de Emergência de Protecção Civil. Cadernos Técnicos PROCIV, Lisboa. (in Portuguese).〈[http://www.segurancaonline.com/fotos/gca/ctp9_ planosdeemergencia_1308304114.pdf]〉.
[6] ARH do Tejo Plano de Gestão da Região Hidrográfica do Tejo. Síntese para con-sulta pública. Versão Extensa ARH do Tejo, 462p.〈http://www.apambiente.pt/_ zdata/Politicas/Agua/ParticipacaoPublica/Documentos/ARHTejo/PGRH/2_ PGRHTejo_versoextensa.pdf〉. (accessed 14 March 2016).
[7] AS, HB205—2004.OHS Risk Management Handbook.Standards Australia International, Sydney, 2004.
[8] AS/NZS, Risk Management Guidelines. Companion to AS/ NZS 4360:2004. Standards Australia International/ Standards New Zealand, Sydney and Wellington, 2005.
[9] T. Aven, O. Renn, Risk Management and Governance: Concepts, Guidelines and Applications. Risk, Governance and Society 16 Springer-Verlag, Heidelberg, 2010 ISBN: 978-3-642-13925-3.
[10] J. Batica, P. Gourbesville, F. Hu, Methodology forflood resilience index, International Conference on Flood Resilience: Experiences in Asia and Europe, 5–7 Fig. 13. Framing the Tagus estuaryflood impact profiles into the IRGC risk management escalator and stakeholder involvement.
September 2013, Exeter, United Kingdom, 2013.
[11] B. Berelson, Content Analysis in Communication Research, Hafner, New York, 1971.
[12] CADC, Convenção De Albufeira. Cadc-albufeira.eu. N.p., 2017. Web. 17 Mar. 2017, 2017.
[13] M.A. Cardoso, M.C. Almeida, R.S. Brito, P. Beceiro. Modelação integrada da dre-nagem urbana em zonas estuarinas: avaliação da inundação para cenários climatéricos. 10° Encontro Nacional de Entidades Gestoras de Água e Saneamento, ENEG 2015, Porto, 1–4 de dezembro. (in Portuguese).〈[http://www.lnec.pt/ fotos/editor2/dha/DHA%20PDFs/cardoso_et_al_molines_eneg2015_final.pdf]〉. [14] A. Carrara, G. Crosta, P. Frattini, Geomorphological and historical data in
asses-sing landslide hazard, Earth Surf. Process. Landf. 28 (2003) (2003) 1125–1142, http://dx.doi.org/10.1002/esp.545.
[15] C. Chadenas, A. Creach, D. Mercier, The impact of storm Xynthia in 2010 on coastalflood prevention policy in France, J. Coast. Conserv. 18 (2014) 529–538, http://dx.doi.org/10.1007/s11852-013-0299-3.
[16] CNPGB, Dams In Portugal. Cnpgb.apambiente.pt. N.p., 2017. Web. 17 Mar. 2017, 2017.
[17] V. Cologna, R.H. Bark, J. Paavola, Flood risk perceptions and the UK media: moving beyond“once in a lifetime” to “Be Prepared” reporting, Clim. Risk Manag. (2017),http://dx.doi.org/10.1016/j.crm.2017.04.005.
[18] J. Corfee-Morlot, I. Cochran, S. Hallegatte, P.J. Teasdale, Multilevel risk govern-ance and urban adaptation policy, Clim. Change 104 (1) (2011) 169–197,http:// dx.doi.org/10.1007/s10584-010-9980-9.
[19] L.A. Cox Jr., What's wrong with risk matrices? Risk Anal. 28 (2) (2008) 497–512, http://dx.doi.org/10.1111/j.1539-6924.2008.01030.x.
[20] L.M. David, M.A. Cardoso, R.M. Ugarelli, S. Bruaset, Chapter 4.12 New concepts and best management practices for mitigating impact of sea water level rise on drainage systems, in: A. Hulsman, G. Grützmacher, G. van den Berg, W. Rauch, A.L. Jensen, V. Popovych, M.R. Mazzola, L.S. Vamvakeridou-Lyroudia, D.A. Savic (Eds.), Climate Change, Water Supply and Sanitation: Risk Assessment, Management, Mitigation and Reduction, IWA Publishing, London, 2015, pp. 318–323.
[21] M. Diakakis, G. Deligiannakis, A. Pallikarakakis, M. Skordoulis, Identifying ele-ments that affect the probability of buildings to suffer flooding in urban areas using Google Street View. A case study from Athens metropolitan area in Greece, Int. J. Disaster Risk Reduct. 22 (2017) 1–9,http://dx.doi.org/10.1016/j.ijdrr. 2017.02.002.
[22] DGT. Carta de Uso e Ocupação do Solo de Portugal continental para 2007 (COS2007). Memória Descritiva. (online), 2010.〈http://www.dgterritorio.pt/ cartografia_e_geodesia/cartografia/cartografia_tematica/carta_deocupacao_do_ solo__cos_/cos__2007/〉(accessed 17 March 2017).
[23] N.J. Duijm, Recommendations on the use and design of risk matrices, Saf. Sci. 76 (2015) 21–31,http://dx.doi.org/10.1016/j.ssci.2015.02.014.
[24] V.C.M. Durão, Análise Urbana de Territórios Construídos. Os Aterros na Baixa ena Frente Ribeirinha de Lisboa, Port. Rev. Gest. Coste. Integr./ J. Integr. Coast. Zone Manag. 12 (1) (2012) 17–30,http://dx.doi.org/10.5894/rgci288.
[25] J.R. Eiser, a. Bostrom, I. Burton, D.M. Johnston, J. McClure, D. Paton, J. Van der Pligt, M.P. White, Risk interpretation and action: a conceptual framework for re-sponses to natural hazards, Int. J. Disaster Risk Reduct. 1 (2012) 5–16,http://dx. doi.org/10.1016/j.ijdrr.2012.05.002.
[26] EM-DAT, EM-DAT|, The International Disasters Database. Emdat.be. N.p., 2017. Web. 17 Mar. 2017, 2017.
[27] M.P. Escobar, M. Vinogradova, D. Demeritt. Using newspapers as a source of data to assessflood impacts: methodology note (online), 2016.〈http://www. naturalhazardspartnership.org.uk/wp-content/uploads/2016/10/Methodology-note-on-impact-scoring-final.pdf〉(acessed 22 july 2017).
[28] J.P. Ferreira, How Commuting Influences Urban Economies And The Environment: A Commuting Satellite Account applied to the Lisbon Metropolitan Area. PhD Thesis in Sustainable Energy Systems, University of Coimbra, 2016.
[29] P. Freire, C. Andrade, Wind-induced sand transport in Tagus estuarine beaches. First results, Aquat. Ecology 33 (3) (1999) 225–233,http://dx.doi.org/10.1023/ A:1009911012260.
[30] P. Freire, A. Tavares, L. Sá, A. Oliveira, A. Fortunato, P. Santos, A. Rilo, J.L. Gomes, J. Rogeiro, R. Pablo, P.L. Pinto, A local scale approach to estuarine flood risk management, Nat. Hazards (2016), http://dx.doi.org/10.1007/s11069-016-2510-y.
[31] J.G. Freitas, J.A. Dias, 1941 windstorm effects on the Portuguese Coast. What lessons for the future? J. Coast. Res. 65 (2013) 714–719,http://dx.doi.org/10. 2112/SI65-121.
[32] A.B. Fortunato, K. Li, X. Bertin, M. Rodrigues, B.M. Miguez, Determination of extreme sea levels along the Iberian Atlantic coast, Ocean Eng. 111 (1) (2016) 471–482,http://dx.doi.org/10.1016/j.oceaneng.2015.11.031.
[33] A.B. Fortunato, P. Freire, X. Bertin, M. Rodrigues, J. Ferreira, M.L.R. Liberato, A numerical study of the February 15, 1941 storm in the Tagus estuary, Cont. Shelf Res. 144 (15) (2017) 50–64,http://dx.doi.org/10.1016/j.csr.2017.06.023. [34] GAO. Content Analysis: A Methodology for Structuring and Analyzing Written
Material. Program Evaluation and Methodology Division, United States General Accounting Office, 1996.〈http://www.gao.gov/assets/80/76281.pdf〉. [35] S. Grantham, E.T. Vieira, Risk dimensions and political decisions frame
environ-mental communication: a content analysis of seven U.S. newspapers from 1970–2010, Appl. Environ. Educ. Commun. 13 (2) (2014) 91–98,http://dx.doi. org/10.1080/1533015X.2014.944633.
[36] J.F. Gomes. Observador. (online), 2017.http://observador.pt/2017/02/15/ aeroporto-domontijo-construcao-pode-arrancar-no-inicio-de-2019-e-incluir-metro/(accessed in 10 March 2017).
[37] M. Guerreiro, A.B. Fortunato, P. Freire, A. Rilo, R. Taborda, M.C. Freitas, C. Andrade, T. Silva, M. Rodrigues, X. Bertin, A. Azevedo, Evolution of the hy-drodynamics of the Tagus estuary (Portugal) in the 21st century, Rev. De. Gest. Coste. / J. Integr. Coast. Zone Manag. 15 (1) (2015) 65–80.
[38] F. Guzzetti, G. Tonelli, Information system on hydrological and geomorphological catastrophes in Italy (SICI): a tool for managing landslide andflood hazards, Nat. Hazards Earth Syst. Sci. 4 (2004) 213–232, http://dx.doi.org/10.5194/nhess-4-213-2004.
[39] F. Guzetti, M. Cardinali, P. Reichenbach, The AVI project: a bibliographical and archive inventory of landslides andfloods in Italy, Environ. Manag. 18 (4) (1994) 623–633,http://dx.doi.org/10.1007/BF02400865.
[40] I.D. Haigh, M.P. Wadey, S.L. Gallop, H. Loehr, R.J. Nicholls, K. Horsburgh, J.M. Brown, E. Bradshaw, A user-friendly database of coastalflooding in the United Kingdom from 1915 to 2014, Sci. Data 2 (2015) 150021,http://dx.doi. org/10.1038/sdata.2015.21.
[41] Hemeroteca Digital, Hemerotecadigital.cm.lisboa.pt. N.p., 2017. Web. 17 Mar. 2017.
[42] N. Hilker, A. Badoux, C. Hegg, The Swissflood and landslide damage database 1972–2007, Nat. Hazards Earth Syst. Sci. 9 (2009) 913–925,http://dx.doi.org/10. 5194/nhess-9-913-2009.
[43] M.-L. Ibsen, D. Brunsden, The nature, use and problems of historical archives for the temporal occurrence of landslides, with specific reference to the south coast of Britain, Ventnor, Isle of Wight, Geomorphology 15 (1996) 241–258,http://dx.doi. org/10.1016/0169-555X(95)00073-E.
[44] INE.Population census 2011.Statistics Portugal, Lisbon, Portugal, 2011.〈[https:// www.ine.pt/]〉.
[45] INE. Transport Statistics 2010. Statistics Portugal, Lisbon, Portugal, 2011. 〈[https://www.ine.pt/]〉.
[46] IRGC. White paper on risk governance towards an integrative approach. 157p, 2006.〈[https://www.irgc.org/IMG/pdf/IRGC_WP_No_1_Risk_Governance__ reprinted_version_pdf]〉.
[47] ISO, Risk management– principles and guidelines (ISO 31000:2009), 2009. [48] S.N. Jonkman, J.K. Vrijling, Loss of life due tofloods, J. Flood Risk Manag. 1 (1)
(2008) 43–56,http://dx.doi.org/10.1111/j.1753-318X.2008.00006.x. [49] S.N. Jonkman, B. Maaskant, E. Boyd, M.L. Levitan, Loss of life caused by the
flooding of New Orleans after hurricane Katrina: analysis of the relationship be-tweenflood characteristics and mortality, Risk Anal. 29 (5) (2009) 676–698. [50] A. Klinke, O. Renn, Adaptive and integrative governance on risk and uncertainty,
J. Risk Res. 15 (3) (2012) 273–292,http://dx.doi.org/10.1080/13669877.2011. 636838.
[51] E.E. Koks, B. Jongman, T.G. Husby, W.J.W. Botzen, Combining hazard, exposure and social vulnerability to provide lessons forflood risk management, Environ. Sci. Policy 47 (2015) 42–52,http://dx.doi.org/10.1016/j.envsci.2014.10.013. [52] B. Kolen, R. Slomp, S.N. Jonkman, The impacts of storm Xynthia February 27–28,
2010 in France: lessons forflood risk management, J. Flood Risk Manag. 6 (2013) 261–278,http://dx.doi.org/10.1111/j.1539-6924.2008.01190.x.
[53] H. Kreibich, I. Seufert, B. Merz, A. Thieken, Development of FLEMOcs– a new model for the estimation offlood losses in the commercial sector, Hydrol. Sci. J. 55 (8) (2010) 1302–1314,http://dx.doi.org/10.1080/02626667.2010.529815. [54] K. Krippendorff, Content Analysis: An Introduction to Its Methodology, 2nd ed,
Sage Publications, Inc, ThousandOaks, CA, 0-7619-1544-3, 2004.
[55] La Red. DesInventar. Sistema de Inventario de desastres. Guıa Metodologica. La Red de Estudios Sociales en Prevencion de Desastres en America Latina. La Red, Lima, 2009.〈[http://www.desinventar.org/es/]〉.
[56] M.C. Llasat, M. Llasat-Botija, L. López, A press database on natural risks and its application in the study offloods in Northeastern Spain, Nat. Hazards Earth Syst. Sci. 9 (2009) 2049–2061,http://dx.doi.org/10.5194/nhess-9-2049-2009. [57] M.C. Llasat, M. Llasat-Botija, M. Barnolas, L. López, V. Altava-Ortiz, An analysis of
the evolution of hydrometeorological extremes in newspapers: the case of Catalonia, 1982–2006, Nat. Hazards Earth Syst. Sci. 9 (2009) 1201–1212,http:// dx.doi.org/10.5194/nhess-9-1201-2009(2009).
[58] J.P. Leitão, M.C. Almeida, N.E. Simões, A. Martins, Methodology for qualitative urbanflooding risk assessment, Water Sci. Technol. 68 (4) (2013) 829–838, http://dx.doi.org/10.2166/wst.2013.310.
[59] J. Leite. Restos de Colecção, 2016. (online).〈http://restosdecoleccao.blogspot.pt/ 〉(accessed in 28 November 2016).
[60] Lisbon South Bay, Lisbon South Bay.Lisbonsouthbay.com. N.p., 2017. Web. 17 Mar, 2017.
[61] I.M. Madaleno. Companhia das Lezírias– o passado e presente. Hispania Nova. Revista de História contemporánea, 6, 2006.〈http://hispanianova.rediris.es/6/ articulos/6a001.pdf〉.
[62] J. Marôco, Análise estatística com o SPSS statistics. ReportNumber, Pêro Pinheiro. ISBN 978-978-96763-4-3, 2014.
[63] Melbournbe Water. Melbourne Water Flood Risk Assessment: Howflood impacts are assessed in the Port Phillip and Westernport region, Australia. ISBN 978-1-921 603- 83-9, 2010.〈[https://www.melbournewater.com.au/whatwedo/ manageflooding/Documents/Flood_Risk_Assessment_Summary.pdf]〉.
[64] V. Meyer, N. Becker, V. Markantonis, R. Schwarze, R. M.van den Bergh, L. J. C. J., M. Bouwer, P. Bubeck, P. Ciavola, E. Genovese, C. Green, S. Hallegatte, H. Kreibich, Q. Lequeux, I. Logar, E. Papyrakis, C. P furtscheller, J. Poussin, V. Przyluski, A.H. Thieken, C. Viavattene, Review article: assessing the costs of natural hazards - state of the art and knowledge gaps, Nat. Hazards Earth Syst. Sci. 13 (2013) 1351–1373,http://dx.doi.org/10.5194/nhess-13-1351-2013. [65] A. Miller, S.N. Jonkman, M. Van Ledden, Risk to life due toflooding in
post-Katrina New Orleans, Nat. Hazards Earth Syst. Sci. 15 (2015) 59–73,http://dx. doi.org/10.5194/nhess-15-59-2015.