CARBON FOOTPRINT OF APPLE AND PEAR: ORCHARDS,
STORAGE AND DISTRIBUTION
Filipa Figueiredo1, Érica G. Castanheira1, Manuel Feliciano2, M. Ângelo Rodrigues2, António Peres2,Filipe Maia5, António Ramos3,4 João Carneiro3,4, Vlad C. Coroama1
and Fausto Freire1*
1: ADAI-LAETA (Center for Industrial Ecology) Department of Mechanical Engineering. University of Coimbra
Rua Luís Reis Santos, 3030-788 Coimbra, Portugal
*e-mail: [email protected], web: http://www2.dem.uc.pt/CenterIndustrialEcology/ 2: Mountain Research Centre (CIMO), ESA- Polytechnic Institute of Bragança
Campus de Stª Apolónia, Apartado 1172, 5301-854 Bragança, Portugal 3: Escola Superior Agrária de Castelo Branco
Qta. Sra de Mércules, Apartado 119, 6001-909 Castelo Branco, Portugal 4:CERNAS – Centro de Estudos de Recursos Naturais, Ambiente e Sociedade
5: School of Agriculture, Polytechnic Institute of Bragança Campus de Stª Apolónia, Apartado 1172, 5301-854 Bragança, Portugal
Keywords: Apple; Carbon footprint; Greenhouse gas; Life-cycle assessment; Orchards; Pear Abstract Apple and pear represent 51% of fresh fruit orchards in Portugal. This paper presents a life-cycle (LC) greenhouse gas (GHG) assessment (so-called carbon footprint) of 3 apple and 1 pear Portuguese production systems. An LC model and inventory were implemented, encompassing the farm stage (cultivation of fruit trees in orchards), storage and distribution (transport to retail). The functional unit considered in this study was 1 kg of distributed fruit (at retail). Four different LC inventories for orchards were implemented based on data collected from three farms. Inventory data from two storage companies were also gathered. The main results show that the GHG emissions of apple and pear ranged between 192 and 229 gCO2eq kgfruit-1. The GHG emissions (direct and indirect) from the
cultivation phase ranged from 36% to 60% of total emissions. Fruit storage, which lasted for as much as 8-10 months, was also responsible for significant emissions due to high energy requirements.
1. INTRODUCTION
Life-cycle assessment (LCA) is an established tool to assess the potential environmental impacts of products. Apple and pear represent 51% of fresh fruit orchards in Portugal [1]; however, no LCA was so far published for these types of fruits in Portugal. Some studies were performed for apple in several countries [2, 3, 4, 5] and two LCAs were published for pear in China and Switzerland [5, 6]. This paper presents a life-cycle (LC) greenhouse gas (GHG) assessment of 3 apple and 1 pear production systems in northern and central Portugal.
2. LIFE-CYCLE MODEL AND INVENTORY
The LC model and inventory implemented include the farm stage (cultivation of fruit trees in orchards), storage, and distribution (transport to retail). The functional unit considered in this study was 1 kg of distributed fruit (at retail). GHG emissions from the following sources were calculated: diesel combustion from agricultural operations, field N2O emissions (direct and indirect), and field CO2 emissions from urea application, on the basis of emission factors from [7, 8, 9]. Emissions from the production of agricultural inputs (emission factors from [7, 9, 10]), fruit transport between orchards and storage companies, and from distribution to retail were also considered.
Four different LC inventories for orchards were implemented based on data collected from three farms: one (“A”) in central and two (“B” and “C”) in northern Portugal. Orchard A produced apples (“Aa”: 22 ha) and pears (“Ap”: 7.4 ha). Orchards B (13 ha) and C (11 ha) produced apples. Table 1 shows the main input data for the orchards (years 2010 and 2011). The amount of pesticides is shown as a function of the active substance applied. Fruit picking was done manually with a couple of local workers, who travelled a maximum of 6 km to work. The energy required for this commute during the short collecting season was negligible and thus ignored.
Cold storage is essential to extend the life of fruit. Storage of apples and pears can go up to 8-10 months. Inventory data from two storage companies were collected (“S_A” in the center; “S_F” in the north), as shown in Table 2 for the years 2010 and 2011. Storage S_A is next to orchard A. S_F is 5 km far from orchard B and 2 km from C. Electricity consumption in S_F decreased significantly from 2010 to 2011 due to the installation of new fans and the adoption of a more efficient ventilation control program. Fruits from S_F were transported 215 km to retail in reusable plastic boxes (package not considered in the LCA). Fruits from S_A were transported 65 km to retail in non-reusable cardboard boxes (package accounted for).
3. RESULTS AND DISCUSSION
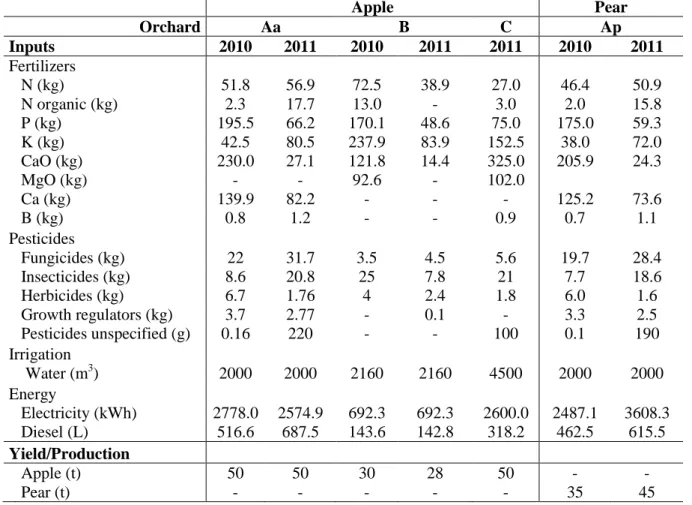
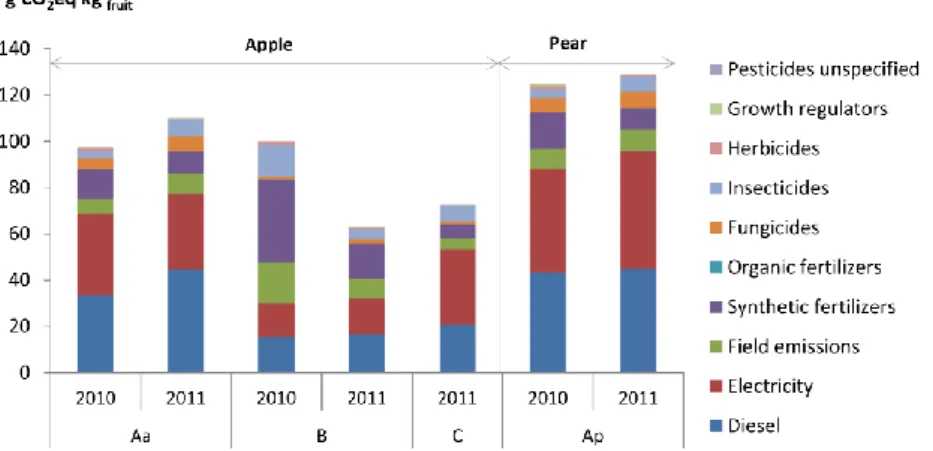
The cumulated GHG emissions of production, storage, and distribution for apple and pear varied between 192 and 229 g CO2eq kgfruit-1. Fig. 1 shows the GHG emissions (direct and indirect) of the cultivation phase, which ranges from 36% to 57% of total emissions. The lowest farming emissions were calculated for apples produced by orchard B in 2011, followed by C (+13%) and A (+ 35% in 2010 and + 43% in 2011). Cultivation of pears (Ap) induced slightly higher emissions than apple cultivation, essentially due to lower
productivity per hectare (as compared to Aa and C), or due to higher energy consumptio n (as compared to B). Main contributors to the cultivation phase were: diesel consumption for agricultural operations (16% to 40%), electricity used for irrigation (15% to 45%), production of fertilizers (7% to 36%), fertilization field emissions (7% to 18%), and the production of pesticides (10% to 17%). Apple Pear Orchard Aa B C Ap Inputs 2010 2011 2010 2011 2011 2010 2011 Fertilizers N (kg) 51.8 56.9 72.5 38.9 27.0 46.4 50.9 N organic (kg) 2.3 17.7 13.0 - 3.0 2.0 15.8 P (kg) 195.5 66.2 170.1 48.6 75.0 175.0 59.3 K (kg) 42.5 80.5 237.9 83.9 152.5 38.0 72.0 CaO (kg) 230.0 27.1 121.8 14.4 325.0 205.9 24.3 MgO (kg) - - 92.6 - 102.0 Ca (kg) 139.9 82.2 - - - 125.2 73.6 B (kg) 0.8 1.2 - - 0.9 0.7 1.1 Pesticides Fungicides (kg) 22 31.7 3.5 4.5 5.6 19.7 28.4 Insecticides (kg) 8.6 20.8 25 7.8 21 7.7 18.6 Herbicides (kg) 6.7 1.76 4 2.4 1.8 6.0 1.6 Growth regulators (kg) 3.7 2.77 - 0.1 - 3.3 2.5 Pesticides unspecified (g) 0.16 220 - - 100 0.1 190 Irrigation Water (m3) 2000 2000 2160 2160 4500 2000 2000 Energy Electricity (kWh) 2778.0 2574.9 692.3 692.3 2600.0 2487.1 3608.3 Diesel (L) 516.6 687.5 143.6 142.8 318.2 462.5 615.5 Yield/Production Apple (t) 50 50 30 28 50 - - Pear (t) - - - 35 45
Table 1. Main input data and yields of apple and pear cultivation (per hectare).
Table 2. Input data (per kg of fruit) of fruit storage.
Storage S_A S_F Inputs 2010 2011 2010 2011 Electricity (kWh) 0.11 0.10 0.21 0.10 Propane (g) - - 0.07 0.04 Glycol (ml) - - 0.02 0.01 Boxboard (kg) 0.05 0.05 - - Water (L) 0.07 0.04
Figure 1. GHG emissions of apple and pear orchards (per kg of fruit).
Fig. 2 shows the GHG emissions of storage, package and distribution. The 2011 storage emissions were very similar for the two companies (S_A storage accounting for 30% to 38% and S_F storage 31% to 33% of the total LC emissions). Unlike other food systems, the long-term storage of apples and pears is responsible for significant emissions due to high electricity requirements, since it can last for up to 8-10 months. Figure 2 also shows the significant reduction in S_F storage emissions from 2010 to 2011 due to the major changes in the ventilation system (results from 2010 were not further analyzed). Finally, distribution from the storage S_A represents less than 9% of the total LC emissions, while distribution from S_F accounts for around 30%. Our results are consistent with previous LCA studies for fruit orchards production systems in other countries. For example, Stoessel et al., [5] and Liu et al., [6] calculated 82-364 g CO2 kgfruit-1 for cultivation, storage and distribution. Mouron et al., [3] and Milà i Canals et al., [4] only studied the cultivation phase for apples and calculated emissions in the range 40-100 g CO2 kgfruit-1.
ACKNOWLEDGEMENTS
This research was supported by project ECODEEP (Eco-efficiency and Eco-management in the Agro Industrial sector, FCOMP–05–0128–FEDER–018643) and the Portuguese Science and Technology Foundation projects: MIT/SET/0014/2009, PTDC/SEN-TRA/117251/2010.
REFERENCES
[1] INE, I.P., Recenseamento Agrícola 2009 - Análise dos principiais resultados, Instituto Nacional de Estatística, I.P., Lisboa, Portugal, 2009.
[2] P. Mouron, R. W. Scholz, T. Nemecek, and O. Weber, Life cycle management on Swiss fruit farms: Relating environmental and income indicators for appl e-growing. Ecological Economics, vol. 58(3), pp. 561–578, 2006.
[3] P. Mouron, T. Nemecek, R. W. Scholz, and O. Weber, Management influence on environmental impacts in an apple production system on Swiss fruit farms: Combining life cycle assessment with statistical risk assessment, Agriculture, Ecosystems & Environment, vol. 114(2-4), pp. 311–322, 2006.
[4] L. Milà i Canals, G. M. Burnip, and S. J Cowell, Evaluation of the environmental impacts of apple production using Life Cycle Assessment (LCA): Case study in New Zealand, Agriculture, Ecosystems & Environment, vol. 114(2-4), 2006.
[5] F. Stoessel, R. Juraske, S. Pfister, and S. Hellweg, Life cycle inventory and carbon and water FoodPrint of fruits and vegetables: application to a Swiss retailer, Environmental science & technology, vol. 46(6), pp. 3253–3262, 2012.
[6] Y. Liu, V. Langer, H. Høgh-Jensen, and H. Egelyng, Life Cycle Assessment of fossil energy use and greenhouse gas emissions in Chinese pear production, Journal of Cleaner Production, vol. 18(14), pp. 1423–1430, 2010.
[7] T. Nemecek, T. Kägi, S. Blaser, Life Cycle Inventories of Agricultural Production Systems, Ecoinvent report version 2.0, Vol. 15, Swiss Centre for LCI, ART, Duebendorf and Zurich, 2007.
[8] IPCC, IPCC Guidelines for National Greenhouse Gas Inventories - volume 4: Agriculture, Forestry and Other Land Use, Intergovernmental Panel on Climate Change (IPCC), Hayama, Japan, 2006.
[9] N. Jungbluth, Erdöl. Sachbilanzen von Energiesystemen, Final report No. 6 ecoinvent data v2.0, Editors: Dones R., Vol. 6, Swiss Centre for LCI, PSI, Dübendorf and Villigen, 2007.
[10] A. Patyk and G. A. Reinhardt, Düngemittel - Energie- und Stoffstrombilanzen, Braunschweig/Wiesbaden, Germany: Vieweg Verlagsgesellschaft, 1997.