Analysis of student´s proficiency evaluation model for adaptative testing
Analysis of student's proficiency evaluation model for adaptive testing
DOI:10.34117/bjdv6n3-077
Recebimento dos originais: 29/02/2020 Aceitação para publicação: 06/03/2020
Heitor Melo de Lucas Brandão ECEC, PUC Goiás
Av, Universitária 1.440, Setor Universitário Goiânia-GO, CEP: 74605-010 E-mail:[email protected]
Leonardo Guerra de Rezende Guedes MDPT, PUC Goiás & EMC, UFG
Av, Universitária 1.440, Setor Universitário Goiânia-GO, CEP: 74605-010 E-mail:[email protected]
Olegário Corrêa da Silva Neto ECEC, PUC Goiás
Av, Universitária 1.440, Setor Universitário Goiânia-GO, CEP: 74605-010 E-mail:[email protected]
Eugênio Julio Messala Cândido Carvalho ECEC, PUC Goiás
Av, Universitária 1.440, Setor Universitário Goiânia-GO, CEP: 74605-010 E-mail:[email protected]
RESUMO
A evolução da Internet e sua adoção transformou e continua transformando cada vez mais o contexto humano e, a educação, também está inserida nessa situação. Devido a isso, há ferramentas de apoio ao estudante, como sistemas avaliativos online. Apresentaremos nesse trabalho os resultados da simulação de uma avaliação online feita por um aluno com dada proficiência, a fim de coletar todos os dados a respeito do desempenho deste aluno – sua nota final – utilizando a teoria de Resposta ao Item em duas abordagens para cômputo da nota final. Uma primeira abordagem usando a questão subsequente a uma respondida de um nível de dificuldade superior ou inferior dependendo do acerto da questão anterior. E uma segunda usando a questão subsequente a uma respondida de um nível de dificuldade entre a anterior e a do limite máximo ou mínimo dependendo do acerto da questão anterior. Foram analisados resultados de simulação para diferentes tamanhos de provas e para diferentes proficiências dos respondentes simulados. Após análise multivariada de clusterização dos resultados por K-means, verifica-se que ambas as abordagens são subótimas para situações diferentes de tamanhos de prova na busca da nota final mais próxima da proficiência simulada.
Palavras Chaves: Modelo Avaliativo. Avaliação de Proficiência, Teoria de Resposta ao item, Testes Adaptativos Informatizados.
ABSTRACT
The evolution of the Internet and its adoption transformed and continuous transformation of the human context, and education is also inserted in this situation. From this, there are student support tools like online evaluation systems. The paper presents results from an online evaluation of student
proficiency, in order to collect all data and compute the student's performance - as their final grade - using the Item Response Theory. Two approaches to the final grade calculation were analyzed. The first approach, using a subsequent question of a higher or lower difficulty level, depending on the previous one. And a second, using a subsequent question of a difficulty level between the previous and the upper or lower minimum, depending on the previous occurrence. Simulation results were analyzed for different test sizes - different amount of questions - and for different skills of simulated respondents. After multivariate clustering analysis by K-means, it is verified that both approaches are suboptimal for different test size situations in the search for the final grid closest to the simulated original proficiency.
Keywords: Evaluative Model. Proficiency Assessment, Item Response Theory, Computerized Adaptive Testing.
1 INTRODUCTION
The teaching-learning process is always with in a process of improvement, therefore, it is necessary to use technologies that support this modality. In this sense, evaluative methods are an important study object. Therefore, it is advisable to thoroughly test, by simulation, evaluative models in order to be able to empirically and statistically analyze whether a computerized assessment method is effective in determining a student's proficiency in a particular subject or content, and to assist in diagnosing the application of active educative methodologies (by Rezende Guedes, Cordeiro & Fleury, 2015).
Walter et al. (2019), when assessing the proficiency of Production Engineering students at Enade/2014, postulate that “Given the importance of educational assessment, research that can study the quality of assessment in teaching is essential”.
The application of computerized tests allows us to evaluate not only their proficiency, but also the psychosocial representation of students in the dimensions of teamwork, the multidisciplinary aspect of the test, learning and leadership in group work (de Rezende Guedes & dos Santos, 2019). This work proposes to evaluate, by means of a test simulation algorithm, the effectiveness of two approaches using the Item Response Theory to compute the final grade of evaluative tests in the Computerized Adaptive Tests. To determine the effectiveness of the approach for comparative purposes, the simulations seek the median difficulty levels of the questions whose answer was simulated, comparing it with the student's proficiency level in the subject that was simulated.
The Item Response Theory (IRT) consists of an evaluative model whose objective is to evaluate student performance through the relationship between the probability of the student hitting an item from the student's ability, thus allowing a personalized assessment of the student and not generalist as conventionally adopted. This test theory computes the hits by a one-dimensional three- parameter logistic model considering discrimination, difficulty, and casual hit parameters that generate graphs of the item characteristic curve and item information curve. (Ferreira, 2018).
The IRT, makes the assessment more congruent with the student because he will analyze how difficult (probability of getting it right) the question to be asked by the student using as a parameter his ability and the difficulty of the question, which is the basis of the model used. by the algorithm and proposed by the Danish mathematician Georg Rasch by the formula described below:
1 𝑃𝑖(𝜃) =
1 + 𝑒𝑥𝑝−1(𝜃−𝑏𝑖)
𝑃𝑖(𝜃) is the probability of a proficient student 𝜃, reply to an item i correctly; 𝑏𝑖 is the difficulty index of the item.
The values of 𝜃 and 𝑏𝑖 they contemplate mastery between -2.0 and +2.0, with increasing levels of
difficulty and skill.
There are two models proposed by Santos & Guedes (2005) for computerized assessment, which differ in the way the student selects the next item, and both propose the idea of making the assessment intrinsic with the student's performance in certain questions. difficulty level.
2 METHODOLOGY
For the simulation of adaptive testing in both approaches, three algorithm versions were developed as an evolution of each other. All versions have the same basic logical structure, improving only features of the random sort order method for Bubble Sort, for Quick, all of which were implemented in the C ++ language.
The first version of the algorithm provides a simulation of two tests - one from Approach I and one from Approach II - with the number of questions determined at run time in order to test the search for the appropriate level questions from the level calculation. of the question to be sought corresponding to each modality. Thus, the algorithm only simulates the test by adopting 50% chance for any question regardless of the student's ability and the level of the questions, i.e. the goal is to simulate if the algorithm correctly searches for the appropriate level questions.
Evaluative Approach I
In this first approach, there is a previously registered item bank, in which there are questions of various difficulty levels, ranging from zero (0) to ten (10). Being questions close to zero (0) considered easy and questions close to ten (10) considered difficult, in which the levels of these questions are initially registered by a teacher.
Initially, the appraiser starts by making a level 5 item and when he hits, the next question will have 1 more difficulty level while missing the next question decreases the difficulty level by 1. Thus, the system will always be trying to challenge the student until he finds the level of difficulty that he is best able to do and, from that, conclude on the student's performance in the assessment.
2
2
2
For example, if a student starts the level 5 test, he or she answers two questions (the initial and the level 6 test, made available after the level 5 test) in succession, thus will be awarded a difficulty 7 question and if he / she err, it will return to a level 6 question.
Therefore, it is clear that this approach seeks the median level of questions asked by the student incrementally, because of this, regardless of the order in which the student hit 'x' items and missed 'y' his last level will be: 5+(x-y), thus making outliers impossible by analyzing only the level of the last question, thus allowing to use the last level made by the student for another analysis. Evaluative Approach II
In this approach, as in Approach I, there are a set of issues registered with their difficulties that may vary in the same way as in the first model and the evaluation starts at level 5.
However, the process of transition from the level of one question to another is different, because in addition to importing the level of the previous question matters whether the student got it right or not.
Thus, whenever the student hits a question regardless of whether he has hit the previous one or not, the level of the next question will be given by:
𝑛
𝑛𝑒𝑤=
𝑛
𝑎𝑐𝑡𝑢𝑎𝑙+ 𝑛
𝑚𝑎𝑥If the student answers a question incorrectly but correctly answered the previous question, the level of the next question will be given by:
𝑛
𝑛𝑒𝑤=
𝑛
𝑎𝑐𝑡𝑢𝑎𝑙+ 𝑛
𝑜𝑙𝑑While if the student misses twice in a row the next question level will be:
𝑛
𝑛𝑒𝑤=
𝑛
𝑎𝑐𝑡𝑢𝑎𝑙+ 𝑛
𝑚𝑖𝑛As an example, the student starts the test at level 5 and answers this question, so, by the first rule, he will ask a level 7.5 question but as working with integer values rounds up (8), later that student misses the level 8 question, leading to the first error rule, averaging between the current level (8) and the previous question (5) resulting in 6.5 but when the student misses rounds down, then (6) and if he misses again it will be the case of the second error rule by averaging between the current level (6) and the minimum level 0, thus 3 and hence 3.
3 ALGORITHM DEVELOPMENT
The algorithm uses a random search system, that is, when during the evaluation, it was calculated that the next question should be at level X of difficulty, it starts to draw among the level x questions that were not drawn one to be used in the test. This operation consumes a long time, since the function that generates random number generates many repeated numbers.
The second version of the algorithm aims to make the search function more efficient and implement a new functionality: calculate the median of the levels made by the student. Thus, in order to solve the problem of excessive time spent by the item search function, a function was implemented in this function to search for an appropriate question (of the corresponding level and not used in this) sequentially if the random function does not. found a new unused question after N/4 times, where N is the number of questions at that level.
Meanwhile, the new functionality was implemented by storing the question levels at runtime and then sorting those levels by the Bubble Sort method, however this also slowed the algorithm due to its complexity extending the runtime.
The final version of the algorithm aimed to optimize the execution time and also to implement a new functionality capable of determining the amount of calibration questions, that is, the number of questions that could be disregarded without changing the median. Recalling that the principle of the algorithm is to have the median level similar to the student's proficiency level, which is initially provided in the program.
Thus, in order to make execution more efficient and spend less time, the sorting method from Bubble Sort to Quick Sort was changed .While to make the assessment congruent with the IRT, the student's probability of hitting the item is given by the student's ability (initially provided in program execution) and the difficulty level of the question as presented in topic 2 (“Item Response Theory”). ). Since proficiency the difficulty level of the questions is converted to their mastery in Georg Rasch's formula by calculating:
𝑋 = ( 𝑥 2.5 − 2)
X is proficiency 𝜃 or the question level in a domain from -2 to +2 X is proficiency 𝑏𝑖 or the question level in a domain from 0 to 10
The algorithm decides whether the student gets the questions right or not by calculating the probability of the student getting it right by Georg Rasch's formula and by the following process: If P(X) is the chance to hit a question, draw a number between 0 and 1, if the number drawn is greater than (1-P(X)) it is determined that the student hit the question otherwise he missed.
4 PSEUDOCODE Main () {
TAM = No Questions; Skill = No. Proficiency;
Mat [TAM] [11] = Matrix Allocation (); vetModel1 [TAM] = AllocateVector (); vetModel2 [TAM] = AllocateVector (); mediaMedian1 [TAM] = AllocateVector (); mediaMediana2 [TAM] = AllocateVector (); mediaCalibration1 [TAM] = AllocateVector (); mediaCalibration2 [TAM] = AllocateVector ()
vetModel1 = modelOne (mat, skill, TAM); // execute Approach I and return a vector with the levels made
vetAux1 = vetModel1; // auxiliary vector to save the sequence of levels made. zera_control_questions ();
vetModel2 = modelTwo (mat, skill, TAM); executes Approach II and returns a vector with the levels made
vetAux2 = vetModel1;
sort_vector (vetModel1); // sort the levels in ascending order sort_vector (vetModel2);
Median1 = calculate_Median (vetModel1); Median2 = calculate_Median (vetModel2); Calibration1 = calculate_ Calibration (vetAux1); Calibration2 = calculate_ Calibration (vetAux2); showResults ();}
int * modelOne (mat [TAM] [11], skill, TAM) { vet [TAM] = allocateVector ();
level = 5; counter = 0; to 0 to TAM {
vet [] = level; // store the levels made while (1) {
random = draw ()% TAM // draw number between 0 and TAM
if (counter == TAM / 4) { while (1) {
question = sequential search (mat [] [level]); // search question in the indicated level column if (question.control == 0) breaks; }}
if (question.control == 0) breaks; }
probAcerto = probability_Acerto (skill, level); probe = 1-probAcerto;
if (hit <= probability) hit = 0; // missed the question otherwise hit = 1; // hit the question
mat [random] [level] .control = 1; if (hit) {
if (level <10) level ++; if no{
if (level> 0) level--;}} return vet;}
int * modelTwo (mat [TAM] [11], skill, TAM) { vet [TAM] = allocateVector ();
level = 5; counter = 0;
vet [] = level; // store the levels made while (1) {
random = draw ( )% TAM // draw number between 0 and TAM
++ counter; // count how many times you searched for a question by mat [random] [level] if (counter == TAM / 4) {
while (1) {
question = sequential_fetch (mat [] [level]); // search question in level column if (question.control == 0) breaks; }}
if (question.control == 0) breaks; }
probAcerto = probability_Acerto (skill, level); probe = 1-probAcerto;
if (hit <= probability) hit = 0; // missed the question otherwise hit = 1; // hit the question
mat [random] [level] .control = 1; if (hit) {
if (level == 9) {
previous level = 9; // save the previous level anterior = 1; // hit the last question
level = 10;} otherwise { anterior = 1;
previous level = level;
aux = (((float) level + 10) / 2); level = ceil (aux); // round up}} otherwise {// missed the question if (i == 0) {// first question
aux = (level + Previous level) / 2; level = floor (aux); // round down Previous level = 5;} otherwise { if (level == 1) { level = 0; Previous level = 1;} otherwise {
if (previous) {// hit last
aux = ((float) level + (float) Previous level) / 2; previous level = level;
level = floor (aux);} otherwise {
previous level = level; aux = (float) level / 2; level = floor (aux);}}} previous = 0;}}
return vet;}
5 ANALYSIS AND RESULTS
The tests were performed by simulating 20 consecutive tests of each skill ((0), (3), (5), (6), (7), (8), (9) and (10)), for each test size. with (5), (10), (15), (20), (25), (30), (35) and (40) questions, making it possible to draw some conclusions regarding the two types of evidence.
The algorithm calibration was performed obtaining the amount of initial questions that could be disregarded without changing the student's median levels, thus contributing to an assessment that finds the student's level faster.
Median data and their averages are finally processed using the k-means Clustering technique, which consists of randomly fixing k centroids, one for each group, associating each county with its nearest centroid. Therefore, its objective in the present study is to classify and group the quantities and questions into two distinct clusters , according to the median characteristics calculated by the algorithm.
Regarding classification in clusters, Cassiano (2014, p. 59) adds that "[…] elements that make up the same cluster must have high similarity but must be very dissimilar from objects of other clusters. In other words, all clustering is done to maximize homogeneity within each cluster and maximize heterogeneity between clusters . "
Thus, the proofs of the same cluster tend to be like each other, however, they are different from others that make up the other clusters.
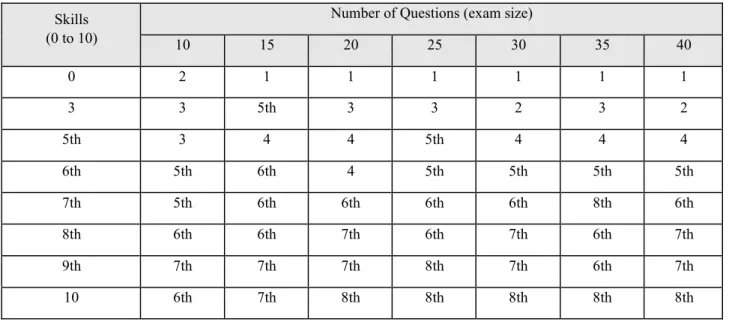
Table 1 below shows the means of the medians obtained when a student of ability provided by the row (from the table) made a proof of size given by the columns and applied to them the Approach I.
Table 1: Median Average by Approach I
Skills (0 to 10)
Number of Questions (exam size)
10 15 20 25 30 35 40 0 2 1 1 1 1 1 1 3 3 5th 3 3 2 3 2 5th 3 4 4 5th 4 4 4 6th 5th 6th 4 5th 5th 5th 5th 7th 5th 6th 6th 6th 6th 8th 6th 8th 6th 6th 7th 6th 7th 6th 7th 9th 7th 7th 7th 8th 7th 6th 7th 10 6th 7th 8th 8th 8th 8th 8th
Table 2 shows the averages of the calibrations obtained when a student of ability provided by the row (from the table) made a size test given by the columns (from the table) and applied to them the Approach I.
Table 2: Average of Calibrations by Approach I
Skills (0 to 10)
Number of Questions (exam size)
10 15 20 25 30 35 40 0 0 1 1 2 2 2 3 3 2 0 1 3 2 3 2 5th 1 1 1 2 2 3 2 6th 0 2 1 2 2 3 3 7th 0 1 1 3 2 5th 2 8th 1 3 1 2 1 3 3 9th 0 1 1 1 2 3 3 10 0 2 1 2 1 3 3
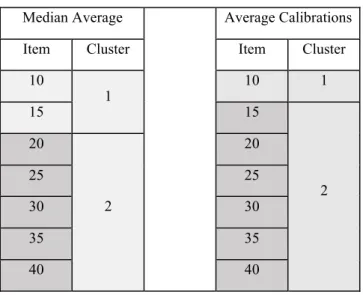
After the simulation for Approach I, the k-means clustering technique was applied, which divided the results into two result clusters as follows:
Table 3: Analysis of Approach 1 by k-means Median Average Average Calibrations Item Cluster Item Cluster
10 1 10 1 15 15 2 20 2 20 25 25 30 30 35 35 40 40
Thus, it appears that Approach 2 produces better results from 25 questions evaluated. Table 4 shows the means of the medians applying Approach II to the questions.
Table 4: Median Average by Approach II
Skills (0 to 10)
Number of Questions (exam size)
10 15 20 25 30 35 40 0 2 2 2 2 2 2 2 3 4 5th 4 4 4 4 4 5th 4 5th 5th 6th 5th 6th 6th 6th 6th 6th 6th 6th 6th 6th 6th 7th 6th 7th 7th 7th 7th 8th 7th 8th 7th 7th 7th 7th 8th 6th 7th 9th 7th 8th 8th 8th 8th 7th 8th 10 7th 8th 9th 9th 8th 8th 8th
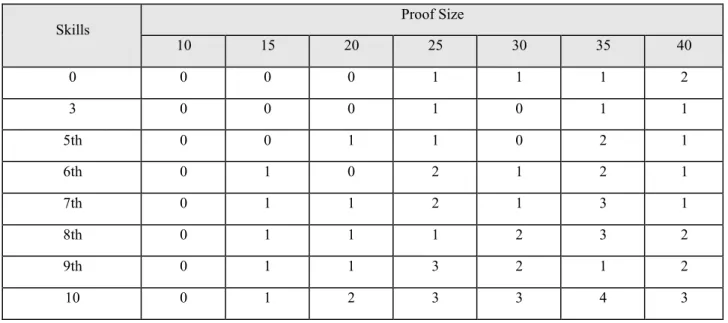
Table 5 presents the calibrations, but in this test the Approach II was applied to the questions.
Table 5: Average of calibrations by Approach II
Skills Proof Size
10 15 20 25 30 35 40 0 0 0 0 1 1 1 2 3 0 0 0 1 0 1 1 5th 0 0 1 1 0 2 1 6th 0 1 0 2 1 2 1 7th 0 1 1 2 1 3 1 8th 0 1 1 1 2 3 2 9th 0 1 1 3 2 1 2 10 0 1 2 3 3 4 3
After the simulation for Approach II, the k-meas clustering technique was applied, which divided the results into two result clusters as follows:
Table 6: Analysis of Approach 1 by k-means Median Average Average Calibrations Item Cluster Item Cluster
10 1 10 1 15 15 30 2 20 35 25 2 40 30 20 35 20 40
For the simulations of Tables 1, 2, 4 and 5 and for the clustering of Tables 3 and 6 we observe the following.
Approach II in 65% of cases offered the student a median of their levels higher than Approach I, while Approach I had 0% of the time and in 35% had the same median.
Approach II in 56% of cases had the median values closer to the given proficiency, while Approach II had 15% of cases with closest values and, consequently, 29% were similarly similar.
Approach I had 56% of cases with greater calibration than Approach II while Approach I achieved greater calibration in 9% of cases and therefore the calibration was the same for 35% of cases. This was confirmed by clustering many proof sizes into one cluster (only the smallest proof was in an isolated cluster).
6 CONCLUSION
Thus, it is observed that the algorithm can adequately simulate both Test Modalities and be congruent with the proposed in the IRT. Thus, it is possible for an education professional to use the algorithm to understand how a certain condition of a test to be applied would work in order to ascertain whether it is the most appropriate context to apply such an assessment. As well as figuring out the optimal number of calibration questions to make the test more objective and effective.
Approach II provides greater median results than Approach I, so by simulating it can be concluded that to evaluate students with more difficult questions or to have a more congruent test with a student of skill level high approach Approach II should be used.
Approach II was also more accurate as the median values were close to the student's skill level.
While Approach I proved to be more suitable for shorter tests, as it needs fewer questions to arrive at the median to be developed, as it allows more calibration questions, ie more questions can be removed from the evaluation without undermine the median levels of the questions.
Future work of this research group is suggested the real application of the computerized test in more than one class of students of the same discipline for calibration and proficiency measurement using both approaches aiming to validate the postulated one.
REFERENCES
Cassiano, K. M. (2014). Análise de Séries Temporais Usando Análise Espectral Singular (SSA) e Clusterização de Suas Componentes Baseada em Densidade. 2014.172 f. Tese (Doutorado) – Departamento de Engenharia Elétrica, Pontifícia Universidade Católica do Rio de Janeiro.
Ferreira, E. A. (2018). Teoria de Resposta ao Item–TRI: análise de algumas questões do ENEM: habilidades 24 a 30.
de Rezende Guedes, L. G., Cordeiro, A. M., & Fleury, N. B. (2015). Um Método para o Diagnóstico das Habilidades Gerenciais de Egressos em Engenharia como Subsídio ao Arefeiçoamento de Projetos Pedagógicos no Escopo da Gestão: Um Estudo de Caso. International Journal on Alive Engineering Education, 2(2), 71-83.
de Rezende Guedes, L. G., & dos Santos, J. P. A. (2019). Diagnóstico e avaliação da aplicação de metodologias ativas nos cursos de engenharia da pontifícia universidade Católica de Goiás e da Universidade Federal de Goiás/Diagnosis and evaluation of active methodologies application at the pontifical catholic university of Goiás and the Federal university of Goiás’ Engineering Courses. Brazilian Journal of Development, 5(9), 16897-16910.
Santos, F. D., & de Rezende Guedes, L. G. (2005). Testes Adaptativos Informatizados baseados em teoria de resposta ao item utilizados em ambientes virtuais de aprendizagem. RENOTE, 3(2).
Walter, O. M. F. C., Henning, E., Konrath, A. C., Bornia, A. C., & de Menezes Sternadt, J. (2019). Avaliação da proficiência dos alunos de Engenharia De Produção do Enade/2014 por meio da Teoria da Resposta ao Item. Revista de Ensino de Engenharia, 39(2).