FUNCTION ANALYSIS OF CHINESE STOCK “BAROMETER”
KAIAN CHU
Dissertation submitted as partial requirement for the conferral of Master in Finance
Supervisor:
Prof. António Freitas Miguel, ISCTE Business School, Department of Finance,
FUNCTION ANALYSIS OF CHINESE STOCK “BAROMETER”
Abstract
This thesis studies the function of the “barometer” of the Chinese stock market, a market with a development history of only 20 years We use theoretical analysis and empirical test methods to select seven indicators: Shanghai Composite Index Year-on-Year Growth Rate, Social Consumer Goods Retail Total Year-on-Year Growth Rate, Consumer Price Index Year-on-Year Growth Rate, Total Imports and Exports Year-on-Year Growth Rate, Industrial Value-Added Year-on-Year Growth Rate, Broad-Term Money Supply Year-on-Year Growth Rate, Bank 6 Months to 1 Annual Loan Base Rate. Finally, this paper analyses a VAR vector auto regressive model. The results indicate that there is no significant relationship between the operation of the Chinese stock market and the trends of the macroeconomy. The stock market does not effectively reflect the changes in the macroeconomy although playing an effective leading role for the trend of the macroeconomy. Therefore, the Chinese stock market “barometer" function is not significant.
Key Words: Barometer, Stock Market, Macroeconomics, VAR Model JEL Classification: G14, G17
FUNCTION ANALYSIS OF CHINESE STOCK “BAROMETER”
Resumo
Esta tese estuda a função do “barómetro” do mercado acionista chinês, um mercado com um historial de apenas 20 anos. Utilizamos métodos teóricos empíricos para selecionar sete indicadores: o crescimento anual do Shanghai Composite Index , a taxa de Crescimento Anual do Índice de Retalho de Bens de Consumo, a Taxa de Crescimento Anual do Índice de Preços ao Consumidor, a Taxa de Crescimento anual das Importações e Exportações Totais, a Taxa de Crescimento anual do Valor Agregado Industrial, a Taxa de Crescimento Anual da Oferta Monetária de Longo Prazo, e a Taxa de base de empréstimos de 6 meses a 1 ano. Finalmente, este artigo analisa um modelo VAR. O estudo conclui que não há relação significativa entre a operação do mercado acionista chinês e as tendências da macroeconomia. O mercado acionista não reflete efetivamente as mudanças na macroeconomia mas desempenha um papel de liderança importante para a tendência da macroeconomia. Portanto, a função "barómetro" do mercado de ações chinês não é significativa.
Palavras-chave: Barómetro, Mercado de ações, Macroeconomia, Modelo VAR Classificação JEL: G14, G17
FUNCTION ANALYSIS OF CHINESE STOCK “BAROMETER”
Acknowledgement
First of all, I would like to express my appreciation to my supervisor, Prof. António Freitas Miguel for his patient and expert guidance. Thanks a lot for all the helpful suggestions and support. I am very grateful to have such a responsible and inspiring supervisor. Moreover, I thank my friends in Lisbon a lot for their company and support. I thank them for bringing so many smiles and so much happiness to my master, and for giving me courage to try something new. Finally, I appreciate all the encouragement and selfless support from my family.
FUNCTION ANALYSIS OF CHINESE STOCK “BAROMETER” Index of content Abstract ... 1 Resumo ... 2 Acknowledgement ... 3 1. Introduction ... 7 1.1 Thesis innovation ... 8
1.2 Research methods and structures ... 8
Figure 1 Frame of thought ... 10
2. Literature review ... 11
3. Chinese stock market overview and "barometer" functional theory discussion ... 16
3.1 Development of China's stock market ... 16
3.1.1 The history of Chinese stock market development ... 16
Table 1 - China shares ticket market development process phase division ... 16
3.1.2 China's stock market development status ... 17
3.2 Stock market barometer the theoretical approach to functionality ... 18
3.2.1 Barometer definition ... 18
3.2.2 Stock market on macroeconomic trends reflection ... 18
Figure 2 Reflection of the stock market on macroeconomic trends ... 19
3.2.3 The leading role of the stock market in macroeconomics ... 20
4. Empirical design and model ... 22
4.1 Data and variables ... 22
4.1.1 Data source and processing ... 22
Table 2 Indicator code description ... 23
4.1.2 Stock market variables ... 23
4.1.3 Macroeconomic Variables ... 23
4.2 Methodology ... 25
5. Empirical analysis and results ... 28
5.1 Stock market barometer functional criteria ... 28
5.2 ADF test results ... 28
Table 3 Variable’s ADF quarantine ... 29
5.3 VAR model creation and validation ... 29
Table 4 The result of a delay order ... 30
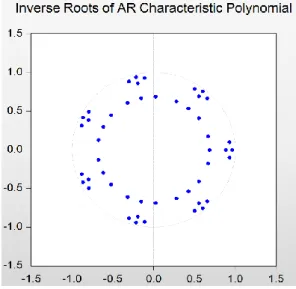
Figure 3 VAR trajectory map for all feature roots in the model ... 30
5.4 Granger causality test ... 31
5.4.1 Test results ... 31
FUNCTION ANALYSIS OF CHINESE STOCK “BAROMETER”
Table 6 Granger causality test to macroeconomic indicators ... 32
5.5 VAR impulse response analysis ... 38
5.5.1 Pulse response results ... 38
Figure 4 Impact of consumer price index on Shanghai stock index ... 39
Figure 5 Impact of industrial value added on Shanghai stock index ... 39
Figure 6 Impact of broad money supply on Shanghai composite index ... 39
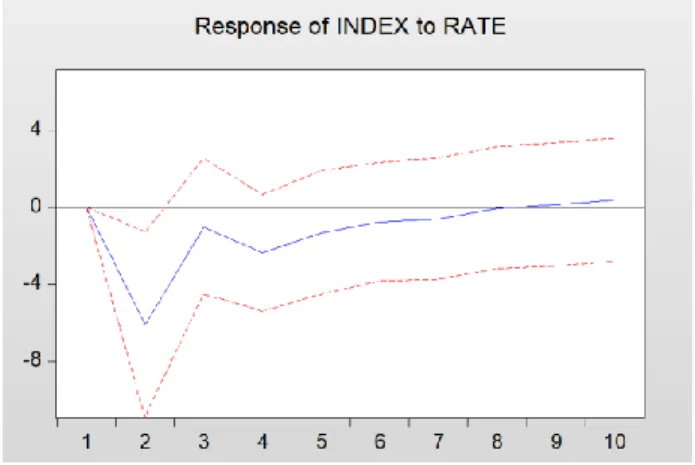
Figure 7 Impact of the bank's 6-month to 1-year benchmark interest rate on the Shanghai composite index ... 40
Figure 8 Impact of Shanghai stock index on consumer price index ... 40
Figure 9 Impact of Shanghai stock index on industrial value added ... 40
Figure 10 Impact of Shanghai stock index on broad money supply ... 41
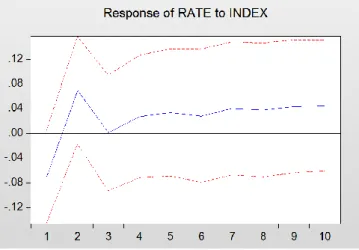
Figure 11 Impact of Shanghai composite index on bank's 6-month to 1-year baseline interest rate ... 41
5.6 VAR variance analysis ... 43
5.6.1 Variance decomposition results ... 43
Table 7 Index variance decomposition output table ... 44
6. Overall results and recommendations ... 46
6.1 Empirical results ... 46
6.2 Genesis analysis ... 46
6.3 Policy recommendations ... 48
7. Conclusion ... 50
References ... 51
Appendix 1 Underlying data... 53
FUNCTION ANALYSIS OF CHINESE STOCK “BAROMETER”
Index of figures and tables
Figure 1 Frame of thought ... 10
Table 1 China shares ticket market development process phase division ... 16
Figure 2 Reflection of the stock market on macroeconomic trends ... 19
Table 2 Indicator code description ... 23
Table 3 Each variables 's ADF quarantine ... 29
Table 4 The result of a delay order ... 30
Figure 3 VAR trajectory map for all feature roots in the model ... 30
Table 5 Granger causality test (Shanghai index for variable) ... 32
Table 6 Granger causality test (because variables are macroeconomic indicators) ... 32
Figure 4 Impact of consumer price index on Shanghai stock index ... 39
Figure 5 Impact of industrial value added on Shanghai stock index ... 39
Figure 6 Impact of broad money supply on Shanghai composite index ... 39
Figure 7 Impact of the bank's 6-month to 1-year benchmark interest rate on the Shanghai composite index ... 40
Figure 8 Impact of Shanghai stock index on consumer price index ... 40
Figure 9 Impact of Shanghai stock index on industrial value added ... 40
Figure 10 Impact of Shanghai stock index on broad money supply ... 41
Figure 11 Impact of Shanghai composite index on bank's 6-month to 1-year baseline interest rate ... 41
Table 7 Index variance decomposition output table ... 44
Appendix 1 Underlying data ... 53
1. Introduction
In recent years, China's macroeconomic operation has been basically stable. Economic growth has remained within a reasonable range, but the lack of sustained investment growth, constraints on financing bottlenecks, business difficulties and other problems, the economic downward pressure and risk is still large. The traditional economic cycle forecasts are based on the economic analysis of the overall economic variables, and in recent years foreign academic studies (see, e.g., Chong, 2012) have shown that the overall economic variables cannot predict the trends of economic change, especially when the economy begins to show a recession.
At the same time, foreign scholars find that the trend of stock market and the macroeconomy have intrinsic and inevitable connection, that the stock market is a leading factor in other economic variables that can make a predetermined direction of economic changes, with an economic "barometer" function (see, e.g., Gu, 2014). China's stock market since the last century, era has been developed for more than 20 years, but its maturity is still low, often the phenomenon of higher market volatility, the operation of the stock market has shown a high degree of instability since the establishment of the stock exchange and the commencement of trading. This has disturbed the internal relations with the macroeconomic trend to some extent, so that the "barometer" function of Chinese stock market has been questioned and disputed gradually, and this is not conducive to the long-term development of China's stock market.
As the founder of the Wall Street Journal, Charles Dau first put forward the "barometer" effect of the stock market. The trend of stock market and macroeconomy should be synchronized fundamentally, economic operation decides the operation of stock market, the change of stock market reflects the change of economy, at the same time, the operation of stock market should have certain forecast and indication function. However, as an emerging market, China's stock market in both maturity and policy color has a strong particularity, from the Western stock market economic "barometer" function, the applicability of this to the Chinese market is still unknown. Whether the "barometer" function of Chinese stock market can be fully embodied by China is still to be explored. Therefore, in order to promote the smooth development of China's economy and to promote economic development to adapt to the new normal goal, it is necessary to research, analyze, and to explore whether the Chinese stock market can really be a "barometer" of China's economic development, and to consider whether there are other Chinese stock market "barometers." The functions produce more direct and significant influence factors, providing new thinking modes for China's Securities investment
FUNCTION ANALYSIS OF CHINESE STOCK “BAROMETER”
field, perfecting the construction of the Chinese stock market, and giving full play to the function of the "barometer" of the stock market.
In today's economic context, the stock market, for the country to optimize the allocation of resources, for investors to share economic growth gains, and for enterprises to raise funds to provide an important channel, is an indispensable part of the national economy. Therefore, probing into the function of the "barometer" of the Chinese stock market and studying the linkage between the Chinese stock market and the macroeconomy, can not only reveal the operation Law of Chinese stock market effectively, but also discuss the effectiveness of the "barometer" effect of the Chinese stock market. The more we can promote the stock market resource allocation function and the "barometer" function effectively, the more likely we are to experience the development and prosperity of the stock market, so that the development of the stock market can promote economic development and can enable investors to more effectively share the benefits of macroeconomic growth.
1.1 Thesis innovation
Since the establishment of China's stock market, different studies have focused on the analysis of the "barometer" function of China's stock market and the relationship between the Chinese stock market and macroeconomy (see, e.g., Hassapis and Kalyvitis, 2002 ). But most of the literature has selected fewer indicators and sample numbers for empirical analysis, the paper selects the index of all aspects of China's macroeconomy and the monthly data of the eight years after the completion of China's share-splitting reform, which makes the empirical results more accurate and persuasive.
1.2 Research methods and structures
The research of this paper consists of two parts, theoretical analysis and empirical analysis.
In the theoretical analysis, it discusses the development of China's stock market and financial theory of the relationship between the stock market and macroeconomic analysis, as well as the theory of the stock market "barometer" function. The empirical analysis uses the Shanghai Composite index, total retail sales, consumer price index, total import and export, industrial value added, broad money supply and bank 6 Month to 1 the benchmark interest rate of annual loan is seven indicators, the model of VAR is established, and the "barometer" function of stock market is analyzed by Granger causality test, impulse response and variance analysis.
FUNCTION ANALYSIS OF CHINESE STOCK “BAROMETER”
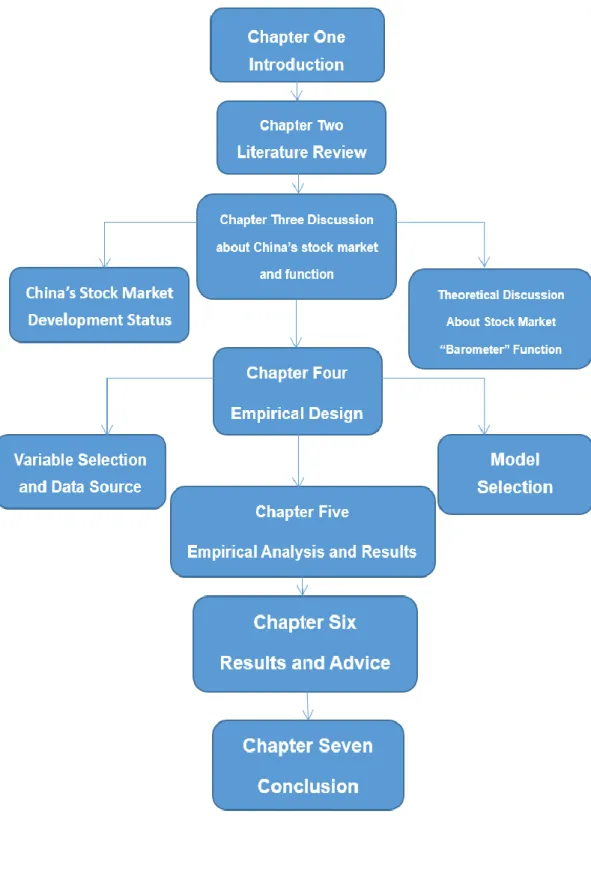
This article work is divided into seven chapters, the specific structure is as follows. The first chapter is introducing the research idea of this paper and the literature review about the "barometer" function of the stock market. First, the paper puts forward the background of the problem and expounds the purpose and significance of the study, then describes the research methods and ideas, and sets up the overall writing frame.
The second chapter is about the authorit enumerates the views and viewpoints of the domestic and foreign literature on the function of the "barometer", which lays the groundwork for the following theories.
The third chapter is about the basic situation of the Chinese stock market and the analysis of the "barometer" theory. First, the history of China's stock market since its inception has been reviewed, the characteristics of the development of the stock market has been combed, and the phenomenon of "stock deviation" has been pointed out. It then explains the "barometer" concept and theoretically describes the stock market "barometer" function.
The fourth chapter is the data selection and model setting part, respectively selecting the Shanghai Composite Index, the total retail sales of consumer goods, consumer price index, total import and export, industrial added value, broad money supply and bank 6 months to 1 as seven research indicators, the benchmark interest rate for annual loans is processed accordingly, and the selection of the selected VAR model, while also giving a brief introduction to it.
The fifth chapter is an empirical analysis, first, to test the stability of the data, and then establish the VAR model, the Granger causality test, the impulse response and the variance decomposition analysis, drawing of the conclusion, and then an analysis of the "barometer" function of Chinese stock market.
The sixth chapter is summary and policy suggestion, the study found that the trend of the Chinese stock market did not fully reflect the macroeconomic operation, and more crucially, the trend of the stock market on the macroeconomic operation has no obvious predictability, and cannot be effectively judged or predicted by the trend of the macroeconomic trajectory, indicating the Chinese stock market "barometer" function is not obvious.
The seventh chapter is conclusion, the paper puts forward some suggestions for the research results.
FUNCTION ANALYSIS OF CHINESE STOCK “BAROMETER”
FUNCTION ANALYSIS OF CHINESE STOCK “BAROMETER”
2. Literature review
Before Chinese scholars really paid attention to the function of the “barometer” of stocks, a considerable number of foreign literature have been discussed. Fama (1981) studies the relationship between yields and macroeconomics in the U.S. stock market and show that there is a positive correlation between stock prices and the real economic growth. Schwerte (1989) based on Fama (1981), leverages the U.S. the data for the 1889-1988 period and confirms the reliability of this conclusion. Levine and Zervos (2000) use date from 1976 to 1993 and use stock market trading size, market capitalization, turnover, transaction rate, the level of domestic economic integration (with CAPM and APT two models test) and stock market volatility and other indicators to measure the level of stock market development, and with GDP growth and capital formation rate of regression analysis, find that there is a high positive correlation between the stock market and the macroeconomy, and the stock market can reflect the economic changes in advance. Hassabis and Kalyvitis (2002) study the relationship between stock price changes and economic growth in seven industrialized countries in Asia using an autoregressive vector, and find a highly correlated relationship between these variables. Momani and Alsharari (2012) study the effects of macroeconomic factors such as industrial production index, total import and export, interest rate and money supply on Amman stock price and the results show that interest rates and industrial production index have significant influence on Amman stock price fluctuation.
With the rapid development of China's stock market, the domestic academic circles have gradually started studying these topics. Gu (2014) compares the " barometer " features of the domestic and foreign stock markets. The results show that the price changes in the developed countries (e.g., the United States), can reflect the macroeconomic trend in a certain extent in the long or short term, while the price changes of Chinese stock market are not synchronized with the macroeconomy and are even deviated from the phenomenon. This makes China's stock market normal financing function damaged, causing social wealth distribution distortion. As a result, Chinese currency cannot be effectively converted into capital, so that capital cannot be effectively allocated to the real need for the development of industries and enterprises. And the relative backwardness of the legal construction has aggravated the speculative of Chinese stock market. The author puts forward that we must pay more attention to investors' return, implement the compulsory dividend system of listed companies, raise the proportion of direct financing and raise the level of governance, and reshape Chinese stock market Barometer feature. Lu (2008) analyzes the general relationship between the stock market and the national economy.
FUNCTION ANALYSIS OF CHINESE STOCK “BAROMETER”
Because the national economy is the basis of the stock market operation, the stock market reflects the development and change of the national economy, they affect each other; and through the 1991-2009 annual volatility and of the Shanghai Composite Index GDP a comparative analysis of annual growth rates shows that China's stock market does not act well as a national economy Barometer. Aside from most of the accepted factors, the reason why China's stock market has failed to advance the economy is that its investment channels are too unitary. Len (2010) based on China's 1990 year-long securities market development practice, taking the overall Chinese stock market as the research object, the Shanghai Composite Index as the basis. Based on the theory analysis and the present situation analysis, the paper studies the deviation between the Chinese stock market and the macroeconomic operation and the bubbles. It is pointed out that the phenomenon is caused by the high proportion of non-tradable shares, the difference between the structure of real economy and the structure of stock market, and finally puts forward some suggestions such as the overall planning of circulation shares and the increase of market transparency.
In addition to theoretical analysis, Chinese scholars also conducted some empirical work and draws different conclusions. Chong (2012) conducts a regression analysis of relevant economic factors such as the Shanghai Composite Index, the macroeconomic boom indices, consumer confidence indices, CPI, and the Enterprise commodity trading price index. The study concludes that the transmission mechanism between the Shanghai Composite Index and macroeconomy is more complicated, and then through the VAR model, the growth rate of Shanghai Composite Index and GDP growth rate are empirically analyzed, it is found that there is a long-term equilibrium relationship between China's macroeconomic cycle and stock market cycle, but there is no obvious causal relationship in the short term. Yang (2014) take China's economic policy changes as a starting point and study the dynamic relativity between Chinese stock market and macroeconomy between 1995 and 2013. The results show that there is obvious asymmetry correlation between Chinese stock market and macroeconomy, and the correlation coefficient in economic depression is larger than that of economic boom. China's stock market has a more significant economic downturn than the barometer feature. Although the uncertainty effect of policy can affect the asymmetric strength of stock market and macroeconomic dynamic correlation, the asymmetric intensity of the dynamic correlation between stock market and macroeconomy is more affected by the change of the overall situation. Yong (2003) and Pan (2014) take the Granger Causality Test, using data from 1992 to 2011 on the Shanghai stock market. The results indicate that the two-way influence relationship between Chinese stock market fluctuation and macroeconomic fluctuation is not significant. However, the
FUNCTION ANALYSIS OF CHINESE STOCK “BAROMETER”
macroeconomic change has significant influence on the non-system change which has become the main component of stock market change. Moreover, stock market system changes are the reason for the Granger with non-system changes, and may be transferred to each other in the short term through macroeconomic fluctuations. Hua (2016), based on the inefficiency of the Chinese securities market, take the high book value market value listed companies as an example, to study the validity of China's securities market. The empirical results show that there are obvious phased changes in China's securities market, and that the 1993 is effective before the market, and most of them are weak after that. Because it has been shown that larger companies usually obtain a better return on investment than the market, it is still able to gain excess returns by focusing on larger companies. Therefore, China's stock market is not an effective market evidence, and cannot effectively reflect the economic situation and the future economic trends to make accurate forecasts. Yong (2003) shows a new statistical method, the generalized spectral derivative test, to explore the effectiveness of the Chinese stock market, which is suitable for the characteristics of high-frequency financial data (such as permitting the existence of arbitrary forms of wave clustering). The results show that both Shanghai and Shenzhen have not reached the weak formula.
In addition to theoretical analysis and empirical analysis, Chinese scholars also from the fundamentals, policy, news and psychological aspects of the Chinese stock market "barometer the significance of the function and its causes are explained. Qin (2014) believes that the reasons for the divergence between the stock market and the macroeconomy are mainly the transformation of China's economic needs, the transformation of enterprises and the need for investors to transform their investment ideas and realize their own transformation. Zheng (2015) points out that the current structure of China's stock market is unreasonable, sensitive, speculative, and light investment. The lack of the elimination mechanism of listed companies, suggested that government policy intervention should be targeted, while strengthening the security market information disclosure mechanism. Shen (2015), uses a robust estimation method of high frequency data asset price volatility to analyze the relationship between stock index fluctuation and macroeconomy in China's stock market. The results show that there is a correlation between stock index change and macroeconomics, and from the stock index fluctuation and the macroeconomic events and the correlation between the main economic indicators of this perspective on the empirical study, one year China has a series of macroeconomic policy implementations, the government's regulatory measures for the market affect the investors' perceptions and expectations of the market, and their trading strategy, which leads to the interaction between the stock market price and the macroeconomic events,
FUNCTION ANALYSIS OF CHINESE STOCK “BAROMETER”
so this is the value of the stock market as the macroeconomic "barometer". Pan (2014) questions whether political events such as the party's National Congress and the "two sessions" have an impact on the Chinese stock market. During the year 2007, the "two sessions of the congress?" were studied as an event analysis. The results show that such political events have a significant impact on the domestic stock market, which is a market with obvious characteristics of a "policy market" but lacks policy efficiency. The paper considers that the government's compulsory system arrangement, the instability of the policy mechanism and the existence of "internal information" are the main reasons for this phenomenon, and it is suggested that the government function should be changed appropriately, and the regulation function of the market should be exerted. China believes that there are still many deficiencies in its stock market, such as weak regulatory awareness, and the administrative means is far more than the legal means. The supervision system is not perfect and puts forward the suggestions of protecting investors ' interests, strengthening the construction of the law enforcement team and strengthening the market self-restraint function. Zhen (2009) views the stock market "barometer" failure of function mostly attributed to the excessive speculative behavior of investors, and the stock index, price/earnings ratio, turnover rate, circulation market value, turnover amount, as well as the size and change of the number of accounts, that can well reflect the excessive speculative strength of the market. In addition, the investor's high confidence and herd mentality also have an impetus influence on the Chinese stock market speculative bubble. Smear (2008) discusses the stability of China's stock market and considers that the imperfection of the price stability mechanism and the deviation of adjustment and control ideas are the main reasons for the instability of China's stock market, as well as the current market environment. The lack of short mechanism and the immaturity of investors are the basis of the instability of stock market and the failure of "barometer" function, and then put forward some measures such as perfecting the governance mechanism of listed companies and establishing market mechanism of supply and demand balance.
Since the birth of the stock market, the study of the relationship between the stock market and macroeconomy has a long history, so the existing literature on the subject has been developing. In the Chinese literature, the majority of the stock price indices only represent the index of the stock market, because of the particularity of the Chinese stock market (including the speculative nature of the Chinese stock market, the irrational investors and the management system differs from foreign markets), and because the index can reflect the market value to some extent, therefore, there is little literature that includes the market value and turnover as variables representing the stock market. In the selection of macroeconomic variables, most of
FUNCTION ANALYSIS OF CHINESE STOCK “BAROMETER”
the domestic and foreign literature have selected such indicators as GDP, industrial value, inflation rate, total import and export, money supply and interest rate to reflect the macroeconomic operation.
From the selected empirical model and research methods, due to the limitations of the development of economy, early literature OLS the returns to a single factor, after a period of academic and technological progress, a lot of literature has been developed, such as the multivariate regression model, co-integration model, Granger causality test model, Impulse response model, error correction model and variance decomposition model, and even more innovative methods. These literature has basically formed the consensus in research thought, but in the data processing and the model's concrete application there is a difference.
Since the reform of the Chinese stock market’s share splitting, there are few articles which study the deviation between stock market and macroeconomy. On the basis of the existing research results, this article will draw on the domestic and foreign literature research methods and innovate the study and analysis of the relationship between Chinese stock market and macroeconomic operation trends. This paper probes into whether the Chinese stock market can forecast the macroeconomic efficiency ahead of time, inquires whether it has the function of the "barometer" and its strength, and put forward reasonable suggestions for the development and perfection of Chinese stock market so as to promote the prosperity and development of the national economy.
FUNCTION ANALYSIS OF CHINESE STOCK “BAROMETER”
3. Chinese stock market overview and "barometer" functional theory discussion
In the content of this chapter, we will first explain the development of China's stock market, then interpret the definition of "barometer", and finally theoretically discuss the relationship between stock market and macroeconomy and the "barometer" of the stock market and function mechanism.
3.1 Development of China's stock market
The Chinese stock market has experienced the lack of the early stage market operation mechanisms and the lack of rule of law. Over the last years, all the different players, including the government, the stock exchange, the intermediary agencies, the listed companies and investors, have come a long way. During this period, the division and distribution of the interests and the power of economic activities among the stakeholders, together with the innovation and development of the capital market in the world, further promoted the development of China's stock market (see, e.g., Jun, 2012).
3.1.1 The history of Chinese stock market development
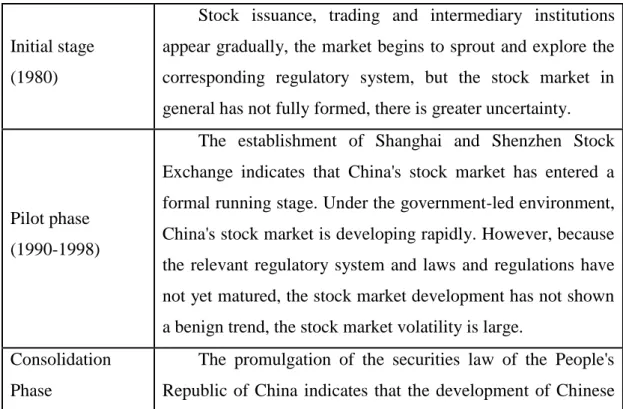
Looking at the development of China's stock market from the beginning to the present, it can be divided into the following four stages, presented in Table 1.
Table 1 - China shares ticket market development process phase division
Initial stage (1980)
Stock issuance, trading and intermediary institutions appear gradually, the market begins to sprout and explore the corresponding regulatory system, but the stock market in general has not fully formed, there is greater uncertainty.
Pilot phase (1990-1998)
The establishment of Shanghai and Shenzhen Stock Exchange indicates that China's stock market has entered a formal running stage. Under the government-led environment, China's stock market is developing rapidly. However, because the relevant regulatory system and laws and regulations have not yet matured, the stock market development has not shown a benign trend, the stock market volatility is large.
Consolidation Phase
The promulgation of the securities law of the People's Republic of China indicates that the development of Chinese
FUNCTION ANALYSIS OF CHINESE STOCK “BAROMETER”
(1999-2006) stock market has entered a normative and consolidation stage, and that the system and regulations have been perfected gradually.
Perfect Stage (2007-to present)
The completion of the non-tradable share reform and the improvement of the system innovation and supervision measures indicate that the Chinese stock market has entered a perfect stage. At the same time, the introduction of margin and stock index futures also reflects the increasingly stable development of the stock market, whose function is gradually being paid attention to.
Source: (Geng, 2009)
3.1.2 China's stock market development status
In the year 1990, Shanghai, China, Shenzhen Stock Exchange was formally established. After the development of the supply policy, China's capital market has played an irreplaceable important role in broadening financing channels, promoting capital formation, optimizing resource allocation, and dispersing market risks (see, e.g., Geng, 2009). This has become a powerful impulse to promote the development of China's real economy and has become an important part of China's socialist market economic system.
Currently, the stock market has more than 2000 listed companies, the total value of stocks in the forefront of the world. Among the listed companies, there are many important enterprises with state-owned holding or equity participation, which shows the enhancement of the state-owned assets increment effect, and fully shows the vigor, control, and influence of the state-owned economy. Listed companies of SME board and Gem, private enterprises account for more than 80% of the businesses. This has promoted private enterprises to establish the modern enterprise system process powerfully, by means of the capital market platform. The large number of companies represents the future economic development direction in science and technology. Innovative enterprises stand out, and this has provided the important support to urge the Chinese industrial structure adjustment and supported independent innovation. The stock market which has taken shape in China has bred a group of listed enterprises with certain competitive power, cultivated investment and financial management consciousness, and has been improving China's national economy and promoting its rapid development.
The Shanghai Composite has experienced ups and downs but, overall, it has not been significantly improved in terms of stock market growth. Meanwhile, the stock market in other
FUNCTION ANALYSIS OF CHINESE STOCK “BAROMETER”
countries performed better. Mexico rose 611%, India rose 388%, South Korea rose 296 %, Brazil rose 243 %, and only Japan fell 7%. However, at the same time, higher than average growth in high-income countries was 2%, and average growth in low-and middle-income countries 6%. We can see that the trend of China's stock market and the growth of GDP appears to deviate from the phenomenon. What is the reason for this phenomenon? Is there a certain correlation between the trends of the Chinese stock market and the macroeconomy, and whether it can forecast the fluctuation of the macroeconomy in advance? Is the "barometer" feature significant in China's stock market? The issue has sparked intense debate and widespread concern in the economic community. The following will focus on the relationship between the stock market and macroeconomic relations to explore the theory. The subsequent chapters will contain an empirical analysis of the corresponding foreshadowing.
3.2 Stock market barometer the theoretical approach to functionality 3.2.1 Barometer definition
The operation of the national economy has a certain volatility, and the stock market also has periods of boom and bust. It is said in traditional economic and financial theory that the stock market can fully reflect the trend of the macroeconomy (see, e.g., Li. 2005). Investors are affected by the psychological impact of economic fluctuations, so that the stock market’s corresponding changes in earnings expectations of listed companies and the change in investment strategy led to the volatility of the stock market. Stock market fluctuations can fully reflect the macroeconomic changes and the investor's expectations towards the economy will adjust their investment behavior in the stock market and thus, through a series of conduction mechanisms and effects, these fluctuations influence the development of the macroeconomy and can forecast the macroeconomic change in advance. This is the stock market "Sunny rain table" theoretical core of functionality. Therefore, in theory, the stock market should have a leading role in the macroeconomy, which reflects the macroeconomic trends of a country.
The following is a theoretical discussion of the relationship between the stock market, macroeconomics, and the "barometer" of the stock market Functional Mechanisms.
3.2.2 Stock market on macroeconomic trends reflection
The stock market plays a pivotal role in the economic development of a country, which relates to the macroeconomy. The macroeconomic trend determines the operation of the stock market, and the operation of the stock market reflects the macroeconomic changes. The reflection mechanism of the stock market on the macroeconomic trend is as follows.
FUNCTION ANALYSIS OF CHINESE STOCK “BAROMETER”
(1) The change of the stock price is mainly affected by the factors such as production, consumption, investment and export of the macroeconomy.
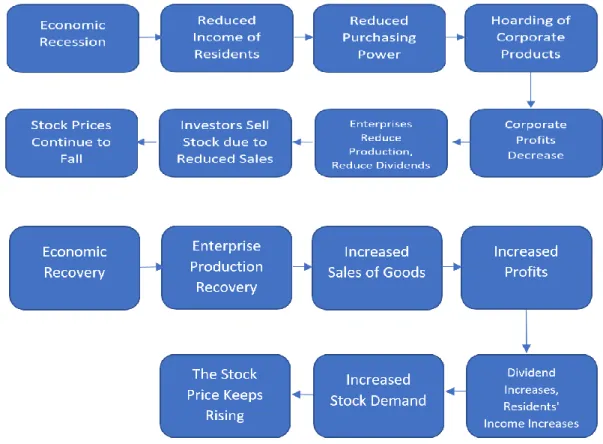
(2) The cyclical alternation of investors ' expectations of the economic outlook determines the supply and demand of stocks, which leads to a rise in stock prices. When the economy is in recession, stock prices fall, and as the economy begins to recover, share prices slowly rise. The specific mechanism is shown in the following figure.
Figure 2 Reflection of the stock market on macroeconomic trends
Source: (see Shen, 2015)
According to the above analysis, we can see that the macroeconomy determines the operation of the stock market, the stock market should be able to show a timely and accurate reflection of macroeconomic trends.
The stock market, in the construction of long-term bottom, will form an upward trend, after completion of the medium and long term, the whole process of forming a downward trend has a certain time span in time than the four stages of the economic cycle. That is, the stock price has been falling before the economic recession began, and the stock price has risen before the economic recovery. Share prices have peaked at the peak of the economic cycle, and the stock market is starting to climb from its lowest point when the economy is still in recession.
FUNCTION ANALYSIS OF CHINESE STOCK “BAROMETER”
This occurs mainly because investors ' expectations of economic growth affect stock price fluctuations, and investors anticipate the various stages of the economic cycle ahead of the economic cycle. It can be said that the volatility of the stock market is a comprehensive reflection of the economic expectations of different investors. So, the economy tends to fall first in the run-up to overheating, and the stock market takes the lead in reversing when the economy has not yet moved to a pick-up stage. From the following two cycles of the same direction, and the reverse movement, the stock market reflects the specific performance of macroeconomic trends: the economy bottomed, the stock market rose (in reverse); the economy rebounded, stocks continued to rise (along); the economy overheated, stocks fell (in reverse); the economy shrank, and stocks continued to fall.
In addition, the supply of capital and supply and demand of stock will reflect the change of the government's macroeconomic control policy and the liquidity of stock market currency.
3.2.3 The leading role of the stock market in macroeconomics
Macroeconomics is a concentrated embodiment of a country's comprehensive development situation. While the variables in the stock market may not directly affect economic operation, they do have some influence on the psychological atmosphere of the economic environment. Because the stock market is a concentrated reflection of economic expectations, the stock market is generally referred to as the economic "barometer", that is, the stock market trends are ahead of the forecast of the economic trajectory, which is the core function of the stock market "barometer.”
The stock market, mainly through the macroeconomic basis-enterprises, is used as a leading indicator of the macroeconomy. First, the development of the stock market can broaden the financing channels of enterprises, facilitate the financing of enterprises to ensure that enterprises grow, and develop the necessary funds to supply. This way, enterprises have stable financial resources and a long-term, sound operation as a foundation, so as to better stabilize the operation of the national economy. Objectively, the efficient management of the constraints and supervision mechanism make the development of enterprises more standardized. Moreover, the development of the stock market can not only promote the reasonable reorganization and merging of enterprises, but also provide guidance in the reformation of state-owned enterprises. First, it can improve the unreasonable ownership structure of the state-owned enterprises, strengthening the company's normative governance. It can also protect the normal interests of small and medium investors from the system.
FUNCTION ANALYSIS OF CHINESE STOCK “BAROMETER”
From the perspective of investors, the development of the stock market provides a new investment channel for the investors. It convinces them to convert savings into investment, effectively relieving the problem of high savings rates. The development of the stock market also improves the efficiency of social idle funds, facilitates the full flow of funds, allows a more reasonable allocation of social resources, and promotes a healthier and more stable macroeconomic development.
From the standpoint of the government, the stock market also provides the government with a good regulation tool to regulate the economic operation. The government can make and implement the relevant macro-industrial policy through the stock market and give the enterprise preferential policy which accords with the policy. For example, they can reduce the threshold of the listed door of the enterprise, let the difference treatment of the listing audit, and let the enterprise be the first to obtain good development conditions. These potential effects could be conducive to economic restructuring and the healthy development of macroeconomics. The government can also levy certain taxes and fees from the stock market through the form of tax, enlarge the source of revenue, and use the income for the benefit of the whole society.
This shows that the stock market plays a very important role in macroeconomic development, which has a leading role in theory. The change of stock price not only reflects the operation of the stock market itself, but also directly or indirectly affects the development of the national macroeconomy, and ultimately affects the operation of the economic cycle. However, whether the conductive ability of the macroeconomy’s leading role can be fully exerted, the "Sunny Rain" table feature is fully demonstrated in practice, it is inseparable from whether the stock market is in good working condition. Through empirical design and analysis, this paper explores whether the "barometer" function of the Chinese stock market is significant.
FUNCTION ANALYSIS OF CHINESE STOCK “BAROMETER”
4. Empirical design and model
In the last chapter, this paper expounded the development of Chinese stock market, interpreted the definition of "barometer" function, and finally discussed the relationship between stock market and macroeconomy, as well as the function mechanism of "barometer" in theory. In the content of this chapter, we will choose the corresponding representative index from the stock market and macroeconomy, collect and process the data, and finally confirm the empirical model of the thesis, then discuss the relationship between Chinese stock market and macroeconomy and whether the "barometer" function is significant to pave the way.
4.1 Data and variables
From May 9, 2005, China implemented a share-trading reform. This divided the listed company's shares on the A-share market into tradable shares and non-tradable shares, and resolved the balance of interests among the relevant shareholders of the A-share market.
The reform of the split share structure has profound significance to the development of Chinese stock market: firstly, the solution of the share splitting problem will promote the improvement of the securities market system and the governance structure of listed companies, as well as contributing to the long-term healthy development of the market. It is conducive to improve the investment environment, promoting the sustained and healthy development of the securities market, and other long-term benefits. Thirdly, the principle of protecting the legitimate rights and interests of investors, especially public investors, makes the success of the pilot reform possible, which will greatly enhance investor confidence and promote the steady and healthy development of the Chinese stock market.
4.1.1 Data source and processing
Annual data for the 2010-2017 period is drown from the National Bureau of Statistics website, the People's Bank of China website, and the Oriental Fortune Trading software. Because the time span of each data set is different, and the Chinese stock market is more mature and normative after the split-share reform was completed in 2006, this article focuses on the statistics analysis based on data between 2010 and 2017 for the sake of objectivity and accuracy. Some data points on the total retail sales of consumer goods, consumer price index and industrial added value are missing. Hence, the smoothing interpolation method is used to complement the whole.
FUNCTION ANALYSIS OF CHINESE STOCK “BAROMETER”
Table 2 Indicator code description
Indicators Acronyms
Shanghai Composite Index
Year-on-Year Growth Rate INDEX
Social Consumer Goods Retail Total
Year-on-Year Growth Rate Consumption
Consumer Price Index Year-on-Year
Growth Rate CPI
Total Imports and Exports Year-on-Year
Growth Rate IMEX
Industrial Value-Added Year-on-Year
Growth Rate INDUSTRY
Broad-Term Money Supply
Year-on-Year Growth Rate M2
Bank 6 Months to 1 Annual Loan Base
Rate RATE
4.1.2 Stock market variables
China's Shanghai and Shenzhen’s stock indices currently coexist because there is an integration relationship between Shanghai and Shenzhen’s stock indices. The trend of the two cities has a stable linear relationship, so the study of a market can represent the whole stock market. At the same time, because the listed companies in Shenzhen’s Stock exchange are small and medium-sized enterprises, its market value is smaller compared to the listed companies in Shanghai. It is consequently more susceptible to speculation by investors as the Shenzhen market volatility is higher. Therefore, in this study, after the completion of the split-share reform, the 2010-2017 Annual Shanghai Composite Index closing value year-on-year growth rate as a variable reflects the operation of the stock market, and the trends of the Shanghai Composite Index represents the fluctuation trends of Chinese stock prices.
4.1.3 Macroeconomic Variables
To fully reflect all aspects of macroeconomic operation, we choose the six most representative indicators in macroeconomics as the research variables.
FUNCTION ANALYSIS OF CHINESE STOCK “BAROMETER”
(1) Domestic trade: domestic trade not only reflects the domestic economy's own operation, but also reflects the residents' purchasing power and residents' judgment of the future economic situation. The total retail sales of consumer goods in the wholesale and retail trade, hospitality industry, and other industries directly sold to urban and rural residents and social groups of consumer goods retail sales, can better represent China's domestic trade situation. Choosing the split share reform after the completion of 2010-2017, the annual year-on-year growth rate of total retail sales of consumer goods in the year reflected domestic trade indicators.
(2) Foreign trade: As an export-oriented country, exports have always been a measure and important indicator of China's economic development trends. In addition, due to the rapid development of China's economy and the status of the global economy, China's purchasing power has significantly increased, and imports have maintained a rising trend. With foreign trade becoming increasingly important in China's economy, it also becomes one of the most significant aspects of research. And the total import and export represent the level of China's foreign trade more comprehensively; therefore, after the reform of the split share structure, 2010-2017’s annual growth rate monthly data serves as the research variables. (3) Price index: Price indices can effectively reflect the domestic price level of a country and
measure the stability of the macroeconomic operation; therefore, this paper will select price indices as one of the research aspects. Since the consumer price index is the relative number of changes in the price level of a representative set of consumer goods and services over time, it can reflect accurately the changes in the price level of households buying consumer goods and services. After the split share reform was completed, 2010-2017 will be the years studied. Consumer price index year-on-year growth monthly data will be the research variable representing the price index.
(4) Industry: Considering a country's economic strength and market size, GDP has only annual and quarterly data, and if annual or quarterly data is selected, a smaller sample size may affect the accuracy of the paper’s results. As an industrial country, the contribution of industrial output in the national economy is very high and plays representative role in China's national economy, reflecting the overall macroeconomic performance. Because the industrial value added can represent the development degree of the Chinese industry more comprehensively, the monthly data for the annual growth rate of the industrial increment value of the 2010-2017 years after the split share reform has been completed as the research variable representing industry.
FUNCTION ANALYSIS OF CHINESE STOCK “BAROMETER”
(5) Money supply: As the intermediary target of China's monetary policy, the money supply affects the change of market supply and demand, and has a high correlation with macroeconomics, making it a significant research aspect. The broad money supply refers to cash in circulation, the bank's demand deposit, the periodical deposits of the organs, groups, troops, enterprises and institutions in the bank, and the rural and urban residents' savings deposits. It also includes the foreign currency deposits and the trust deposits, which covers a wide range and has a more stable circulation speed, which can reflect changes in purchasing power more correctly. Moreover, its quantity is less influenced by the public's influence on the liquidity preference of currency, so after the split-share reform is completed, the general money supply annual growth rate of the monthly data of the 2010-2017 year is the research variable representing the money supply.
(6) Interest rates: Interest rates are an important tool for regulating monetary policy and are also used to control investment, inflation and unemployment, which in turn affect economic growth. The loan interest rate directly determines the borrowing enterprise's fund scale, and since the enterprise is the national economy's cell, its fund scale and the operating conditions will have certain influence on the macroscopic economy. The loan benchmark interest rate is the central bank to the Commercial Bank's loan guidance interest rate, which is the central bank to adjust the social economy and the financial system operation's monetary policy and has some influence on the macroeconomy. This leads the benchmark interest rate to be chosen as one of the research aspects. In addition, because the loan benchmark rate is divided into 6 months, 6 Month to 1 Year and 1 to reduce the one-sidedness of the empirical result, the interest rate of short or too long-time interval is not selected, and when the split share structure reform is completed 2010-2017 Year's bank 6 months to 1. The benchmark interest rate of the term loan is the research variable representing the loan interest rate.
4.2 Methodology
The aim of this study is to study whether there is a significant "barometer" function in the Chinese stock market— that is, whether the trend of the stock market can reflect the macroeconomic changes and can also play a leading role in predicting the economic situation. We follow similar approach adopted by Hassapis and Kalyvitis (2002), Li (2005), Jin (2010), Chong (2012), and Jun (2012), that have established the use of VAR model in the study of this problem, and analyzed it comprehensively through Granger causality test, pulse response, and variance decomposition. The analysis of the relationship between stock market and
FUNCTION ANALYSIS OF CHINESE STOCK “BAROMETER”
macroeconomy or the function of "barometer" by this model is recognized by the literature. The Granger causality test in the VAR model can analyze whether there is a two-way causal relationship between the Shanghai Composite Index and the macroeconomic indicator— that is— whether the Shanghai Composite Index can fully reflect the changes of macroeconomic indicators, and whether the Shanghai Composite Index can make an effective prediction of the changes of macroeconomic indicators. Pulse response can further analyze the index of the Shanghai stock index on the specific level of macroeconomic indicators and the degree of prediction; variance decomposition can be compared to the contribution rate of different indicators, to explore whether the Shanghai Composite Index can best reflect or predict the growth, as well as the strength of the Shanghai Composite Index to reflect or forecast compared to other factors. This layer of progressive analysis can add a more profound depth to the Chinese stock market "barometer" function to explore. Therefore, this method is suitable for the analysis of the thesis.
Vector Autoregressive Model (VAR) is a model based on the statistical nature of the data. VAR constructs the model by taking every endogenous variable in the system as a function of the hysteresis value of all endogenous variables in the system, studies the interaction between different variables, and then generalizes the univariate autoregressive model to a "vector" autoregressive model composed of multivariate time series variables.
The general expression is:
𝒚𝑡 = 𝜱1𝒚𝑡−1+ ⋯ + 𝜱𝑝𝒚𝑡−𝑝+ 𝑯𝒙𝑡+ 𝜺𝑡 for each 𝑡 = 1,2, ⋯ , 𝑇, (1)
where the 𝑘 -dimensional column vector 𝒚𝑡 is an endogenous variable, the 𝑑 -dimensional
column vector 𝒙𝑡 is an exogenous variable, 𝑝 is the lag order, 𝑇 is the number of samples, 𝑘 × 𝑘-dimensional matrices 𝜱1, … , 𝜱𝑃, 𝑘 × 𝑑-dimensional matrix 𝑯 is the coefficient matrix to be estimated, and 𝜺𝑡 is a 𝑘-dimensional perturbed column vector that can be correlated with each
other. But not related to your own lag value and not to the variable to the right of the equation, assume that 𝛴 is the covariance matrix of 𝜺𝑡 is a positive definite matrix of (𝑘 × 𝑘) the vector autoregressive model is essentially a simultaneous equation model. The explanatory variables of each equation are one of the endogenous variables. The explanatory variable is the lag period of each endogenous variable.
The smoothness of the data used, the established VAR, and the unit circle test for the model is described below. Next, we will first examine the stability of the time series of variables, again,
FUNCTION ANALYSIS OF CHINESE STOCK “BAROMETER”
the establishment of the VAR model and its smoothness of the unit circle test, and then the Granger causality test, pulse response and variance analysis, then the empirical results are explained. Finally, it concludes and puts forward relevant policy suggestions.
FUNCTION ANALYSIS OF CHINESE STOCK “BAROMETER”
5. Empirical analysis and results
In this Section, we will first inroduce the stock market "barometer" function judgment standard, then, from the previous chapter, select the data and the model created by the demonstration test, and finally analyze the empirical results.
5.1 Stock market barometer functional criteria
The barometer theory holds that stocks can fully reflect macroeconomic changes and have a leading role in macroeconomics, as well as predict macroeconomic trends. The stock market on the macroeconomic predictability is the "barometer" function as the core standard.
If the Chinese stock market "barometer feature is significant, with the VAR model, you should show the following results.
First, with the Shanghai Composite Index and macroeconomic indicators, there will be a two-way and significant Granger causality; the changes in the Shanghai Composite Index should have a clear forecast. This will show that the stock market can not only reflect the full macroeconomic changes, but that the trends of the stock market can also play a leading role in macroeconomic operation. Its indicative role is significant, thus reflecting its "barometer" feature.
Secondly, when the Shanghai Composite Index is impacted by macroeconomic indicators, it shows a significant pulse response image. When the macroeconomic indicators are will be impacted by the Shanghai Composite Index, they also show a significant pulse response image. This shows that the interaction between the two is significant, and the trend of the stock market can predict the macroeconomic trajectory, thus reflecting its "barometer" function.
The following will be checked and established by data smoothness in turn by VAR Model and unit circle inspection, Granger causality test, impulse response, and variance decomposition, to explore whether the trends of the Chinese stock market can not only reflect the macroeconomic operation, but also can effectively forecast its fluctuation. We will then compare the empirical results with the above criteria to determine whether the Chinese stock market has a significant "barometer” function.
5.2 ADF test results
Because this study uses VAR Vector Autoregressive Model to study the dynamic relationship of the combined endogenous variables, the collinearity problem between variables is not considered.
FUNCTION ANALYSIS OF CHINESE STOCK “BAROMETER”
Time series often exhibit non-stationary, traditional methods of verifying time series smoothness are generally used DF unit root Inspection method. Because the DF test assumes that the time series y has a first-order autoregressive AR with white noise distractors. However, t
the random items of the time series of real economic variables may not be white noise processes, or they may be generated by higher-order autoregressive processes, which may result in invalid DF validation. Later generations extended the ADF test against the flaws of the traditional DF test. The test method of the ADF adds time trend items and floating items to overcome the drawbacks of the traditional DF method, making the test results more realistic and scientific. Because the VAR model is more effective in fitting the stationary time series, we first examine the variables selected by the model by unit root and observe whether the time series variables are stable. The tests of the unit root smoothness using the ADF method are presented in Table 3.
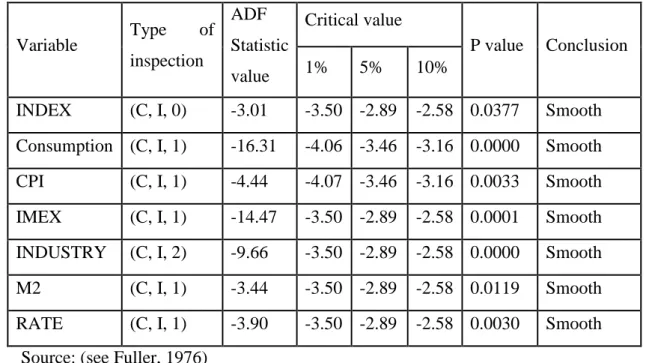
Table 3 Variable’s ADF quarantine
Variable Type of inspection ADF Statistic value Critical value P value Conclusion 1% 5% 10% INDEX (C, I, 0) -3.01 -3.50 -2.89 -2.58 0.0377 Smooth Consumption (C, I, 1) -16.31 -4.06 -3.46 -3.16 0.0000 Smooth CPI (C, I, 1) -4.44 -4.07 -3.46 -3.16 0.0033 Smooth IMEX (C, I, 1) -14.47 -3.50 -2.89 -2.58 0.0001 Smooth INDUSTRY (C, I, 2) -9.66 -3.50 -2.89 -2.58 0.0000 Smooth M2 (C, I, 1) -3.44 -3.50 -2.89 -2.58 0.0119 Smooth RATE (C, I, 1) -3.90 -3.50 -2.89 -2.58 0.0030 Smooth
Source: (see Fuller, 1976)
As shown in Table 3, the variables are significant at the 1%, 5%, 10% level, meaning that they have passed the significant level ADF Unit root test. It is then possible to reject the original assumption that the time series of individual variables is smooth at all levels and no longer requires differential processing, which can be directly followed by econometric analysis.
5.3 VAR model creation and validation
To build a VAR model, we first determine the corresponding VAR to the lag order of the model. Table 4 gives a corresponding VAR model 0-8 order LOGL, LR, Fpe, AIC, SC and
FUNCTION ANALYSIS OF CHINESE STOCK “BAROMETER”
HQ the value in which the optimal order is selected for the corresponding criterion by the value identified. In table 4, we see that more than half of the criteria select the Lag 8 Order, so we can determine that the optimal lag order of the model is 8 Order.
Table 4 The result of a delay order
Lag Logl LR Fpe AIC SC HQ
0 -1856.662 NA 5.86e+09 42.35596 42.55303 42.43536 1 -1372.877 879.6090 300400.8 32.47449 34.05098* 33.10962* 2 -1310.447 103.5779 225851.6 32.16925 35.12516 33.36011 3 -1260.501 74.91892 232906.2 32.14775 36.48309 33.89435 4 -1204.929 74.51751 222361.2 31.99838 37.71314 34.30071 5 -1138.148 78.92231 177217.1* 31.59428 38.68847 34.45235 6 -1095.673 43.44107 272734.2 31.74256 40.21618 35.15637 7 -1046.196 42.72936 416534.6 31.73174 41.58478 35.70128 8 -944.1141 71.92166* 240680.2* 30.52532* 41.75779 35.05060 After determining the optimal lag order, we use a VAR (8) model. The estimated results of the model are shown in Appendix 1. To verify that the VAR (8) model is constructed reasonably, we must test it for its stability. The results are shown in the Figure 3 below.
FUNCTION ANALYSIS OF CHINESE STOCK “BAROMETER”
From Figure 3, we can see that the entire feature root of the model is within the unit circle, indicating that the sequence is stable, and therefore the established VAR model is appropriate.
5.4 Granger causality test 5.4.1 Test results
The Granger causality between two economic variables, x1 and x2, can be defined in the case of a time series: only by x2 past information pairs x2 can we make predictions that are
less effective than when you include a variable x1, x2. In the context of past information, on variables x2 the forecast, which is the variable x1 helps explain variables x2, and you can assume that the variable x1 is causing the variable x2 by Granger causality. A Granger causality test premise condition is that the time series must have smoothness, but if does not satisfy this condition, it may appear as a false regression question. Therefore, before the Granger causality test, we should first test the stability of each variable in the model using the method of a unit root test. The ADF test is one of the common test methods for unit roots. The ADF test for each variable has been performed above, proving that the time series for each variable is stable. As to whether there is a causal relationship between the Shanghai Composite Index and macroeconomic indicators, there is a one-way or two-way relationship, and we can use the VAR model for its Granger causality analysis. Because of the research variables, the Granger causality judgment is also numerous, and the main purpose of this paper is to study the causal relationship between the operation of Shanghai Composite Index and the changes of macroeconomic variables. Therefore, only the Granger causality of the Shanghai Composite Index and other macroeconomic variables are analyzed. The test results are shown in Tables 5 and 6, below.
FUNCTION ANALYSIS OF CHINESE STOCK “BAROMETER”
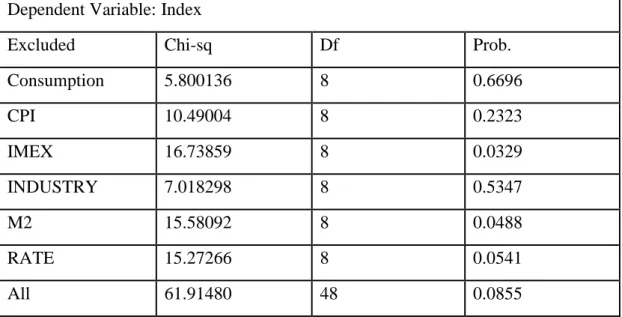
Table 5 Granger causality test to Shanghai index
Dependent Variable: Index
Excluded Chi-sq Df Prob.
Consumption 5.800136 8 0.6696 CPI 10.49004 8 0.2323 IMEX 16.73859 8 0.0329 INDUSTRY 7.018298 8 0.5347 M2 15.58092 8 0.0488 RATE 15.27266 8 0.0541 All 61.91480 48 0.0855
Table 6 Granger causality test to macroeconomic indicators
Dependent variable: Consumption
Excluded Chi-sq Df Prob.
INDEX 7.548683 8 0.4787
Dependent variable: CPI
Excluded Chi-sq df Prob.
INDEX 7.992854 8 0.4342
Dependent Variable: IMEX
Excluded Chi-sq df Prob.
INDEX 10.10762 8 0.2576
Dependent Variable: Industry
Excluded Chi-sq df Prob.
INDEX 9.054071 8 0.3378
Dependent variable: M2
Excluded Chi-sq df Prob.
INDEX 8.598786 8 0.3773
Dependent variable: RATE
Excluded Chi-sq df Prob.
FUNCTION ANALYSIS OF CHINESE STOCK “BAROMETER”
From Table 5, we can see total import and export, broad money supply M2 and Bank 6 months to 1 year loan benchmark rate are the Granger reasons for the Shanghai Composite Index, indicating that they have a certain forecast on the trend of the Shanghai Composite Index. This also holds that the Shanghai Composite Index can reflect the changes of these three indicators. Other macroeconomic indicators are not the Granger reasons for the Shanghai index, indicating that they have no obvious forecast on the trend of Shanghai Composite Index, the Shanghai Composite.
(1) Since its entry into the WTO, as far as the total import and export of China is concerned, the open economy has been growing rapidly. Not only that, but the industrial competitiveness has increased markedly, the level of openness China has opened up tremendously, there has been improvement in international status and influence, and the overall scale of foreign trade has accelerated the pace of China's integration with the global economy. In recent years, the numerous government-issued policies to promote the development of foreign trade, as well as China's increasing number of foreign trade-listed enterprises, have become hot topics in China's stock market, affecting the fluctuation of the operation of the index. The rapid development of foreign trade has attracted the attention of many international investors, and as more and more international hot money flowed into the Chinese stock market, it influenced the operation of Chinese stock market to a certain extent. Therefore, the total import and export of the Shanghai Composite Index has a certain predictability, and the trends of the Chinese stock market can reflect the changes in total import and export.
(2) In terms of money supply, the central bank controls the amount of money supply through open market operations and deposit reserve policy, while the money supply can exert influence on stock price fluctuation. The first effect is the central bank influencing participants' expectations in the money market by controlling how much money is available on the market, creating psychological anticipation. This expectation can change the supply of funds in the stock market, investors move according to the market and their own risk preferences, change their investment strategy, and, in turn, affect the stock market trends and capital scale. The second is the impact on the portfolio, when the central bank adopts monetary policy to adjust the money supply, the amount of money people hold will also change, as well as the overall increase in the money supply. As people hold more of their money, the marginal effect is diminishing. Under certain conditions, people hold more than the normal demand of money, and they will choose investment channels to inject capital