-.//)%#012&'()'3)/#%0(&
3)/#%0(&')4'567)680%.0'96:&%4;#.<0
=%0$0>8&'):)<#"0(&'/&$'0'&%.)6#012&'()
!"#$%&&#"'()#*+#"'(,%-%.'(/"0&+0.'(/#*+0.1#()*'"+%
2#3"04*%&
!"#$%&&#"'()#*+#"'(5'"0'(6#7#(5%&8*0+'(2#3"04*%&
3'(/*.1'(90:#-'*(!0.+#
?"@/'A6#B6.&'A%0CD&'E)%%).%0
;0<*-'+0#.(#$(-'"4%(&:'-%(!%"='&0=%()0&>-'?&
9%+@#"A&
B.0=%"&03'3%(3#(50.1#
!"#$%&'()'!*+)*,&-.&
We build too many walls and not enough bridges.
Acknowledgments
It is now time to express my most profound gratitude to everyone who helped me arrive on this important step of my life.
I want to start by thank my dear supervisors, professors Maria João Nicolau and Helena Rodrigues, for their guidance and wise words along the course of this work. Without them it would not be possible to reach this stage. Other professors had also an important role on my academic life, their advise and support from the simpler questions to the harder ones were priceless. Among others, a special thank to professors Rui José, António Costa, Bruno Dias and António Nestor Ribeiro.
I also want to address some special words to all the people that constitute the Ubicomp Group of the Algoritmi Research Center at the University of Minho, for the brainstorms and the pleasant leisure times we have had during this year.
The last but not the least, to my Mother and Father that have always been by my side every second. They endured my lacks of humor, supported me even without saying anything gave me the strength needed to overcome the rocks on the road. For them my most sincere: ”Thank You!” A special thank has to be addressed to my bother, who never had problems to say the most relentless words, opening my eyes and unveiling me new possibilities, even when I thought I was correct. His strength and resilience will be forever a model that I will try to pursue throughout my existence.
To my friends, not referring to no one in special, for the patience, com-panionship and love given without any hesitation.
As Sir Colin R. Davis once said:
“The road to success and the road to failure are almost exactly the same”. What we have not said in his statement is that the right side of the road most of the times is pointed, even not noticing, by those who take care of us and tirelessly bear us. The truly friendship and companionship of our beloved ones is undoubtedly the best compass that we can own throughout our lives.
Resumo
As redes de ecrãs públicos de área alargada estão-se a tornar um paradigma emergente e representam uma transformação radical em relação à maneira como encaramos a disseminação da informação em locais públicos.
Estas redes com o sua natureza ubíqua levantam alguns desafios para quem tem que as desenhar, instalar e usar. É bastante importante perceber quais são as principais compromissos a assumir quanto ao desenho das re-des de ecrãs, principalmente em relação aos seus componentes e respectivos protocolos, para desta forma podermos oferecer uma rede aberta, global e sobretudo escalável.
A partir destas ideias o trabalho de caracterizar os componentes de rede é um dos pontos essenciais para alcançar um desenvolvimento fundamentado deste sistema. Também é fundamental ter uma avaliação dos desenvolvi-mentos respeitantes à desempenho do sistema e à forma como o aumento do numero de intervenientes no mesmo afecta o seu comportamento.
Assim este trabalho, complementando essa caracterização e classificação inicial, pretende desenvolver uma ferramenta que permita às demais equipas multidisciplinares criar cenários e modelos de simulação para confirmar se as suas decisões quanto aos padrões a implementar são os que melhor se adequam aos requisitos destas redes.
Abstract
Large-scale pervasive public displays networks are becoming an emerging paradigm and represent a radical transformation in the way we think about information dissemination in public spaces. These networks with its pervasive nature rise a number of challenges for those who have to design, test, deploy and use this kind of networks. It is imperative to understand what are the key tradeoffs in the design of pervasive displays networks, mainly on their components and respective protocols, in order to provide a fully open, global and most importantly scalable displays network.
Starting from these ideas the work of characterize the network compo-nents is a key step to accomplish a well grounded development of the system. Also the assessment of those developments regarding the performance of the system and how the increasingly number of elements changes its behavior is imperative.
Thus this work, in addition of that initial characterization and classifica-tion, tries to develop a tool to enable multidisciplinary teams create scenarios and simulation models to confirm if their design patterns are the ones that better suite the requirements of a pervasive displays network.
Contents
Acknowledgments iv
Resumo v
Abstract vi
List of Figures viii
Acronyms xi
1 Introduction 1
1.1 Research Problem . . . 2
1.2 Motivation and Objectives . . . 3
2 Related Work 5 2.1 Public Displays Systems . . . 5
2.1.1 InstantPlaces . . . 6
2.1.2 e-Campus . . . 7
2.1.3 UBI-Hotspot . . . 9
2.1.4 InfoShare . . . 10
2.1.5 Other systems . . . 12
2.2 Other related studies . . . 12
3 Pervasive Displays Networks - A Framing Essay 16 3.1 Pd-Net project . . . 17
3.3 High level abstract Pd-Net Architecture and components . . . 19
3.4 Identify and classify the processes of each network component 23 3.5 Non Critical processes . . . 24
3.6 Critical and repetitive processes . . . 26
3.7 Possible bottlenecks situations . . . 27
4 Simulating Pervasive Displays Networks 30 4.1 Simulation scenario . . . 30
4.2 Network topology . . . 31
4.3 ”Application”/Usage scenario . . . 34
4.4 Scenario specific interactions . . . 35
4.5 Non specific scenario interactions . . . 40
4.6 Simulation Characteristics and Parameters . . . 41
4.7 Scenario specific simulation parameters . . . 43
5 Simulation Deployment/Implementation 45 5.1 Network Simulation Frameworks . . . 45
5.2 OMNet++ Implementation . . . 49
5.3 Component Modules behavior and Message definition . . . 52
5.4 Parameters Input values . . . 57
6 Results and Analysis 62 6.1 Measures and Results . . . 62
6.2 Analysis . . . 64
7 Conclusions 70 7.1 Future Work . . . 71
A Appendix 73
List of Figures
2.1 InstantPlaces architecture. . . 7
2.2 Conceptual e-Campus architecture. . . 8
2.3 Conceptual UBI-Hotspot software architecture. . . 10
2.4 InfoShare architecture. . . 11
2.5 High level architecture. . . 13
2.6 Display personalisation. . . 14
3.1 Draft of the potential Pd-Net architecture. . . 22
4.1 Pervasive Display Network conceptual topology. . . 32
4.2 Pd-Net high level component modules. . . 33
4.3 Privacy Aware - Context Aware interactions. . . 36
4.4 Global Event interactions. . . 37
4.5 Implicit Context Aware interactions. . . 38
4.6 Direct Display interactions. . . 39
4.7 Display Node interactions. . . 40
5.1 Internal module structure of OMNeT++. . . 46
5.2 Tkenv User interface. . . 47
5.3 Full implemented architecture. . . 50
5.4 Display node module . . . 50
5.5 Mobile users module . . . 50
5.6 Full implemented architecture. . . 52
5.7 Fictitious Check in interaction arrival times. . . 55
6.2 Check In message times. . . 65 6.3 Server loads. . . 66 6.4 Mobile applications application times. . . 66 6.5 Display nodes application message and global message times. 67 6.6 Server Loads. . . 67 6.7 Mobile Cluster aggregated times. . . 68 6.8 Display Node cluster aggregated times. . . 69
Acronyms
API Application Programming Interface
IDE Integrated Development Environment
IP Internet Protocol
LAN Local Area Network
MAN Metropolitan Area Network
NED Network Description
QoS Quality of Service
Chapter 1
Introduction
Since the beginning of the computational era, resources are shifting from the centralized single processing unit to the most fully distributed architectures. Most importantly is the changing environment where the computation takes place whether at an office desk or even in our clothes. In fact, nowadays, it is almost impossible to quantify the number of computers that influence directly or indirectly our daily lives. These changes were partly encouraged by the Weiser’s vision of the future of computing, as he said:
”Our computers should be like our childhood - an invisible foundation that is quickly forgotten but always with us, and effortlessly used throughout our lives.”
This means that computers should be seen as a tool that does not con-sume our attention. As Weiser said about eyeglasses, with them ”you look at the world, not the eyeglasses”. He and his team embodied the term Ubiq-uitous Computing anticipating the disruption in the use of computers, that should be spread everywhere without the need of attention [31].
Almost at the same time the term Pervasive Computing was introduced by IBM and was used to describe the research area that has focused its atten-tion more on technologies, trying to create a seamless interacatten-tion between different devices without the need of complex configurations [22]. Firstly the
terms were used separately, one giving attention to the Human Computer In-teraction problems while the other more on core technologies, but currently both terms have been merged and are used interchangeably.
1.1
Research Problem
Deriving from the previous ideas and by the increasing number of public displays, like the ones presented at the airports or at outdoor advertisement spaces, many projects have emerged. For example, the European project Pd-Net1 appears to explore the scientific challenges and new technologies
required to enable the emergence of large-scale networks of pervasive displays. Nowadays, public displays are seen as mere passive elements that always show the same information, not taking care of those who are passing by, they suffer from a lack of content dynamics leading it to an increasingly ”display blindness” in terms of perceived and remembered content [19]. So these projects idea is to explore those public displays to offer people new forms of interaction, providing the foundations for a new communication medium which offers entirely new opportunities for business and creativity, offering the opportunity to display owners to have a platform that have different kind of applications to better serve the interests of those who benefits from those displays.
The architectural elements that compose the network have to be inher-ently distributed and divided into multiple functional components. However, some of those components may be, in some execution patterns, more re-quested or have a more complex and time consuming operation, increasing systems response time. Also those components have to scale to embrace the growth of the network and to be more fault tolerant.
Taking into account the above ideas, we will concentrate our efforts on developing simulations to study and evaluate the scalability properties of different application execution patterns.
We intend to study how those application patterns will behave on this
cooperative ubiquitous environment, mainly in the presence of an augment-ing number of users and execution nodes. This corresponds to analyze the suitability of the above patterns considering the pervasive displays networks assumptions and characteristics.
Will the same web standards also apply, knowing that content and re-sources could be in multiple and potentially far locations? Do they scale up as the well study standard web scenarios? What will be the average re-sponse times when the number of application interactions rises or even when the sensed information floods the system? What will be the impacts on the network with the execution of multiple simultaneous applications with dif-ferent rich and demanding content types or content hosts? How will difdif-ferent application interaction patterns or synchronization demands will affect net-work performance and responsiveness? Are some of the questions that almost immediately appear concerning these networks.
1.2
Motivation and Objectives
The shifting paradigm of digital public displays has undoubtedly a full spec-trum of unexplored concepts. The novelty and emergence of these systems represent a challenging research area that requests ideas from multiple disci-plines of the mobile and ubiquitous computing fields.
Public spaces or semi-public spaces, represent a challenging environment to deploy and test these new systems, and so we have to make the effort to bring new content to displays, turning them into active elements offering op-portunities for people to use them, providing a new communication medium, instead of being passive forgotten actors, like most of the Digital Signage displays.
Information displays, first in paper and years later, with increasingly price reduction, as digital screens, were mainly meant to provide information to those who were passing by. Digital displays represented a big step in what could be presented and those who wanted to announce something could now show much more eye catching contents. Unfortunately, content was quite static and could not be remotely changed. To do that a maintenance team
had to reset, locally, each new content. With continuously network ubiquity and the possibility of interconnecting all electronic devices a new reality rises. Connecting those displays to some remote server turns on the possibility to remotely produce and schedule contents in a much more dynamic way.
Currently, research on Pervasive Displays is mainly focusing on Human Computer Interaction. Teams are aiming their studies in the best way to capture people attention and in the possible interactions between people and displays. With the advances in the research it is also time to start to take care about the design of the network components. The potentially large-scale characteristics of these kind of networks rise inevitably several problems con-cerning scalability and performance. These systems, including Pd-Net, and their inherent innovative nature are characterized by a continuously changing number of users, display owners, content producers, display nodes, applica-tion items, applicaapplica-tion hosts, content types, interacapplica-tion modalities, sensors and connections. In this way, it is needed to make a full study specifying what should do the core components and how would they will be interconnected in a pervasive network.
The outcome of this work is the study of the main tradeoffs in the design of Pervasive Displays Networks in respect to its main core components, pro-tocols and respective interactions. To accomplish these results, simulation should be used as a tool for assessing the operation of the system under vari-ous conditions, addressing the effects of the scale in the system performance. With that it is also intended to understand the main protocol properties. To do that is fundamental to model the core architecture and the core software components and build, based on simulation techniques, a testbed for testing and determining the scalability requirements for different representative sce-narios of use of the network. Components are not yet defined in a restricted way. Currently, there only exists a division in functional blocks that could be rearranged in multiple physical components. The assessment of the per-formance of those multiple combinations will be a major key aspect in this work, trying to point out what should be the optimal distribution or in some form have a set of metrics that give the maximum threshold that does not compromise the stakeholders satisfaction.
Chapter 2
Related Work
Lots of research are daily made worldwide aiming the development of displays systems, turning them more interactive, user-friendly and less obstructive on our lives. The outcome of those works are almost every time purely academic and does not overflows the walls of the universities. What we want is to join the pieces, take the best of the research and create a functional approach to this new communication medium.
In this section, it will be presented some pervasive displays systems and some of the new trends on the Digital Signage both with commercial and non-commercial uses. The main objective is to clarify the main differences in those systems, and current implementations, uncovering new opportunities, requirements and challenges for Pervasive Displays Networks.
2.1
Public Displays Systems
As everything, public displays have evolved from the simplest to the most complex interconnected display networks. Presently, we can divide public digital displays in two major groups, those who simple show some kind of information, most commonly called as Digital Signage Displays, with or with-out some interaction, and those who present some on demand rich content, like the ones suggested in Pd-Net project.
2.1.1
InstantPlaces
This project is held at University of Minho, Portugal, and tries to create a social network for place-based screen media as an instance of the concepts of Pervasive Display Networks. It takes the concept of ”place” to bring to-gether the various stakeholders involved in the operation of public displays. A place arises as an abstraction to reflect one or more physical settings cre-ating a meaningful context for situated social interaction. And so, a place creates a scope of execution, aggregating resources, people and interactions into a single coordination context. People are then invited to influence pub-lic displays interacting and expressing themselves through a series of sensors enabling that communication. One of the most well studied forms of inter-action in this project uses Bluetooth device names to provide input that will be consumed and shown at the place display [14].
A mobile application is also provided to the users where they can manage their identity, creating personas to be used and exposed in each place, visit a place and interact with the place applications. Those applications can be created by third-party creators and then published for display owners to subscribe who can then manage and create a place history with them. The InstantPlaces architecture is divided into four main areas, as it can be seen in Figure 2.1. Each physical place can have a set of displays and sensors that together will provide multiple forms of interaction with the virtual place. That virtual place has associated a set of applications that can be subscribed next to the third-party services and applications component. The called InstantPlaces infrastructure interconnects all components and provides the Application Programming Interface (API) that can be used by applications and users. Users can also access the InstantPlace infrastructure via browser or mobile application. More information can be found at the project web-site1.
Figure 2.1: InstantPlaces architecture.
2.1.2
e-Campus
Is a network of public displays deployed at the campus of Lancaster Univer-sity in the United Kingdom, and it was designed to promote an infrastructure testbed for researchers and artists as also to provide a tool to improve cam-pus experience for those who use it. Many displays were deployed as probes around the campus and with more visibility in the sixth Workshop on Mo-bile Computing Systems and Applications conference, in the Brewery Arts Center exhibition and in an underground campus bus station. While the first two deployments were placed only for a few days, the last is intended to be maintained for, maybe, several years. In all of those deployments, they tried to study and develop an API to satisfy their needs about the scheduling and synchronization problems on displays, for the last one the software was rewritten in order to reflect the lessons of the first two [25].
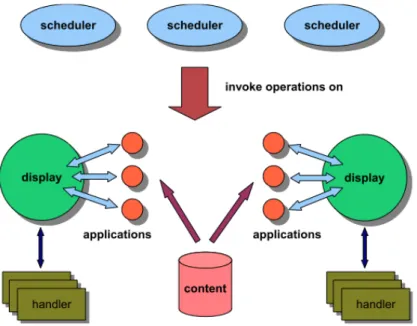
The architecture used by them was mainly designed to embrace the prob-lems of scheduling and synchronization between applications. After their learning process in the first two deployments, they refined their architec-ture and defined four main entities: displays, applications, schedulers and handlers that are coupled together as shown in Figure 2.2 [24].
Figure 2.2: Conceptual e-Campus architecture.
on displays when invoked by the schedulers. Handlers are used to detect conflicts of resources and resolve them. Imagine a display formed by a set of screens, all of them have to be synchronized in order to show the con-tent in a coherent way. All the communication is constructed based on an asynchronous publish-subscribe event channel.
From the deployments, they produced a set of 13 lessons, arranged into five categories: technology and deployment, monitoring and management, content creation and management, orchestrating ubiquitous computing ex-periences and working in public spaces.
It is also interesting to refer that from this project, it has emerged a new display type called FireFly [3] that consists in strings of controlled LED-based lighting elements, together they can form three dimensional displays using each LED as pixels. This is useful because it makes clear that these systems can have multiple forms of outputting their information leaving us thinking outside the box and giving an extra challenge to develop an architecture that gives support to all types of forms to outputting information and contents.
2.1.3
UBI-Hotspot
This project is probably the most interesting of all because it has actually a real large-scale long term city deployment in Oulu, Finland, since 2009, and it was motivated by the lack of these aspects in the current research systems. With their deployment, they left the campus environment and went to the real world where many details much more difficult to control, for example, monitoring services, have to be really working to provide a quick alert system when something goes wrong. In this way, they have gathered several lessons to take in consideration in the creation of these systems[11].
This project has a total of 13 large touch screen displays, six of them in indoors public facilities and seven outdoors. They have achieved many results studying the social and economic impacts of these systems in a real urban environment [21].
They also studied the impacts of providing social-networking services in their applications [13] and made several field studies that let them take some conclusions about the challenges of integration of this kind of services and present a mechanism to seamlessly integrate Facebook’s account within pub-lic displays.
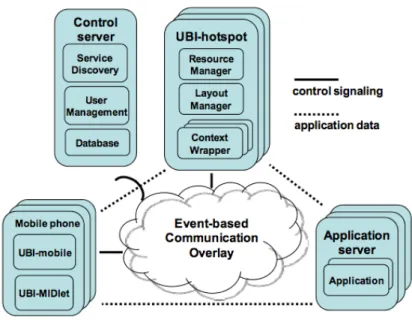
Its architecture, in a very high level approach, relies on a software archi-tecture that defines its components (seen in Figure 2.3) which interacts via an existing implementation of an event-based communication overlay (FUEGO architecture [27]). This overlay takes care of the publish-subscribe commu-nication and other aspects, like the fault tolerance in callbacks [20].
On the UBI-Hotspot, resources are managed by the Resource Manager that receives input events from the context wrappers, and informs the layout manager about the changes, so it can take care about the screen partitioning to each application. People can interact with the hotspot with their mobile devices. To bootstrap the system, users have to read a RFID tag so the UBI-mobile launchs the services associated to the hotspot. Applications can be subscribed next to the application server and be associated to each hotspot. Actually, UBI-Hotspot, is the most complete study of these new perva-sive networks of displays. They have made studies in multiple areas from
Figure 2.3: Conceptual UBI-Hotspot software architecture.
the middleware, the network components and infrastructures, to the display applications even from the interaction in several ways. However, they have much less research on the consequences of the growth of the number of those various components and about synchronization of applications and spread of contents leaving space to several research on these areas. More information about the project can be found at theirs Web Site2.
2.1.4
InfoShare
InfoShare is a multimedia signage system developed and deployed in Keio University, Japan, and it tries to create a distributed and scalable digital signage system. They want to create a Digital Signage system that can be managed remotely contrasting with the old-style systems, that have to be up-dated locally next to each sign. This system is the one who had the biggest concerns about scalability issues. Infoshare architecture resides mainly in a client-server model to communicate with all of his components. Its
tecture relies on four core components: the InfoShare DataBase Server, the InfoShare Content Repository, the InfoShare Web Server and the InfoShare Web Service. This architecture and with whom each component communi-cates can be seen in Figure 2.4. In this way, InfoShare DataBase stores all the information about users, access control privileges, scheduling and the screen layout. The images and videos are stored in the Content Repository. It also
Figure 2.4: InfoShare architecture.
has on screen a Signage Player, who renders the contents. These contents are accessible by the InfoShare Web Service, that communicates with the rest of the system in order to provide the pretended resources. Multimedia resources can also be pulled from external third-party services.
The system can also be managed by is Web Interface, in which users can reschedule contents, manage accounts and monitor the system [26].
Besides this apparently complete architecture, this system does not pro-vide rich contents as the other systems and it has its focus on the distribution
of multimedia content, like news, videos or images. It does not have the con-cept of application to each display. However, their complete studies about the system overall performance [9] can help us a lot in constructing a more efficient and responsive system.
2.1.5
Other systems
Many other systems with commercial and non-commercial uses exist nowa-days. There are many on campus studies with similar approaches to the previous systems, like iDisplays [18], ReflectiveSigns [16], or Plasma Poster Network [4] and others with completely different objectives like GAUDI [15] that is a pervasive navigation system or MobiDiC Shopfinder [17], that uses public displays as an advertising medium and as a route indicator to the shops.
Besides the clear interest of these projects, they are very focused in solve a specific scenario problem and they do not give much attention to the un-derlying network and the scale problems. However, they are very important to settle down some ideas and prevent us to make some mistakes. All of these systems are important to analyze how should the Pd-Net project should em-brace the problem of provide a common flexible architecture to sustain the multiple approaches that may derive from the different research communi-ties. With them we can see what components are mainly used and how they interact, helping us to create a more capable and flexible network.
2.2
Other related studies
To better conduct and inspire our work many other academic studies were revisited. Different scientific areas were covered, from the previously seen works about pervasive displays systems to more specific researches like the ones regarding Human Computer Interaction. We have also dig on the world of network simulators that will be presented further on Chapter 5.
On the work of Sarah Clinch et. al. [6] we were presented with the prob-lematic of design and deploy application stores for public pervasive displays networks.
Along this work the main focus is, obviously, around application stores for public displays, where they make the task of identifying some of their design considerations and how they really differ from the standard mobile application stores. They have also made a categorization about the expec-tations of different types of the system stakeholders and a division between applications regarding the benefits for those stakeholders.
From the point of view of the application developers that study made some considerations about the distribution and control of their applications, the business models and at the end they identify two main interfaces (APIs) to submit an request applications next to the application stores.
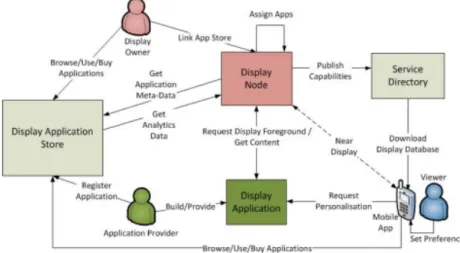
Figure 2.5: High level architecture.
But what really makes a this work so interesting is their vision about the hight level architecture, Figure 2.5, and the processes between their high level components. The architecture itself do not compromise all of the components to create a fully functional pervasive displays network, instead they concerned on those to conduce their study of creating an interface for the application developers.
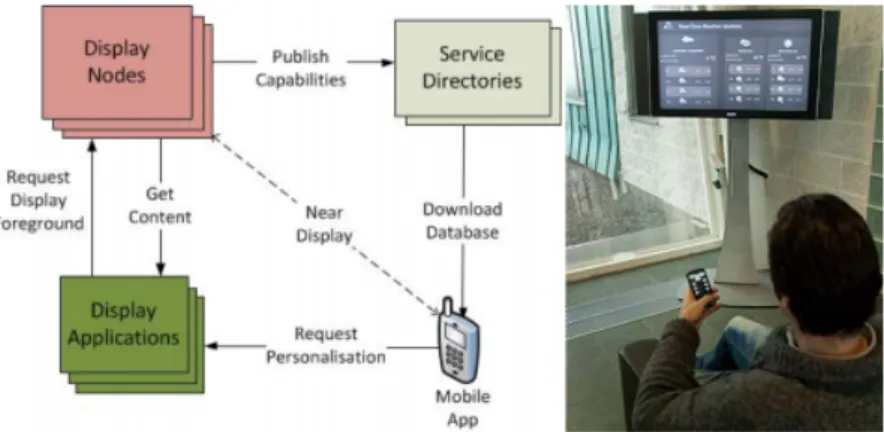
Figure 2.6: Display personalisation.
They have also created their architecture to enable display personalization (Figure 2.6) and defined the interactions for that.
Specifically those interactions, for display personalization, may have a major importance to help us define the best way to model the simulation scenarios.
Another very important contribute to settle down some of our ideas is the paper that rises the question of "How close is close enough?" for applications that regard display appropriation by mobile users [5].
This work tries to measure the impacts of the application location on the user experience. They try to answer to several questions like: a)"Where should an application execute for good user experience?"; b)"Can it execute on a distant cloud with high network latency? Or, is it necessary to execute closer to the display and user?"; c)"Can we quantify the impact of latency on user experience?"
To achieve the proposed goals they have prepared a set of cloudlets spread globally to assess if their location has really an impact on user experience. Then they measure the time between a user request, on his mobile phone, and the display update. Also their gathered a group of participants pre-senting them with a simple game. After the gameplay they have answered
a questionnaire to collect data about their perception of the responsiveness, the usability, their sense of control and their frustration before the game on different locations.
The results were very clear, the distance of the application really affect user experience. On the paper they present the complete set of results and measurements that may be posteriorly taken into consideration.
In the end the main conclusion is that the initial question, "How close is close enough?", do not have a simple answer. It depends on multiple factors: a)"the interaction-intensity of the application"; b)"end-to-end network la-tency (whilst loosely correlated with physical distance, measurements pre-sented here show that the nature of the correlation is complex)"; c)"the host’s hardware and software"; d)"user—some are more tolerant of delays than others. Even the same user may respond differently over time (e.g. becoming less tolerant when in a hurry)".
The set of considerations discussed on this paper are quite interesting for us because it presents some analysis regarding the user experience expecta-tions facing interactive displays applicaexpecta-tions. It also provides some useful latency measurements on different locations that may be applied on our sim-ulation models.
This paper, even not directly, makes a warning showing that if we want to develop a open pervasive displays network we have to give a special attention to the design of underlying system infrastructure because the high variety of users, application types and interactions have to coexist on the same global network.
Chapter 3
Pervasive Displays Networks - A
Framing Essay
The problematic around the pervasive display networks is huge, different computer science disciplines have work together to overcome the inherent questions raised. The creation of an open network ready to embrace a vast number of application, sensors and content types needs to have a clear notion about all the things in stake.
In our work we try to settle down some of the concepts and ideas that round up the pervasive networks, specifically, all that concerns the PD-Net project. This chapter hopes to contribute precisely to achieve that level of eloquence, defining some of the key aspects and characteristics of this large project. We also want to present some concepts that we thought to be very important to assess and simulate these systems, like the description of the main functional components and the categorization of some existing processes. In the end we pretend that the reader have a clear idea about what is a pervasive displays network with the notion of some of the inherent problems that may emerge.
3.1
Pd-Net project
The Pd-Net project has in its foundations the goal of achieve some unique characteristics1 that are not currently found in any digital signage display network. These characteristics, by their nature, quickly raise many chal-lenges, each one of them full of questions that have to be studied to prevent surprises in the future. This ambitious project, if well succeeded, will change the paradigm of the information spreading throughout public spaces and will reach populations in a much more effective form. The set of topics that drive the motivation of this project are:
• Personalized Content - with the usage of multiple sensors, content may be adapted to the public passing by, creating a real and interesting com-munication channel that shows information according personal prefer-ences;
• Support for Multi-Screen Applications and Content - this project tries to offer a open system that is able to support applications that can coordinate a set of displays across the network, like interactive multi-display games, and spreading contents in a coordinated and even on a synchronous form;
• Context-Aware and Situated/Mobile Content - usually digital signage systems broadcast their contents without care about the location or the interests of the receivers. Pd-Net objective is provide differentiated contents according to the users preferences, sensing the environment surrounding the displays, pleasing them, not with static and immutable contents but with some meaning and benefit;
• Global Reach - Pd-Net aims to interconnect multiple existing signage systems in a large network in order to offer new social economic ex-periences, expanding the possibilities of distributing applications more easily;
• Public Access (Ingestion and Consumption) - multiple forms of pro-viding and gathering contents, trying to merge distinct forms of in-formation consumption, forming the public displays with more general contents, mobile devices with private and personal contents or other display mediums that could be connected to the network;
• Interactive - wants to offer the possibility to directly interact and in-fluence the displays unlike most of the existing signage systems;
• Rich Media - provide support for various types of media, audio, video and interactive applications, that should contribute to radically change the digital signage panorama promoting its public usage and accep-tance.
The goals are daring but, if we were successful achieving them Pd-Net will, certainly, create radical changes in information dissemination on public spaces. Hence, there exists the demand of identify and coordinate, even loosely, the different stakeholders that should enable a rich environment to sustain the network.
3.2
Identify stakeholders and actions
In any system, the identification of who are the main stakeholders [28] and what kind of actions they play [1] is one of the first and more important steps to better align the design of the system architecture, so it can have a best fitted and integrated execution between all of them. Pd-Net recognizes three major stakeholders with a different set of behaviors, requirements and needs.
Viewer Implicitly or explicitly influences the system execution, consuming and producing contents. They could have the need, in some applications, to have a previous account registration to have a full access and usage of it;
Display Owner Is responsible for the displays installation and mainte-nance. He has the responsibility to subscribe, to schedule and to manage
applications. Contents (3rd party or user generated) regulation can also be under his scope;
Application Developer Creates applications to be used on the displays network. They have to submit and update applications to the application stores. They have also to take care about the applications charges to his costumers.
Content providers could also be seen as a system entity, however we as-sume that the contents provided are under the direct competence of the application developers or even the display owners. We do not have them as system stakeholders but as a sub-entity that makes part of the system but does not have a direct influence on it without the wills of the other stakeholders.
Although this set of stakeholders and actions may appear very simple, the underlying architecture has to give response to a myriad of interactions. The components have to cooperate to provide these functionalities to all the intervenients.
3.3
High level abstract Pd-Net Architecture and
components
Other starting point of any work is to identify the main functional compo-nents that are needed to accomplish the proposed goals. In this section, the main functional blocks compose the Pd-Net network will be described. These components should not be seen as rigid and immutable architectural elements, they could, in fact, not exist or be coupled together in multiple combinations according the needs. Hence those components are seen as key functional services responsible for enabling an open and pervasive architec-ture as Pd-Net claims.
Display Node A Display Node, sometimes called Pd-Net Node, is the ele-ment responsible for, at least, generating content to one or more display medi-ums. To achieve this minimum goal may be imperative to have a represen-tation of its current content subscriptions, schedulers and content renderers. However it could be capable of executing more functions as self-monitoring, sensing or cache content.
The display medium is directly controlled by a display node and it can have any kind of hardware since capable to reproduce some type of content. Often is assumed that this hardware has a visual form to display its content, however it could assume multiple forms, from the more simple to the most complex sound, smell or visual renderer.
Environment Service This service creates a meaningful representation of a physical or abstract situated context based in the concepts of, for example, place, event or activity. With this service we may manage and situate the resources associated to these environments creating scopes of usage and ex-ecution, converging people, interactions, resources, sensors and applications under the same coordination context.
It could also be responsible for some sensing and interaction information associated to each environment providing services to those who want to create environment aware applications. This service could also store information about the practices and habits taken in each environment.
Display Service It controls one or a group of displays, concerning content and display behavior, allowing the owners to orchestrate and schedule content and content sources, defining the display actions.
Directory Service This component is responsible for providing the in-formation about the existing nodes, taking care about some location based queries to the system.
Node Registry Handles the remote management of a set of Pd-Net nodes mainly concerning about scheduling, however it will be also responsible for
the node bootstraping process, allowing nodes to identify and describing themselves for the first time next to the system. This service could even enable some tasks not related with scheduling, as logging or monitoring, supporting some operations such as turning on or off or activating emergency messages.
Sensor Registry Is a service to allow local physical sensors to describe themselves to the network and initialize the sensing into specific environment services.
Application Store In this component applications are self described and distributed according requests.Display owners may then assess if applications fulfill their content needs and can make subscriptions to their displays. This service is also intended to provide other functionalities like payment and application usage logging.
Applications Are the responsible for generate content to be rendered on the displays, those applications need to be able to describe themselves and be configured to better adapt to each content scheduling scope or situated-ness constraints. In this first vision, display applications should be executed remotely and just send the sufficient information to render contents near the displays.
Third-party Content Sources These sources are external to the Pd-Net project scope, they are created and managed by external entities. Hence they are out of our management we could suggest some requirements they could follow in order of provide satisfactory services to the clients, specially those who are created just to enrich signage systems.
The components described above are not yet organized in a final architec-tural form and, in fact, they could be coupled together in just one physical element, notwithstanding they have to operate in a predetermined way. How-ever we suggest a minimal component division, to decentralize operation and
offer a more flexible and expansible system.
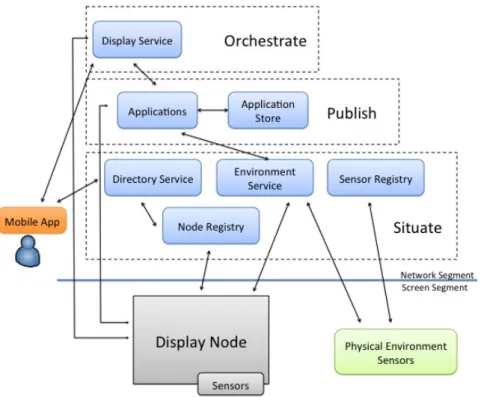
In this way is expected that the Pd-Net architecture should have the com-ponents and the arrangement as seen in Figure 3.1. As figure shows there are two ”regions” where we can dispose components, the Network Segment and the Screen Segment. In the screen segment should be the parts that are in direct contact with the final users of the system (display nodes with the associated sensors, the physical sensors and the mobile applications running on personal mobile equipments). On the other hand, on the network seg-ment should be all the components that sustain the operation of the displays respective applications. We also present a subdivision of the network seg-ment components to better understand the key functionalities and processes associated to each one of them.
Figure 3.1: Draft of the potential Pd-Net architecture.
The Orchestrate layer is responsible for the arrangement of the applica-tions under a certain expected experience of usage of a display or a set of
displays, it should comprehend the scheduling definition rules and content selection rules. The Publish layer appears as the layer responsible for the creation and distribution of contents to be consumed by the users without having concerns about any scheduling or by who or where the contents will be shown. Finally, the Situate layer is focused on provide support for all context situations around displays from the information about the sensors, the on going interactions or bootstrap processes.
3.4
Identify and classify the processes of each
network component
In the proposed architecture we can, at a first sight, detect and identify some of the parts where the system can have a more relaxed actuation, possibly having an asynchronous communication, or a more instantaneous synchronous communication. In fact, we will clearly assume on this study that, in a very raw vision, the processes that do not directly influence with the user interaction and feedback can be classified as non critical, having the possibility of being delayed or rescheduled to be treated after. Users quality of interaction is the key goal to achieve with the network performance, so the processes that only take care about system maintenance, for example the process of submitting a new application to the store, have more opportuni-ties to be ”slow”. This happens because those processes may be delayed for later executions and eventually do not interfere with the users perception of the system. What we propose is to classify the communication processes between components as ”Critical” and ”Non Critical” to better understand where we the teams should focus their efforts, at middleware and the network level, maybe applying complex scalability techniques to improve the overall performance.
3.5
Non Critical processes
Looking to the Pd-Net abstract architecture we can identify the processes that are non critic by understanding where the system can have a more flex-ible response time, not compromising the user experience before the system. This important assumption may lead to some uncertainties classifying some processes, however we assume that, if some process do not have a component that do not directly interact with the final user it should be non critical.
Bootstrap The Pd-Net node bootstrapping process (adding one or more Pd-Net nodes to the system) and its subsequent operations, can be treated as non problematic. Firstly, this operation should occur just once for each node, then it does not have to be made in real-time. This configuration process can be made when the network load is lower, for example, at night when the usage of the system is expected to be lower. As this process does not directly influences the user experience it can have the non critical classification. The steps that have to be made to achieve the bootstrapping are:
• 1) Node registration - Each new Pd-Net node contacts a Node Registry to describe itself to the network, establishing ownership and to initialize the required procedures to drive content control.
• 1a) Environment resource registration - Local environment sensors sends its describing parameters to the Sensor Registry service allowing the sensing into the Environment Service.
• 2) Directory Service Bootstrap - Directory service will often contact one or more Node Registry services to gather information about the existing nodes, in order to provide location based services.
Application registration The communication process of registering an application by its developer should not represent a problem concerning the network performance. We assume that such process has a non urgent nature, communication can be delayed until the network has a more relaxed state,
without high loads, and it should occur just a few times, while propagat-ing the application description throughout multiple application stores. The application registration definition is:
• 1) Application Registration - Every developer who wants to deploy an application should contact directly one Application store and submit is own application, describing what can it do and what resources it needs. The spreading process throughout other stores, should be transparent to the developer, although he may limit the application usage.
Application selection (Non-Interactive) The process of selecting ap-plications by the display owner, to be integrated next to their Pd-Net nodes also may not have to be ”instantaneously” communicated to the Display Ser-vice. This process has little influence in user feedback. We assume that, the major consequence is the impossibility of the node to provide the application while the display service has no knowledge of it. However users do not per-ceive this fact because they cannot have expectations about the contents of the nodes and do not play an active role in the orchestration phase. In this way these operations may be delayed to be later treated because they do not have real time constraints. To select non interactively applications we need:
• 1) Application selection - Display owners define what applications would be available on their display nodes. As consequence, display service re-ceives the application description from the application stores and builds the orchestration accordingly.
• 2) Application Initialization - To achieve the desired application exe-cution there has to be some initial configuration and scheduling proce-dures.
• 3) Describing behavior / Schedules to Nodes - Display service commu-nicates to the display node the orchestration information describing its behavior with the references to the remote application.
3.6
Critical and repetitive processes
The identification of the processes that can suffer with more stress situa-tions is an important step to make a more accurate study. With that pre-categorization we can focus the simulation studies mainly to this type of processes. Having more information about such processes, it may be possi-ble to propose alternatives to their design, persecuting the improvement of the system overall performance. These processes have, by nature, to be ex-tremely responsive because they will, very probably, be involved with users interaction, so the response times should meet those user interaction require-ments.
Any process that compromises any synchronization has to be a fast and highly interactive process also any kind of user sensing and feedback has to be top priority for the network communication, hoping to achieve a good user satisfaction.
Interactive/context-aware application These types of applications have a very demanding real-time characteristics, imagine an application that de-pends on a sensorial information to adapt their behavior when a user is near or a interactive game between displays, the interaction opportunity is lost if information does not arrive on that exact instant, leading to a user distrust that can ultimately abandon the usage of that application. The set of steps that compound these application processes are:
• 1) Sensing / situating applications - When the sensors at the nodes detects some relevant change or interaction it contacts the Environment Service in order to describe what is happening.
• 2) Content generation by application - Applications should be able to render content accordingly a set of previous interactions with the viewers.
• 3) Environment Service feedback - After receiving the sensor informa-tion the Environment Service should provide some descripinforma-tion to the right applications so they can adjust their execution accordingly.
Privacy-aware context aware application These applications, execut-ing in the viewers mobile phone, have strong requirements respectexecut-ing response times.Users experience can be severely damaged if a user performed interac-tion does not return a response at the expected moment, usually immediately, in real time. To have applications running on any mobile device, probably, several steps have to be made until the user can start his interactions. As example, an application needs to gather information about nearby displays before the user can start the expected interaction. From the beginning of that process until final user interaction the system has to be prepared to accomplish those requirements in not more than a few seconds. Failing to accomplish this goal, users may disregard the system usage, possibly, result-ing in some economical damages to applications and display owners. The steps that an application of this kind has to achieve are:
• 1) Look-up near displays - Mobile applications should contact the Di-rectory service to get the information about the near displays.
• 2) Select application in Display Service - The Display Service receives from the clients the information about what application should be se-lected.
• 3) Request behavior - Display service sends to the Pd-Net node the user request to change the execution pattern on the node.
Although third-party content sources are out of the spectrum of the Pd-Net network they should be sufficiently responsive to be part of the system. Users experience may be extremely affected and compromise system usage if the response times requirements were not satisfied.
3.7
Possible bottlenecks situations
The potentially large-scale nature of these pervasive networks raises lots of scalability barriers that have to be overtaken. The dynamism of content and behavior in different usage scenarios of the network had to be taken in consideration, so it is very important to point out some of the variations
that can lead to overall performance decreasing. In this way, the constantly changing number of the following items have to be taken into consideration. Bottleneck points are very likely to emerge, not only associated with one specific dimension but with the combination of other dimensions, leading to a more complex analysis.
The situations and processes that we have anticipated are:
Applications used in many places Assuming that applications running on displays are Web applications, the potentially large number of applications subscriptions could lead to server overloads that have to be managed;
Applications that generate many interactions or that heavily relies on sensing Applications that generate many interactions may generate to problems next to the Environment Service, overloading them with requests asking for sensing information;
Directory service serving mobile nodes Dealing with multiple simul-taneous requests from mobile nodes may slow down Directory Service re-sponsiveness;
Synchronization contexts with a set of nodes operating in a tight interaction relation Applications that demand a rigid synchronization between nodes may have its execution delayed by their communication;
Display nodes The increasing number of display nodes can lead to prob-lems concerning the synchronization protocols, naming schemes among oth-ers;
Pd-Net node users The number of simultaneous users in a node or in multiple nodes may affect the system responsiveness, overloading the node with requests;
Application interactions The highly interactive applications may have to exchange, in short periods of time, large amounts of data compromising the responsiveness of the system;
Content hosts, content producers and content items The constantly augment in number of these three, can lead to registration and content dis-covery higher dissemination times;
Simultaneous application executions The processing, scheduling and synchronization demands on the node can be compromised by the number of simultaneous execution;
Display owners Can lead to high rates of management messages and to privacy or security models;
Content types The increasing number of different data types can degrade the system performance, for example, video streaming can lead to a high network overload;
Interaction sensors Multiple sensors providing sensing information can overload the environment servers with to much information delaying the pro-cess of create context aware scenarios.
The previous points will very probably appear during the lifetime of our pervasive system so it is very important to have them in mind. Our effort to describe them, even not very formally, has the objective to alert the develop-ers that many problems may emerge on this pervasive system due to multiple factors. Those factors that we have tried to point out should also be, later on, on our simulations assessed if they really exist and in what circumstances they appear.
Having them in mind will certainly help us to walk around some problems in the early stages of design of the middlewares and network that will operate on the Pd-net system.
Chapter 4
Simulating Pervasive Displays
Networks
Pervasive displays networks with their multitude of connections and compo-nents have inherently a high level of complexity when considering creating a simulation model.
In this context, we propose the creation of a simulation scenario as a key step to have a starting point to understand the characteristics of those networks. In this chapter will be presented and discussed the entire process of creating a case study with some alternatives and decisions. Trying in the end to have a clear idea about the requirements that have to be satisfied in order of achieve the creation of a simulation testbed for pervasive displays networks. Describing building blocks of a simulation scenario with all of its inherent characteristics, from the network topology to the present interactions, and the expected resulting data.
4.1
Simulation scenario
To have a fully functional simulation scenario various steps have to be ac-complished, namely, the creation of a network topology with all the physical or abstract components that make part of the system, their connections, the communication workflow and the adjustments to the parameters that are
suitable to our demands.
The communication workflow will be justified with the creation of an ap-plication scenario that considers the relevant interactions within the system. As we have seen, the categorization of processes in "critical" and "non crit-ical" will guide us with the creation of the application scenario, by clearly showing the execution patterns to be analyzed.
4.2
Network topology
The base layer to collect data throughout simulation is the creation of the network component nodes and their respective interconnections, implement-ing their topology.
The ideal scenario is to obtain a modular simulation model to allow us to program our components with different functionalities and reproduce them as many times as we want. What we envisioned to design our topology was clear division of the core system components from the display nodes and the system users, as seen in Figure 4.1.
We have made a separation between sets of display nodes and mobile users of the system, clustering them, to achieve a better definition of "regions" of displays. We imagine those "regions" as different villages, cities or countries, hoping with this decision to better target the further simulation parameter values into those execution scopes. Also, as the ratio between display node users and mobile users may be significantly different in certain situations, this division seems to be a good way to focus our attention on those details. On the other hand, the underlying infrastructure, on the Network Seg-ment, pretends to be a open network that cooperates and where the compo-nents work together to provide us the expected resources, Figure 4.2. There-fore we can have functional components that could be implemented and in-stantiated in many ways.
Having this high level functional component modules we could hide all the inner complex decisions and define them later. This happens because we do not know yet how are the middlewares implemented and how will be the physical distribution of those components. The efforts of replacing the
Figure 4.1: Pervasive Display Network conceptual topology.
modules with the adequate middleware decisions, to solve specific problems of those parts of the system, will be kept in stand by, waiting for the re-sults of our first simulations and advances made by other project working teams. However with the creation of adequate modules and with the correct simulation parameters we can perfectly represent the characteristics of per-vasive networks with their heavy demands of computational resources near the populations of users around the displays.
We can connect, multiple displays and mobile users clusters to one single pervasive architecture not thinking, by now, on its operational strategies to serve them with content, we just have the way of how is the communication flow between functional components. This modular approach should also provide an added value, in the future, for implement and test the best scala-bility technique for each particular component by just replacing its instance. Its important to emphasize that those components that make part of the Network Segment will only have one instance of each one, isolating, with this
approach, more easily the bottlenecking points of the system.
This representation of our pervasive network have a good resemblance with the design of the traditional mobile networks [10] that is one of the best and well stablished example of a pervasive network. That is because we make the parallel between the cells division and our display and mobile users clusters having the same underlying infrastructure, maybe with differ-ent hardware capabilities, that work and cooperate together to serve us with their resources. Of course there are significant different objectives within these two networks and for now its complexity are not even close to each other, however a brief look on some used strategies may be useful to the study of our system.
4.3
”Application”/Usage scenario
The second major step to create a simulation scenario is the creation of a flow of execution that will correspond to some application modus operandi, in order to provide some realism to the simulation. Those execution patterns should correspond to some real or potentially real application. With this we expect to better understand the needs and the characteristics of these pervasive applications. The Walk to School programme [8] appears as a good example of a realistic application scenario. It is probably the envisioned scenario that have more explicit and implicit user interactions as well a more demanding execution in terms of resources of the underlying system so it emerges as a good starting point to deploy those interactions on a simulation framework.
Walk to School programme - Influencing Behaviour
Jack is six years old and participates in his local ”walk to school programme” - an initiative aimed at increasing fitness among school children and address-ing childhood obesity. To encourage participation among children a simple game has been deployed on the area’s public display network. As Jack walks to school he passes a number of public displays. At each display he sees a cartoon character that gives him an update on his own progress and that of his friends. By visiting the displays Jack also collects ”golden leaves” on his mobile phone - when he has enough of these leaves his school redeems them form a sticker book.
With this small introductory scenario we may now detail the possible interac-tions between the system and users creating a flow of execution expected to be performed by the users in certain daily periods. However, to do that, we have to take in care some assumptions and requirements. We do not pretend to simulate all the stages of the deployment and usage of the system and the application, although sometimes major problems of the systems came from the most unexpected interactions.
a specific usage scenario from those who are always present to sustain the systems integrity and functionality, so we could easily create different or more scenarios of usage, creating a more real system operation, without having to create from the scratch every single interaction. Once more, we claim that multiple assumptions have to be taken in care because the deployment of all interactions and execution patterns into a simulation framework appears to be almost unfeasible.
4.4
Scenario specific interactions
There are interactions that only have meaning in some specific scenario us-ages, for example, every mobile application will potentially have an interac-tion flow absolutely different from another one because of the demands of which one of them. In our Walk to school programme scenario we have an mobile application were kids can bootstrap to the system and collect their ”golden leaves”, this specific set of actions create a usage pattern that is necessarily different from another one.
Figure 4.3 depicts the interactions generated by the action of collect a golden leave. As the diagram shows, when a kid wants to collect a leave has to explicitly contact the system, starting his mobile Walk to School application, It automatically contacts the Directory Service to gather the list of displays near him, performing a LookUp (Figure 4.3 step 1), then he has to choose the display that he want to interact with. Now this ”check in” process is made next to the Environment Service (Figure 4.3 step 2). After that he can perform the interactions that lets him to collect the leave (Figure 4.3 step 3). Those interactions could have a wide range of possibilities, assuming that the application have more options than directly collect the leave, however we can define a different number of interactions that each person would realize until complete the gathering of the leaves. Collecting them may also, lead to the need of rescheduling or update some state, thus the application may have to contact the system in order to request some behavioral change of an individual or a set of displays (Figure 4.3 step 3.1). The system, more specifically the Display Service will be in charge of contacting the displays
Figure 4.3: Privacy Aware - Context Aware interactions.
passing instructions of what the displays have to do in the immediate future (Figure 4.3 step 3.1.1, 4 and 4.1).
All these interactions are part of a utilization context that we call Privacy Aware - Context Aware and it has to occur every time a user wants to collect a leave on a different display.
The previous interaction sequence may generate a global report to all dis-plays that are using the application. For example, a special leave that can be collected from now on, or that a new record has been beaten. That can be seen on Figure 4.4, the Dispay Service receives the global message re-quest (Figure 4.4 step 1), computes the right receivers and sends a broadcast
Figure 4.4: Global Event interactions.
message to the Display Nodes (Figure 4.4 step 1.1). The display nodes that receives the global message request will then contact the applications to up-date their inner state (Figure 4.4 step 2).
Pervasive display systems have, the possibility of somehow sense nearby persons automatically adapt their behavior accordingly. In our simulation, physical sensors, could sense the presence of the individuals that are walking on the display neighborhood, contacting the system, sending or updating the state around them. Figure 4.5 depicts the interactions that compose the Im-plicit Context Aware scenario of interactions. Thus, when physical sensors sense some relevant context change or sense some specific user, it contacts the system to send that information (Figure 4.5 step 1). The Environment Service has the function of collect that information and make it available. Applications on the other hand, may now, frequently query the system to update their internal information and send them to the displays (Figure 4.5 steps 2, 2.1 and 2.1.1).
Figure 4.5: Implicit Context Aware interactions.
Another interaction possible to be seen in almost any display systems is the one where the users interact with the system directly with the displays with some touchable surface. In this case Figure 4.6 presents what may occur after that direct display interaction by some user (Figure 4.6 step 1). After interact with the application, users suppose to have some kind feedback (Figure 4.6 step 1.1.1.1). However that feedback, in order of having correct contents, may have to be enriched with some contextual information (Figure 4.6 step 1.1 and 1.1.1). Also, after those direct interactions the applications may have the need to broadcast some message, contacting the Display Service to manage that request (Figure 4.6 step 1.1.1.2). The following steps to accomplish that request have already been seen in Figure 4.4
4.5
Non specific scenario interactions
This set of non specific scenario interactions are performed to maintain sys-tems integrity independently of the usage scenario. The separation and cat-egorization of those interactions are required to have a tight system testbed. With that separation we can also create more scenario specific interactions on top of these non specific scenario interactions and simulate them at the same time, not having to perform significant changes on previous implementations. In the end we expect to have more realistic results about the performance of our architecture.
Although being, at a first sight, non critical interactions, because appar-ently they do not influence directly the user experience, they are important for several reasons. Particularly, some of communications cannot be delayed or cached, if so, they could lead to some system incongruence, that would damage users quality of information provided and the mere fact of exist-ing these set of interactions, just for system own maintenance, between his components could lead to a systems overload, compromising the adequate re-sponse to the users, affecting their quality of experience. In our simulations
Figure 4.7: Display Node interactions.
we have only implemented the ones that would help us to create data struc-tures containing information that would be useful to achieve integrity and
coherence about the displays, facilitating the production of the simulation code.
The Figure 4.7 depicts the two implemented interactions, that are the Display Node bootstrapping to the system, in the Node Registry, and the consequent polling from the Directory Service requesting for some relevant update.
Although, despite not implemented, we can point out some interactions that have to be inevitably performed to maintain a correct system state. Those interactions and can be seen as requirements and assumptions to achieve a functional integrity of the system. Among others, the interactions that we assume in this computational environment, in a very raw vision, are:
• 3rd party Applications are registered on the Application Stores • Applications are subscripted by the Display Nodes
• Physical sensors are registered at the Sensor Registries • Users have already their profiles kept on the system
• The system is able to schedule any Application, explicitly or implicitly • The system is constantly logging his state and operations
• The system is able to detect and recover from incorrect functional states With this, simulations will only represent the states of interaction by the users with the system, assuming that all the system are loaded and prepared to handle the requests.
4.6
Simulation Characteristics and Parameters
One of the problems with the study of pervasive network architectures is the uncertainty about the dispersion of the functional and physical elements that