THE COMPONENTS OF
SERVICE
QUALITY
ABSTRACT
This research examines service quality perceptions in the transportation industry. First, it analyses the theory about service quality conceptualization. Then a modified SERVQUAL instrument is developed, and applied to the inter-city bus industry using as subject one of the largest Portuguese bus companies: Resende.
The present investigation critically analyses SERVQUAL: an instrument that its authors - Parasuraman, Zeithaml, and Berry- want to be of general application. It determines the service quality dimensions of the bus industry, and quantifies Resende's service quality. Five service dimensions are identified: READINESStRELIABILITY, TRUST, COMFORT, SECURITY, and ACCESS. They are examined in terms of their impact of customers' overall quality perception and their willingness to recommend the firm to a friend. These variables are found to be affected heavily by two dimensions: trust and comfort.
Times have changed. Portugal is no longer predominantly a manufacturing nation. We are now in the midst of a new service economy, where personal relationships are becoming crucial and even more important than product performance.
No marketing is needed if it simply means discounting. Sell services through quality.
Perhaps no single word has appeared more often in services literature during the last 12 months than "quality". Designing and marketing high quality services is likely to be a strategic issue through the 1990s.
Adapted from Arch G. Woodside, from Roger G. Langevin and from lshikawa
The old wisdom, "what gets measured, gets done," applies directly to achieving meaningful increases in quality.
"Quality does not improve, until you measure it." "You only can manage, what you can measure."
CONTENTS
1. INTRODUCTION
-
PROBLEM DEVELOPMENTPage
1 0
2. NATURE OF SERVICE QUALITY
2.1. SERVICE'S UNlQLlE CHARACTERISTICS
a) Classification of Properties between Goods and Services b) Services' Characteristics
c) Expanded Marketing-Mix for Services
2.2. CONCEPTUALIZATION OF SERVICE QUALITY
2.2.1. 'THE DIFFERENT MEANINGS OF "QUALITY" IN M E EVERYDAY lANGUAGE
2.2.2. PRODUCT-AlTRIBUTE APPROACH TO SERVICE QUALITY
22.3. CONSUMER-SATISFACTION APPROACH TO SERVICE QUAUTY
2.2.4. "QUALITY EPIPHENOMENONn
2.2.5. TECHNICAL QUALITY, FUNCTIONAL QUALITY
AND CORPORATE QUAUTY
2.2.6. PERCEIVED QUALITY VERSUS OBJECTIVE QUALITY
2.2.7. QUALITY AS ATTITUDE
2.2.8. QUALITY VERSUS SATISFACTION
2.2.9. QUALITY AND VALLIE IN THE CONSLIMPTION EXPERIENCE
22.1 0. EXPECTATIONS COMPARED TO PERCEPTIONS
22.1 1. CONCLUSIONS OF SERVICE QUAUTY CONCEPTUALIZATION
2.3. INVESTIGATION OF SERVICE QUAUTY PERCEPTIONS
23.1. INSIGHTS OBTAINED FROM EXPLORATORY INVESTIGATION AND
A SERVICE QUAUTY MODEL
a) The four Gaps on the organization side of the model b) The Gap on the customers side of the model
2.3.2. EXTENDED SERVICE QUALITY MODEL
2.3.3. DETERMINANTS OF PERCEIVED SERVICE QUAUTY
2.3.4. PROPERTIES IN EVALUATING QUAUTY: SEARCH,
EXPERIENCE, AND CREDENCE PROPERTIES
2.4. SERVQUAL :A MULTI-ITEM SCALE FOR MEASURING
PERCEPTIONS OF SERVICE QUAUTY
2.4.1. DIMENSIONS OF SERVICE QUALITY
2.4.2. RELATIVE IMPORTANCE OF SERVQUAL DIMENSIONS
2.4.3. APPLICATIONS OF SERVQUAL
2.5. CRfrICISMS OF THE SERVQUAL
2.6. CONCLUSION OF'THE PRECEDING REVIEW
3. THE STUDY
3.1. AN APPLICAI-ION TO BUS INDUSTRY
3.2. OTHER BUS TRANSPORTATION INVESTIGATIONS
4. METHODOLOGY
4.1. DEVELOPMENT OF CUSTOMER SATISFACTION QUESTIONNAIRE
4.1 .l. DETERMINATION OF BUS CUSTOMER REQUIREMENTS (1) the development approach of the quality dimensions
(2) the critical incident approach
4.1.2. BUS QUAUTY DIMENSIONS AND SA'TISFACTION ITEMS
4.1 3. CUSTOMER SATISFACTION QUESTIONNAIRE CONSTRUCTION a) Items in the questionnaire
b) Response format
c) 'The Questionnaire Introduction
5. RESULTS
5.1. DESCRIPTIVE STATISTICS
5.2. CORRELATION
5.3. SCALE VALIDITY
5.4. THEORE-TICAL DIMENSIONS
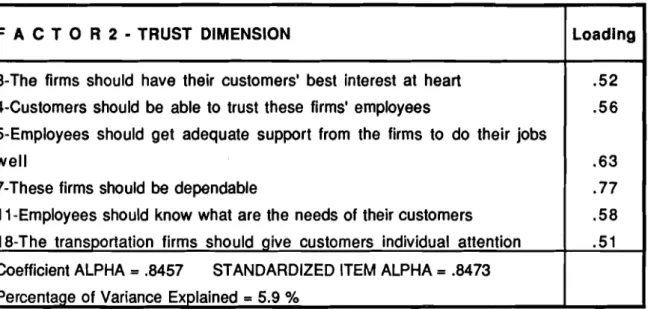
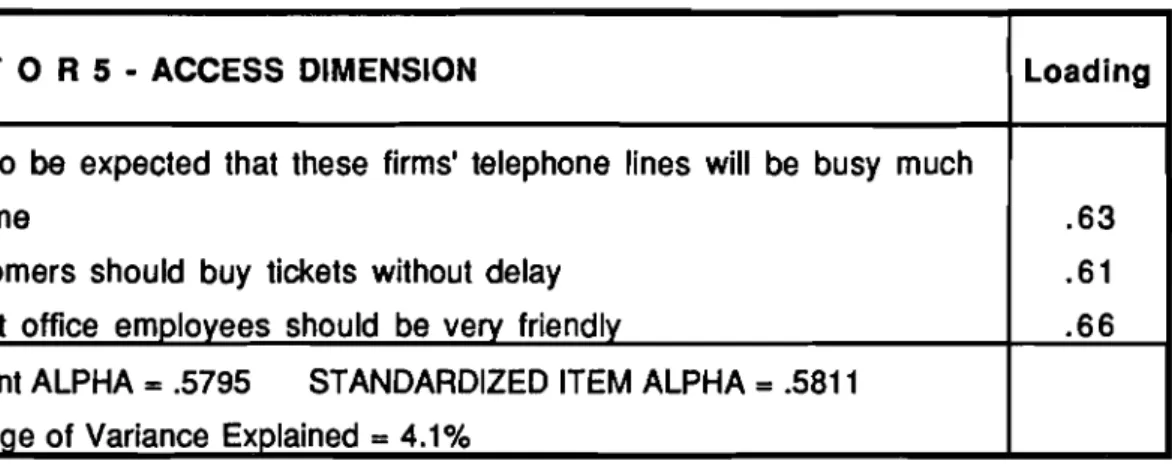
5.5. FACTOR ANALYSIS
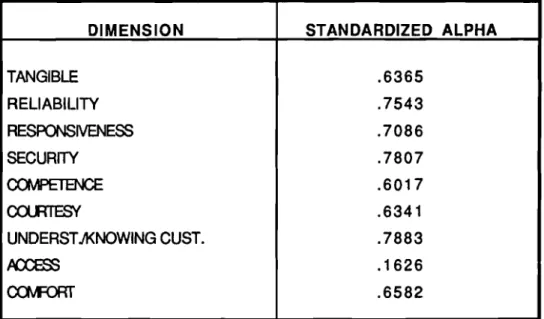
5.6. RELIABILITY ANALYSIS
5.8. VARIANCE ANALYSIS 7 9 5.9. THE LINKAGE BETWEEN: THE DIMENSIONS, THE QUAUTY
PERCEPTON AND THE RECOMMENDATION DECISIONS 8 1
6. DISCUSSION 6.1. LIMITATIONS 6.2. DISCUSSION
7. CONCLUSIONS 7.1. CONCLUSIONS 72. FUTURE RESEARCH 7.3. FINAL COMMENTS
REFERENCES 1 0 1
APPENDIX 1 0 9
1
-
CHARACTERISTICS DESCRIBED AS CRITICAL INCIDENTS 1 0 9 2 - TRANSPORTATION SERVICE QUALITY ITEMS BY QUALITY DIMENSION 1 1 13 - TRANSPORTATION SERVICE QUAIJTY SURVEY 1 1 3
4 - ITEMS STATISTICS SUMMARY 1 3 1
5
-
DESCRIPTIVE STATISTICS OF THE QUESTIONNAIRE 1 3 2 6-
CORRELATION OF EXPECT, PERC, QUAL ITEMS WITH OQ QUESTION 1 7 2 7-
RELIABILITY ANALYSIS OF QUAL WITH THE NINE THEORETICALDIMENSIONS 1 7 5
8 - FACTOR ANALYSIS 1 8 4
9 - RELIABII-ITY ANALYSIS 1 9 1
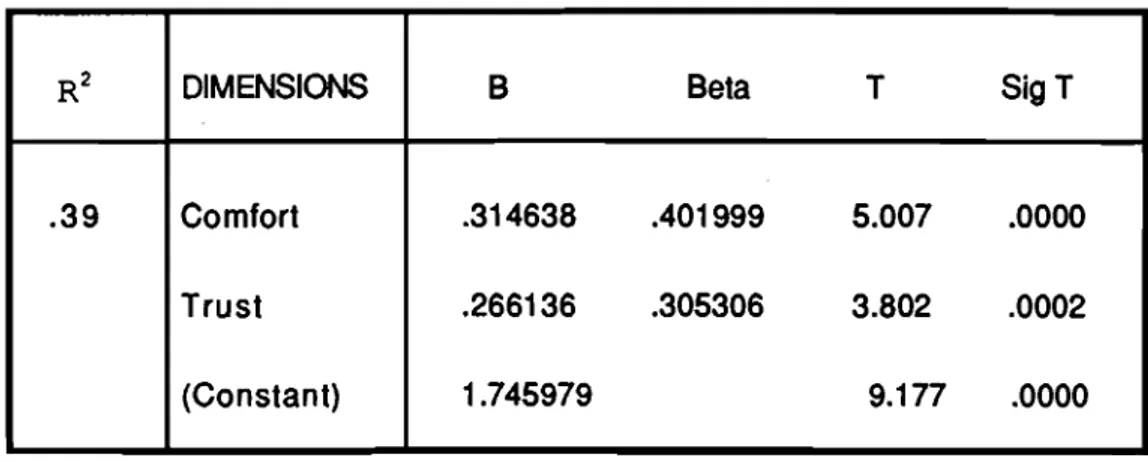
1 0 - M U L T I P L E R E G R E S S I O N 2 9 6
11
-
VARIANCE ANALYSIS - SIGNIFICANT MEANDIFFERENCES OF SEVERAL VARIABLES 2 0 2
12
-
CORRELATION BETWEEN DIMENSIONS, OVERALLQUAUTY PERCEP-TIION, AND WILLINGNESS TO RECOMMEND 2 1 1
1 3 - M U L T I P L E R E G R E S S I O N 2 1 2
1 4 - M U L T I P L E R E G R E S S I O N 2 1 4
15
-
REGRESSION BETWEEN OQ AND WR 2 1 616
- VARIANCE ANALYSIS - SIGNIFICANT MEAN DIFFERENCES OF
DIMENSIONS AND HR 2 1 8
FIGURES INDEX
1
-
TECHNICAL QUALITY AND FUNCTIONAL QUALITY 2- PERCEIVED SERVICE QUALITY3- SERVICE QUALITY MODEL
4- GAPS MODEL OF SERVICE QUALITY 5- GAP 5 AND GAP 6
6 EXrENDED CONCEPTUAL SERVICE QUAIJTY MODEL 7- DETERMINANTS OF PERCEIVED SERVICE QUALITY 8 - A HYPOTHESIZED LINKAGE GENERAL STRUCTURE
OF THE QUALITY-RECOMMENDATION LINKAGE
9- A HYPOTHESIZED MODEL OF THE QUALITY-RECOMMENDATION LINKAGE
Page
TABLES INDEX
1- QUAUTY CLASSIFICATION BASED ON THREE DIMENSIONS 2
-
PARASURAMAN, ZEITHAML, AND BERRY DIMENSIONS 3-
ALPHA FOR THEORETICAL DIMENSIONSFactors Pattern For QUAL Items: 4
-
Factor 15
-
Factor 2 6-
Factor 3 7-
Factor 4 8-
Factor 59 - MEAN DIFFERENCE BETWEEN ITEMS AND "HR" QUESTION 10
-
SERVICE DIMENSIONS AFFECTING PERCEPTIONS OFSERVICE QUAUTY
1 1
-
SERVICE DIMENSIONS AFFECTING RECOMMENDATION DECISIONSGRAPHICS INDEX
1 - RELATIVE IMPORTANCE OF THE SERVQUAL DIMENSIONS
Page
2 5
4 4
ACKNOWLEDGMENTS
The author of this investigation would like to acknowledge some of the people who contributed to this work's completion. His thanks to Dra. Carla Chousal, Professor Carlos Barral, Professor Duane Davis, Professor Jose Miguez, Professor Jose Valente, Professor Rui Guimaraes, Professor Sarsfield Cabral, Eng. Jorge Pow, Antonieta, Isabel, Candido, and ~ l v a r o Resende.
Service firm managers face significantly different challenges than do those of their manufacturing counterparts. For example, with the US in the midst of a new service economy, most American business executives see service quality as a greater concern than product quality. Langevin (1988) finds that about 30% of service companies are exploring quality-control opportunities and an additional 40% say they have problems in place.
"Service companies are beginning to understand what their manufacturing counterparts learned in the 1980s: that quality does not improve unless you measure it (Reichheld, and Sasser, 1990
-
p. 105)".As client sensitivity increases, competition expands and intensifies, the issue of evaluating how consumers perceived the quality of services, and how those perceptions affect consumer's behavior and purchase decisions, have become critically important, and are likely to be a strategic issue through the 1990s.
Quality is defined by the customer. A technically perfect service that does not meet customers' expectations will fail. When a service provider knows how consumers evaluate the quality of its service, it will be more able to influence these evaluations in a desired direction and to relate a service idea to customer benefits.
Nowadays, the marketing key is customer service, and the main competitive advantage is quality.
The challenge is to determine what customers want and whether they are satisfied with the company and its service. 'That is, it is critical that the firm know what are the components of good service and what are the indicators of a poor service before they set up any program. Knowing quality determinants could mean the difference between retaining or losing customers.
friends. This is particularly important in services where referrals are a relevant source of new customers.
The role of service quality is now widely acknowledged as an indicator of customer satisfaction and organizational performance. Many suggested definitions of service quality focus on meeting customer needs and requirements.
In response to a growing interest in service quality the Marketing Science Institute sponsored a research program, much of which was undertaken by Parasuraman, Zeithaml, and Berry (1 985,1986,1988).
The present research was undertaken to strengthen understanding of the service quality construct and start Portuguese service quality investigation through the application of a specific instrument, SERVQUAL (Parasuraman, Zeithaml, and Berry 1985, 1986, 1988, 1990), to a selected service.
SERVQUAL is a multiple-item scale designed to measure customers' service quality expectations and perceptions. The SERVQUAL instrument has received considerable recognition in the general service marketing literature as a result of the pioneering work of its authors.
Information gained through this approach can be used to better understand service expectations and consumer perceptions, and to look at trends over time or compare branches or outlets within an organization. A firm's customers can be categorized into several perceived-quality segments by their individual SERVQUAL scores. It can also be used in designing the service product, designing the service delivery system, as input into quality monitoring programs, and for developing employee training.
This model of service quality is derived from the magnitude and direction of five gaps, which include consumer expectations-experiences discrepancies and differences in management, service design, delivery, and communications. From this model, an extended service quality model was developed that included gap 6-Service Delivery- Perceived Service Gap.
Quality in the transportation industry is the focus of the following discussion and experiment. This industry has been paid almost no attention in the marketing literature, specifically in Portugal, and it is of particular importance for many Portuguese companies and citizens.
Service quality is the present investigation's main goal; second, the intention is to analyze SERVQUAL; and, finally, to quantify customers' expectations and perceptions, and to determine the service quality dimensions existing in the bus transportation industry. The transportation service analyzed will be inter-city bus travel, an increasingly competitive industry because some public bus companies have been recently privatized. The focus company will be one of the biggest Portuguese bus companies: Resende, supplying regular and charter services, nationwide.
The focus of this examination will be to answer the following questions: What is service quality? What do customers really want? Are all preferences equally expected? and,
How is Resende service evaluated?
The first part of this paper reviews the nature of service quality. It reviews the theory underlying service quality conceptualization, Parasuraman, Zeithaml, and Berry's investigation of the subject and their model, and developes an extended service quality model. Finally, it describes the SERVQUAL instrument, and some criticisms of it.
go
NATURE
Off
SERVICE
QWALOTV
This chapter presents a review of the existing literature about service quality. It begins by examining the unique characteristics of services, because these must be acknowledged to develop a full understanding of service quality. Second, the chapter presents several conceptualizations about service quality. It describes Parasuraman, Zeithaml, and Berry's investigation of service quality perceptions, the conceptual service quality model developed, and the determinants of service quality. Fourth, SERVQUAL, a multi- item scale for measuring perceptions of service quality, is described. Finally, the chapter presents some criticisms of SERVQUAL, and the conclusion of the preceding review.
2.1. SERVICE'S UNIQUE CHARACTERISTICS
Service's characteristics are different from goods' characteristics. This chapter explains service's properties, and distinguishing services characteristics of intangibility, heterogeneity, and inseparability. Finally, it describes an expanded marketing mix for services.
a) Classification of Properties between Goods and Services
A framework for isolating differences in consumer evaluation processes between goods and services is based on the classification of properties distinguished among three categories (Parasuraman, Zeithaml, and Berry 1985; Zeithaml 1981, p.186):
Search ropert ties
-
attributes that a consumer can determine before buying a service (as price, and physical facilities). erlence properties-
Credence prop-
-
attributes that can only be discerned after purchase or during use (as courtesy of employees).
medical properly performand). Credence properties dominate in many services, especially those provided by professionals and specialists (e.g., auto repair). In general, offerings high in search properties are easiest to evaluate even before purchase. Offerings high in experience properties are more difficult to evaluate because they must be bought and consumed before assessment is possible. Offerings high in credence properties are hardest to evaluate because the consumer may be unaware of or may lack sufficient knowledge to appraise whether the offerings satisfy given wants or needs even after consumption (example: possess medical, mechanical or law skills sufficient to evaluate whether these services are necessary or are performed properly).
b) Services' Characteristics
Distinguishing services' characteristics of intangibility, heterogeneity, and inseparability make them more difficult to evaluate than goods.
First, most services are intangible. 'They cannot be seen, felt, tasted, or touched in the same manner in which goods can be sensed. They cannot be counted, measured, inventoried, tested, and verified before sale to assure quality. Services cannot be displayed, physically demonstrated or illustrated; therefore they possess few search properties and many experience properties. Because of intangibility, it is difficult to understand how consumers perceive services and evaluate service quality (Bitner 1990; Cowell 1989; Lovelock 1984; Parasuraman, Zeithaml, and Berry 1985; Zeithaml 1981).
process in operation. Due to this inseparability, the buyer usually participates in producing the service, thereby affecting the performance and quality of the service. The service firm may have less managerial control over quality in labor intensive services, and services where consumer participation is intense (Bitner 1990; Cowell 1989; Lovelock 1984; Parasuraman, Zeithaml, and Berry 1985; Zeithaml 1981).
In sum, the intangibility, heterogeneity, and inseparability of services lead them to possess few search qualities and many experience qualities. Additionally, service marketers most often have limited influence over the delivery of the service and therefore have limited control over service quality. The situation is sirr~ilar to a good's marketer trying to promote, position, or define an always changing product that the customer has not yet seen.
c) Expanded Marketing-Mix for Services
From this service's unique characteristics, Booms and Bitner (1981) proposed and expanded the marketing mix for services consisting of the four traditional elements (product, price, place, promotion) and three new ones (Cowell 1989):
All human actors who play a part in service delivery and thus influence the buyer's perceptions: namely, the firm's personnel and other customers in the service environment.
-
Physical Evidence: The environment in which the service is assembled and where the firm and the customer interact, as well as, any tangible commodities that facilitate performance or communication of the service.-
P r o c e s s : Service assembly actual procedures, mechanisms, and flow of activities by which the service is delivered. Bitner's (1990) study supported the idea that "elements of the expanded marketing mix should be included in strategies for improving service encounter satisfaction (p.79)".2.2. CONCEPTUALIZATION OF SERVICE QUALITY
Quality is a topic that can be viewed from different angles, and researchers distinguish between several constructs about service quality. This chapter reviews existing literature about the relevant perspectives of service quality conceptualization.
2.2.1. THE DIFFERENT MEANINGS OF " Q U A L I T Y " IN THE EVERYDAY LANGUAGE
Quality in everyday language often tends to express general approval.
However, Klaus (1985) distinguished different meanings for clients, employees and managers of service organizations, and for the general public when they refer to quality in everyday language.
"Quality in service clients' minds is some aggregated net value of benefits perceived in the service encounter over what had been expected (Klaus, 1985). From the client's perspective, a service can be divided into two elements: the actual functional service, and the manner in which the service is performed or delivered. Service quality is a term that encompasses both elements, although it is most frequently used to refer to the actual functional service where the service performance and outputs are most easily measured. From the client's viewpoint, satisfaction with a service is a function of both the functional and performance-delivery elements" (Czepiel, 1986).
Public life views quality as the quality of work life, and the quality and effectiveness of essential health, educational, social and other public service. These conceptions include producer, client, and public interests.
In sum, quality has many meanings and the uses and interpretations of service quality in everyday life are quite diverse and vaguely defined.
2.2.2. PRODUCT-ATTRIBUTE APPROACH TO SERVICE QUALITY
The product model of service is used as the basis for a product-attribute approach to service quality (Klaus, 1985). The quality of an item is the sum of its physical and technological attributes. Good quality, then, is taken to be compliance with standards. This conception provides measurability and controllability to management and quality appears to be relatively easy to define and manage. But, this is not so simple in face-to- face service encounters where there is an interpersonal process.
Maynes (1985) defined how quality should be conceptualized and measured in a consumer economist's view. In this normative idea, quality is a weighted average of characteristics, given by the following formula.
where:
G (ij,k) = the quality of the k th variety of the j t h product class as assigned by the i th individual.
W (ij,m) = the weights assigned to the m th characteristic in the j t h product class by the i th individual.
Ch (ij,km) = the characteristic score assigned to the m th characteristic of the k th variety in the j th product class by the i th individual.
2.2.3. CONSUMER-SATISFACTION APPROACH TO SERVICE QUALITY
At Florida Power & Light, the definition of quality is "simple but powerful: Quality means customer satisfaction" (Evelyn 1992, p.9).
Analyzing the service as a dynamic process
-
that is an interaction between the service organization and the client-
is the basis for an understanding of quality that focuses on the subjective perceptions of consumers of the service. Consumers' decisions are enactment of subjective perceptions, which are difficult to grasp. They depend on the personality of the consumer and they have a situation and a time component (Klaus, 1985)."Satisfaction is the consumer's subjective evaluation of a consumption experience, based on some relationship between the consumer's perceptions and objective attributes of the product" (Klaus, 1985, p.22).
Czepiel (1986) suggested that satisfaction, the result of some comparison process in which expectations are compared with that which is received, can differ from the actual evaluations or the perceptions of service quality.
To understand quality requires the understanding of the concept of physical attributes of a service, as well as, consumer's psychology and culture.
2.2.4. "QUALITY EPIPHENOMENON"
Klaus (1985) argued that service quality is a phenomenon experienced by individuals and is manifested in individual behavior. It is also a dynamic, complex configuration of physical, situation, and behavioral variables. Klaus (1985, p. 24) defined quality as
2.2.5. TECHNICAL QUAI-ITY, FUNCTIONAL QUALITY AND CORPORATE QUALITY
The results of quality imply the mastering of the process of service delivery as well as the outcome. Two types of service quality exist (Gronroos 1982):
Technical quality
-
involves what the customer is receiving from the service. Often it can be measured by the consumer in a rather objective manner. Because the service isproduced in interaction with the consumer, he will also be influenced by the way in which the technical quality is transferred to him.
Functional quality
-
involves the manner in which the service is delivered. Figure 1 illustrates these quality dimensions.TECHNICAL QUAUTY AND FUNCTIONAL QUAUTY
PERCEIVED SERVICE
<y>
Technical Functional
Quality
What ? How ?
FIGURE 1 (adapted from Gronroos 1982)
Another approach is that taken by Lehtinen and Lehtinen's (1991). It was their basic premise that service quality derives from the interaction between a customer and elements in the service organization. In their research they use two different approaches to service quality; a three-dimensional and a two-dimensional analysis.
In the 3-dimensional approach, the dimensions of quality are related to the elements of the service production process. The dimensions are:
1. Physical quality, which includes the physical aspects of the service;
2 . Interactive quality, which derives from the interaction between contact personnel and customer as well as between some customers and other customers; and
3. Corporate quality, which involves the company's image or profile. Gronroos (1982, p.26) defines corporate image as "the result of how the consumers perceived the firm". The service is the most important part of a company, which its customers see and perceive. Therefore, the corporate image can be expected to be built up mainly by the technical quality and the functional quality of its services. On the other hand, consumers' views of the company, i.e., its corporate image, will influence their expectations of the service (see figure 2 on page 30). It should be noted that the quality dimensions are interrelated. Acceptable technical quality can be thought of as a prerequisite for successful functional quality. On the other hand, according to Gronroos (1982), it seems that consumers can excuse temporary problems with the technical quality if the functional quality is good enough.
The 2-dimensional analytic approach takes time into account. The dimensions used are process quality and output quality. Lehtinen and Lehtinen's (1991) analysis tends to confirm that different criteria and different valuations of these criteria were used by different customer groups.
2.2.6. PERCEIVED QUALITY VERSUS OBJEC'I'IVE QUAI-ITY
superiority". It differs from objective quality,"it is a form of attitude, it is related but not equivalent to satisfaction, and it results from a comparison of expectations with perceptions of 'performance (p. 3)".
2.2.7. QUALITY AS ATTI'TUDE
Quality can also be viewed as an attitude held by customers. Customer attitude corresponds to a global evaluation of a service offer, more than to an evaluation of a
specific transaction. Bolton (1991) developed a model of customer's attitude toward a
service. It is expressed algebraically as:
ATTITUDE t = h (DISCONFIRM 1, PERFORM t, EXPECTED t-1, ATTITUDE t-1)
The above equation means that:
a customer's attitude about a service offer at time t (ATTITUDE 1) depends on his or her prior attitude (ATTITUDE 1-1) modified by his or her perceptions of current performance (PERFORM t), prior expectations about performance (EXPECTED t-1), and the discrepancy between expectations and subsequent perceptions (DISCONFIRM 1).
PZB (1986) supported the notion that service quality is an overall evaluation and it is similar to attitude. Quality acts as a relatively global value judgment. Increasing the proportion of search attributes relative to experience attributes (a condition found in durable and industrial goods), is more likely to result as quality being a cognitive judgment. Conversely, as the proportion of experience attributes increases (as is true in services and packaged goods), quality is more likely to be an effective judgment.
2.2.8. QUALITY VERSUS SATISFACTION
Berry (1983) argued that there is no better measure than satisfaction to express the ultimate in expectations, delivered benefits, and value received by customers. He distinguished among four elements that characterize customer satisfaction:
Intensity of Satisfaction : a measure of the value of a product attribute or service activity to a customer;
Congruence of Satisfaction: a measure of the difference actual and expected levels of satisfaction.
Ambiguity of Satisfaction: a measure of how clearly the customer can relate satisfaction to a service.
Periodicity of Satisfaction: a measure of the frequency that a customer experiences satisfaction or dissatisfaction.
Berry believes that satisfaction results from alteration of motives as customers enjoy the benefits of service purchase and consumption. Even if satisfaction is related to the customer's general attitude toward the service, it is not the same. The main difference between satisfaction and attitude is that satisfaction assessments relate to a customer's evaluation of a specific transaction whereas attitudes are more general. Consequently, satisfaction eventually becomes an input to a less dynamic attitude (Bitner, 1990; Bolton, 1991).
Satisfaction is a customer's post purchase evaluation of a service offering. On the basis of disconfirmation arising from discrepancies between prior expectations and actual performance, Bolton (1991) developed a simple model of the antecedents of customer satisfaction with a service offering, that can be expressed algebraically as:
CSfD t = f (DISCONFIRM t, PERFORM t, EXPECTED t-1)
In other words, a customer's satisfaction or dissatisfaction with a service at time t (CSfD t) depends on hisfher current perceptions of performance (PERFORM t), prior expectations about performance (EXPECTED t-1), and perceptions of the discrepancy between these two constructs (DISCONFIRM t).
Bitner's (1990) model of service encounter evaluation implies a very close relationship between service encounter satisfaction and perceived service quality. The attitudes and behaviors of service personnel influence perceived service performance. Such behaviors usually are associated with what is called process or functional quality (the how the service delivery) as opposed to the outcome or technical quality (the what
of service delivery). Though this relationship is likely to be accepted, many additional factors influence perceived service quality, such as service encounter satisfaction with competing services, perceptions of industry quality standards, word-of-mouth communication, and advertising.
2.2.9. QUALITY AND VALUE IN THE CONSUMPTION EXPERIENCE
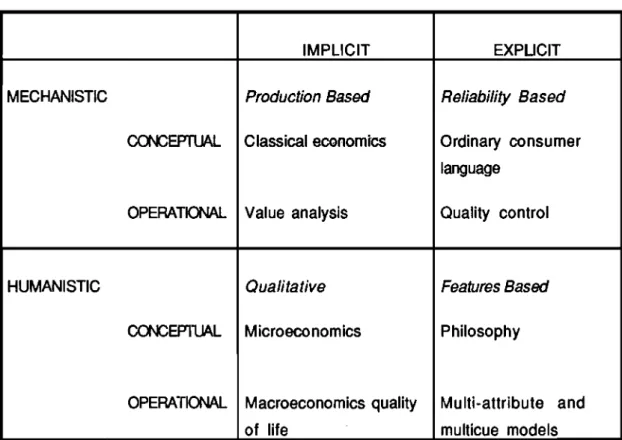
Holbrook and Corfman (1985) examined a broad range of quality in various disciplines, and developed a classification of them based on three dimensions. The first dimension contrasts definitions that regard quality as something present implicitly in an object as opposed to some explicit aspect or function thereof. The second dimension distinguishes between mechanistic definitions with those mainly humanistic in nature. A third dimension distinguishes conceptual definitions from those more operational in nature. Combining all three dimensions generates the classification of quality definitions found in the following matrix:
QUAIJTY CIASSIFICAl-ION BASED ON THREE DIMENSIONS
TABLE 1 (source: adapted from Holbrook and Corfman 1985) MECHANISTIC
CONCEFTUAL
OPERATIONAL
HUMANISTIC
CONCEPlUAL
0PERA'TK)NAL
Holbrook and Corfman, based on the typology of value in the consumption experience, define quality as extrinsic self-oriented passive value and distinguish it from other closely related kinds of value as beauty, convenience, and fun. The result of Holbrook and Corfman's experimental study indicated that quality was treated by subjects as lying
IMPLICIT
Production Based
Classical economics
Value analysis
Qualitative
Microeconomics
Macroeconomics quality of life
EXPLICIT
Reliability Based
Ordinary consumer language
Quality control
Features Based
Philosophy
somewhere between a specific and a global idea of value, i.e., perceived quality acts as a relatively global value judgment that mediates the effects of perceived beauty, convenience, and fun on overall preference.
2.2.10. EXPECTATIONS COMPARED TO PERCEP'I'IONS
Satisfaction and dissatisfaction often are viewed as opposite ends of a continuum, with disposition being determined as a result of a comparison between expectations and outcome. Satisfaction occurs when outcome meets or exceeds client's expectations. An alternative perspective on satisfaction and dissatisfaction suggests that experienced- based norms are more appropriate than expectations to serve as a benchmark against which product experiences can be compared with. Applying a disconfirmation paradigm to the evaluation of a service encounter suggests that the individual will compare his or her experience with some set of expectations. These expectations may be based, in part or in total, on past relevant experiences, including those gathered indirectly (Brown, and Swartz, 1989).
Perceived quality of a given service will be the outcome of an evaluation process where consumers compare their expectations with the service they perceive they have gotten, i.e., they put the perceived service against the expected service, as indicated in Figure 2
PERCEIVED SERVICE QUALITY
Quality
Technical Expected PERCEIVED SERVICE
Service QUALITY
What ? How ?
Perceived Service
FIGURE 2 (adapted from Gronroos 1982)
Gronroos (1982) drew three conclusions based on consulted studies: 1) the higher the degree of consumer's personal involvement in the consumption process, the more important service performance or outcome will be to perceived service quality; 2) consumer's experience of a service can be expected to be an important influence on his or her post-consumption evaluation of the service; 3) industrial service firms that successfully have rendered or currently render a service often are the only ones solicited when a repeat purchase is to be made.
Service quality perceptions result from the comparison of consumer perceptions of actual service performance with consumer expectations. Delivering quality service means conforming to customer expectations on a consistent basis. Satisfaction with services is related to confirmation or disconfirmation of expectations (Bitner 1990; PZB, 1985).
difficulties in the service encounter and found out those customer expectations and requests that exceed the firm's ability to perform account for 74 percent of the reported service encounter communication difficulties. This implies that, even if the service delivery system is working at designed levels of service performance with no technical problems, employees can still expect to face a large number of communications difficulties in dealing with customers. Seventy-four percent of all reported difficulties can be attributed to a source other than a poorly performing service delivery system. The gap between the customers' expectations and the firm's performance "is perhaps the major source of customer dissatisfaction (Schmalensee 1985, p.16)". If the expectations and experience do not match, then one or the other must be changed.
2.2.1 1. CONCLUSIONS OF SERVICE QUALITY CONCEPTUALIZATION
There are almost as many definitions of service quality as writers on the subject, which suggests a prevailing confusion about the concept of service quality. However, there are not many field investigations compared to the importance of the subject and the frequent use of the term quality in everyday language.
Depending on the author, the service quality definition is more quantitative or more qualitative, is more technical or more functional, is more product or more customer oriented, is more global or more specific, and some other contrasting views. All of these several constructs about service quality, and the service's unique characteristics, lend us to conclude that service quality is a complex problem.
To analyze service quality one concept needs to be chosen as the study base. The present investigation is going to use PZB (1985) conceptualization of service quality for several reasons. Their perspective appears to represent the dominant paradigm in service quality research, was investigated by other researchers, and the present study author agrees with that concept. Therefore, quality in the present study is related to a global attitude, whereas satisfaction is related to a specific transaction.
2.3. INVESTIGATION OF SERVICE QUALITY PERCEPTIONS
PZB (1985) conducted an extensive exploratory investigation of service quality perceptions in four service businesses. Specifically, in-depth interviews of executives and 12 focus group interviews with consumers were conducted to develop a conceptual model of service quality. A nationally recognized U.S. company from each of the four service businesses
-
of retail banking, credit card, securities brokerage, and product repair and maintenance-
participated in the study. The executives were selected from the several functional areas that could have an impact on quality in service firms. 'The focus-group interviews of respondents, three for each industry, who were current or recent users of the service being investigated, discussed issues such as the meaning of quality in the context of the service in question, the characteristics the service and its provider should possess to project a high-quality image, and the criteria's customers use in evaluating service quality.Remarkably consistent patterns emerged from the four sets of executive interviews and from the responses of focus group participants. Although, some perceptions about service quality were specific to the industries selected, commonalties among industries prevailed, which suggest that a general model of service quality could be developed.
2.3.1. INSIGHTS OBTAINED FROM EXPLORATORY INVESTIGATION AND A SERVICE QUALITY MODEL
The most important conclusion from executives' responses was:
"A set of key discrepancies or gaps exist regarding executive perceptions of service quality and the tasks associated with service delivery to customers. These gaps can be a major hurdle in attempting to deliver a service which consumers could perceive as being high quality (PZB 1985, p.44)."
This chapter describes the four gaps on the organization side of the model, gap 5 on the customer's side, and develops an extended service quality model that includes gap 6.
81) The four Gaps on the oraanlzation side of the model
Gap 1 refers to the Consumer Expectation-Management Gap, the discrepancy between what customers expect and what management perceived that they expected. This suggests that service firm executives may not always understand: (1) What features individuals perceive as high quality in advance, (2) What features are necessary to meet individual needs, and (3) What levels of performance are necessary to deliver high quality services. This gap will have an impact on the consumer's evaluation of service quality. PZB (1990) find that three factors contribute to Gap 1 (as illustrated in figure 4 ) :
1. Lack of marketing research orientation, particularly insufficient marketing research, inadequate use of marketing research findings, and lack of interaction between management and customers,
SERVICE QUAI-ITY MODEL
CONSUMER SlDE
Word of Mouth
Communications Personal Needs Past Experience
I
-.
..,..,... >( , Expected Service 4
:@...* s<>?*&*>>s"=*A'.* $ 3 3
.
g
gPerceived Service 4
A
- - - . - - -
MARKETERSlDE
Service Delivery GAP4 External
(including pre-and
.
.~.+xYssw=x+$$% Communications topost-contacts) Consumers
A
A
Translation of Perceptions into
2%
Sevioe Qua lit,, SpecsI
Management Perceptions of consumer Expectations
GAPS MODEL OF SERVICE QUALITY CUSTCIMER
EXPECTATIONS
I
PERCEPTIONS
EXTERNAL COMMUNICATIONS TOCUSTOMERS
KEY CONTRIBUTING FACTORS TO GAP1 :
I
1. Marketing Research Orientation 2. lnadequate Upward Communication
3. Too many levels of Management
KEY CONTRIBUTING FACTORS TO GAP 4 1. lnadequate Horizontal
Communications
2. Propensy to Overpromise
SERVICE DEUVERY
Y
KEY CONTRIBUTING FACTORS TO GAP3:
1. Role ambiguity 2. Role Conflict
3. Poor EmployeeJob Fit
4. Poor TechnologyJob Fit
5. Inappropriate Supervesionary Control Systems
6. Lack of Perceived Control 7. Lack of Teamwork
SERVICE QUALITY SPECIFICATIONS
w
KEY CONTRIBUTING FACTORS TO GAP 2:
1. lnadequate Management Commitment to service Quality 2. Perception of Infeasibility
3. lnadequate Task Standardization
4. Absence of Goal Setting
FIGURE 4
b
MANAGEMENT PERCEPTIONS OFCUSTOMER
Gap 2 refers to the Management Perception-Service Quallty Specification Gap, i.e., the difference between manager's perceptions of customers' expectations and the actual standards they set for service delivery. Respondents from all four firms admitted difficulty in attempts to meet or exceed consumer expectations. A variety of factors, such as resource constraints, market constraints, and/or management indifference, prevent delivering what the customer expects. This discrepancy is predicted to affect quality perceptions of consumers. PZB (1990) find that four factors contribute to Gap 2 (as illustrated in figure 4):
1. lnadequate commitment to service quality, 2. Lack of perception of feasibility,
3. lnadequate task standardization, and 4. Absence of goal setting.
Gap 3 refers to the Service Quality Specificatlons-Service Dellvery Gap, the difference between service specifications and the actual service delivery: when employees are unable and/or unwilling to perform the service at the desired level. Executives from all four service firms mentioned the existence of similar difficulties in adhering to formal standards of service quality due to variability in' employee performances. Contact personal play a pivotal role on the service quality perceived by consumers. PZB (1990) found that seven factors contribute to Gap 3 (as illustrated in figure 4):
1. Role ambiguity, 2. Role conflict,
3. Poor employee-job fit,
4. Poor technology-job fit,
5. Inappropriate supervisionary control systems leading to an inappropriate evaluation/reward system,
6. Lack of perceived control on the part of employees, and 7. Lack of team work.
will raise initial expectations but will lower perceptions of quality when promises are not fulfilled. Another way in which external communications could influence service quality perceptions by consumers occurs when companies inform consumers of special efforts to assure quality that is not visible to consumers. So, external communications can affect consumer expectations about a service, as well as, consumer perceptions of the delivered service. PZB (1990) found that two factors contribute to Gap 4 (as illustrated in figure 4):
1. Inadequate horizontal communication, as evidenced by inadequate communication between advertising and operations, between sales people and operations, and between human resources, marketing, and operations, as well as differences in policies and procedures across branches or departments, and
2. Propensity to over promise in communications.
These first four gaps are the service provider's side that is likely to affect service quality as perceived by consumers.
b) The G ~ D on the customers side of the model
GAP 5 AND GAP 6
I
GAP 51
-
EXF'ECTED SERVlCE
7
Perceived
\
PERCEIVED4 Service Quality
SERVKiE Dimensions
E W e d
4 Service Quality Dimensions
GAP 6
I
I
FIGURE 5 RECEIVED OR
DEUVERED SERVICE
2.3.2. EXTENDED SERVICE QUALITY MODEL Received Service Quality
Dimensions
1
Mainly Psychological (about the customer)
Mainly Real (about the firm)
It is important to know what customers perceive from a service. Once a firm has satisfied this critical step, it is essential to analyze the real service delivery. This is developed on the extended service quality model that includes gap 6 (see figure 6), based on PZB service quality model.
The Gap Between Customers and the Oraanization
perceived by the customer. If a service has many positive features and those are not perceived by the customer, the service delivery quality is too high compared to the perceptions, which means that the firm is losing efficiency. This is true with services, as well as with products.
If expectations are greater than performance, for example in an expensive restaurant, then although perceived quality may be low, the actual standard of service, in absolute terms will still be higher than in a cheap restaurant. This tautology can add confusion to any discussion of good or bad service quality using an expectation versus performance model.
Service delivery features must be measured on each and all the service quality dimensions. As shown in figure 5, these dimensions are related to the service received, perceived and expected by the customer.
If all the other five gaps are closed, then gap 6 is also closed, that is, gap 6 is like a closing loop of the model and can be used as a confirmation measure. Since it is diffiqult to accurately measure all the first four gaps, the measurement of gap 6 can be used as g
substitute measure, that is, the firm can measure only gap 5 and gap 6. If these two gaps are closed, then customers' expectations are the same as perceptions, and the same as service delivery. In this situation the firm does not need to measure all the other four gaps. When there is a discrepancy in one of gaps 5 or 6 then there is not enough service quality or there is a loss of efficiency. In this situation, something is not well and the firm needs to measure all the four gaps on the organization side of the model to analyze which is the reason for ,the discrepancy.
EXTENDED CONCEPTUAL SERVICE QUALITY MODEL
COSTUMER SIDE
Communications
This research found that the managers often can not describe exactly what quality of the service delivery is. Its quantification as a gap or as an absolute value is also difficult. A variety of factors may contribute to Gap 6, including the factors that contribute to the other gaps. Research has to be carried out in this Gap 6 field. The reason for Gap 6 can be due to an inconsistency between search, experience, and credence properties of the delivered service. Organizations offering services that are highly interactive increase the likelihood of misunderstandings between service providers and customers. The customers and the providers have mutual experience and respond to each other's attitudes, moods, mannerisms, and language. For instance, an employee giving 100 percent effort may be understood by the customer to only give a 50 percent effort, as well as the contrary.
To quantify gap 5 and 6 there are three customer analysis levels: real service received by the customer, customer perceived service, and customer expected service. The first level, service delivered by the firm and received by the customer, is mainly real, as illustrated in figure 5. The second level, perceived service, is due to a mixture between the real service received and the customer psychological attitude. The third level, expected service, is mainly psychological. The analyze of each level is difficult to quantify when it is near the psychological side.
Verification and extension of the hypothesis about Gap 6, require more detailed research.
Brown's (1989) investigation of gap analysis of professional service quality concluded that "gap analysis is a straightforward and appropriate way to identify inconsistencies between provider and client perceptions of service performance. Addressing these gaps seems to be a logical basis for formulating strategies and tactics to ensure consistent expectations and experiences, thus increasing the likelihood of satisfaction and positive quality evaluation
".
2.3.3. DETERMINANTS OF PERCEIVED SERVICE QUALITY
PZB (1985) conducted focus groups with consumers that revealed 10 key categories in evaluating service quality. These were labeled service quality determinants and are described as:
-RELIABILITY is defined as the consistency of performance and dependability. It means that the firm performs the service right the first time and that it honors its promises.
-RESPONSIVENESS concerns the willingness or readiness of employees to provide service, and the timeliness of service.
-COMPETENCE means possession of the required skills and knowledge to perform the service.
-ACCESS involves approachability and ease of contact.
-COLIRTESY involves politeness, respect, consideration, and friendliness of contact personnel.
-COMMUNICATION means keeping customers informed in language they can understand and listening to them. It may mean that the company has to adjust its language for different customers.
-CREDIBILITY involves truthfulness, believability, honesty, and generally having the customers best interest at heart.
-SECURITY is the freedom from danger, risk, or doubt.
-UNDERSTANDING/KNOWING THE CUSTOMER involves making the effort to understand the customer's needs.
-TANGIBLES include the physical evidence of the service.
DETERMINANTS OF PERCEIVED SERVICE QUALITY
FIGURE 7 (adapted from PZB 1985) Determinants of
Service Quality
1. Access
2. Communication 3. Competence 4. Courtesy 5. Credibility 6. Reliability 7. Responsiveness 8. Security
9. Tangibles 10. Understanding/ Knowing the Customer
Perceived service quality is the difference (or gap) between consumer expectations and perceptions. Potential overlapping across the 10 criteria and the relative importance of the 10 determinants in molding consumer expectations (which may differ from their relative importance to customers), was studied later on by PZB.
Some authors proposed other service quality dimensions. For instance, Kennedy and Young (1989) argued that quality can be described with several sub categories, each of which can be evaluated by the customer: availability, responsiveness, convenience, timeliness, completeness, and pleasantness.
I
Past Experience and Communications Word of Mouth
I
EXPECTED SERVICE
PERCEIVED SERVICE
QWALITY
2.3.4. PROPERTIES IN EVALUATING QUALITY: SEARCH, EXPERIENCE, AND CREDENCE PROPERTIES
In the aforementioned focus groups' consumers use search, experience, and credence properties to describe and define service quality. These three aspects of service quality can be categorized into the 10 service quality determinants and can be arrayed along a continuum ranging from easy to evaluate until difficult to evaluate. Only two determinants
-
tangibility and credibility-
are search properties. Most of the dimensions are experience properties: access, courtesy, reliability, responsiveness, understandinglknowing the customer, and communication. Competence and security determinants fall into the category of credence properties.From their study, PZB argued that:
-Consumers typically rely on experience properties when evaluating service quality, because few search properties exist with services and because credence properties are too difficult to evaluate.
-When expectations (E) exceed perceptions (P), perceived quality is less than satisfactory and will tend toward totally unacceptable quality, with increased discrepancy between E and P.
When E=P, perceived quality is satisfactory.
2.4. SERVQUAL : A MULTI-ITEM SCALE FOR MEASURING PERCEPTIONS OF SERVICE QUALITY
PZB (1986) developed a multiple-item scale to measure customer perceived quality of a service situation, called SERVQUAL, and discussed the scale's properties and potential applications. For assessing the quality of a firm's services the authors measured customers' perceptions of quality and the scale involves the notion of perceived quality. To operationalize the SERVQUAL measure, the authors used the disconfirmation of expectations' paradigm. The disconfirmation paradigm suggests that an individual's evaluation of the quality of a service is based on a comparison of that service's actual performance with an individual's prior expectations (how the service should perform). Specifically, the authors developed SERVQUAL as a multidimensional scale for operationalizing Gap 5 (Service Quality = Consumer Service Expectations
-
Consumer Service Perceptions).2.4.1. DlMENSiONS OF SERVICE QUALITY
Items for the SERVQUAL scale are derived from the ten dimensions described above and compose the basic structure of the service quality domain. To operationalize the proposed conceptualization of service quality, PZB developed a scale that measured expectations and perceptions separately, with 97 items, for each one, representing various facets of the service-quality dimensions (approximately 10 items per dimension) based on focus group interviews. Each item was recast into a pair of statements
-
one to measure expectations about firms in general within the service category being investigated and the other to measure perceptions about the particular firm whose service quality was being assessed.97 items to 34 items and the original ten dimensions to seven. The second stage evaluated the robustness of the 34-item scale by assessing its component reliability (i.e., alphas) and dimensionality when used to measure the quality of different service firms. Therefore the data from each of the four samples were analyzed separately. Principal axis factoring and oblique rotation reduced the items to 26 and the dimensions to five. These five dimensions included three original and two combined dimensions described
as:
-
Tangibles : Physical facilities, equipment, and appearance of personal.-
Reliability : Ability to perform the promised service dependably and accurately.-
Responsiveness : Willingness to help customers and provide prompt service.-
Assurance :-
Empathy :Knowledge and courtesy of employees and their ability to convey trust and confidence.
Caring, individualized attention the firm provides its customers.
PARASURAMAN, ZEITHAML, AND BERRY DIMENSIONS
Communication
Understanding the Customer
Table 2
Convergent validity was assessed by examining the association between SERVQUAL scores and responses to a question that asked customers overall quality by checking one of four categories
-
excellent, good, fair, poor. The correspondence between the over all quality ratings and the SERVQUAL scores was examined using one-way ANOVA. The strength and persistence of linkage between the over all categories and the SERVQUAL scores across four independent sarr~ples offered strong support for SERVQUAL's convergent validity. The authors assessed for nomological validity by examining whether the construct measured by it was empirically associated with measures of other conceptually related constructs. Respondents in each sample answered two general questions that provided measures of two variables which one could expect to be related conceptually to perceived service quality: (1) whether the respondents would recommend the service to a friend and (2) whether they had ever reported a problem with the services they received from the firm.critical dimension followed in order, for Bank and Credit Card firm's, by assurance, tangibles, responsiveness, and empathy.
The SERVQUAL scores suggest that even well known, and prestigious firms have room for improving service quality. While the SERVQUAL scores are uniformly negative, a majority of respondents rated the overall quality of the firms they were evaluating as "excellent" or "good". In other words, given the current state of quality in the services sector, even meeting customer expectations may be sufficient to project an excellent- quality image.
2.4.2. RELATIVE IMPORTANCE OF SERVQUAL DIMENSIONS
SERVQUAL treats all items in the scale as equally important. This assumption may not hold in every situation. For example, is the organization's up-to-date equipment as important as its being dependable? Whilst the bhould" question of expectation will provide an indication of the relative importance of the item to the individual, the gap measurement is no more or less heavily weighted as a result of that information. Therefore, a difference of one scale point on the statement concerning up-to-date equipment is treated exactly the same as a one point scale difference on the dependability statement.
RELATIVE IMPORTANCE OF THE SERVQUAL DIMENSIONS
Tangibles
GRAPHIC 1
One reason can be suggested for these results. Tangible features of the service are essentially constant over time and are mainly service search properties. Therefore, for a current customer, the tangible expected service from a firm is close to the tangible perceived service. On this situation the customer would know the quality ex-ante, would not have surprises and would not evaluate this dimension as very important.
This conclusion does not hold for potential customers when evaluating tangible service quality dimension, nor with current customers when evaluating dimensions that are mainly experience or credence properties of the service. On these situations the perceived service can be very different from the expected service, so the customer can become very disappointed. Consequently, he evaluates the quality dimension as very important.
This could lead to distorted results of the tangible dimension's importance when the respondents are current customers, which is the situation with SERVQUAL.
most negative SERVQUAL score. Generally, there is a negative correlation between the importance the customer attributes to a dimension and the SERVQUAL score. So, PZB concluded that "there is a mismatch between the priorities expressed by customers and the levels of quality delivered by the companies" (p.29), and "each company is performing most poorly on the facets that are most critical to customers" (p.30).
One criticism, based on logical thinking, can be pointed out. When a customer is asked to evaluate what is the quality dimension importance, he will, unwittingly, evaluate the difference between perceived minus expected service quality dimension, that is, the
most important dimension is the one that he feels less quality.
In summary, the customer can generally distort the service quality dimensions importance when asked directly to evaluate it. There is a tendency to give more importance to the quality dimensions when he usually feels more discrepancy between expectations and perceptions. Contrary, there is a tendency to give less importance to a quality dimension that is mainly a search property of the service, and when customer feels less discrepancy between expectations and perceptions. So, the importance would be very dependable of the actual service quality of a firm. That is, the customer, when asked directly, evaluates the relative importance and not the absolute importance.
2.4.3. APPLICATIONS OF SERVQUAL
SERVQUAL's use is limited to existing or past customers of a firm, because meaningful responses to the perception statements requires respondents to have some knowledge of or experience with the firm being researched. Within this constraint, a variety of potential applications are available. PZB (1988) describe several applications of SERVQUAL:
-
To assess a given firm's quality along each of the five service dimensions or to provide an overall measure of service quality;-
To determine the relative importance of the five dimensions in influencing customers overall quality perceptions;-
To segment a firm's customers into several perceived-quality groups;-
To assess a firm's service performance comparing it to its principal competitors.2.5. CRITICISMS OF THE SERVQUAL,
Researchers have investigated service quality in several industries that appear to be based largely on PZB's (1985, 1988) proposed dimensions of service quality. Amongst those: Bojanic, 1991; Bolton and Drew, 1991; Brown and Swartz, 1989; Carman, 1990; Cronin and Taylor, 1992; Davis and Paul, 1987; Fick and Ritchie, 1991 ; Kierl and Mitchell, 1990; Lewis, 1989; Lewis and Mitchell, 1990; Mangold and Babakus, 1991 ; Reidenbach and Sandifer-Smallwood, 1990; Saleh and Ryan, 1991 ; Wong and Perry, 1991.
However, a number of recent studies suggest that care must be taken in generalizing SERVQUAL. Before accepting SERVQUAL as a valid generic measure of perceived service quality that can be used in any service situation, more replication and testing are needed. This chapter will present criticisms about SERVQUAL, written by: Brown and Swartz (1989), Crompton and Mackay (1989) Lewis and Mitchell (1990), Carman (1990), and Bolton and Drew (1991).
Brown and Swartz (1989) explored the concept of service quality and its evaluation from both the provider and the client perspectives in the dyadic exchange. The typically high level of personal interactive nature of professional services and their often simultaneous production and consumption indicates that both parties are very important and must be considered. Brown and Swartz used gap analysis as an (appropriate) approach for examining the evaluation of a professional (medical care) service. They claim a simpler model of service quality for evaluating professional services than the one proposed by PZB (1985). Given the professional-client relationship and the unique characteristics of professionals, Brown and Swartz's findings suggest that only three gaps are relevant in the professional services research setting as opposed to the five gaps proposed by PZB (1985). These gaps include:
(1) an inter-client gap: Client Expectations versus Client Experiences; and two client-professional gaps:
(2) Client Expectations versus Professional Perceptions of Client Expectations; and
Brown and Swartz' results demonstrated that all three gap types influence the evaluation outcome, so there is a need to analyze deeper than the traditional satisfaction and dissatisfaction paradigm when assessing service offerings. Brown and Swartz's findings suggest that the entire service encounter is evaluated, i.e., the interaction with the professional service provider as well as staff interactions and other dimensions.
Crompton and Mackay (1989) investigated the relative importance of the 5 dimensions (proposed by PZB) as perceived by participants in four selected public recreation' programs. It was hypothesized that dimensions of service quality would not be of equal importance to participants in the selected recreation programs, and the hypothesis was supported. Reliability consistently emerged across programs as the most important dimension of service quality, and in three of the four programs empathy received the least support.
Lewis and Mitchell (1990) discussed several problems with SERVQUAL: (1) The treatment of all items in the scale as equally important, (2) Half of the statgment being negatively worded, (3) The restriction of consumers' responses to a 7-point scale, and (4) The adjectives used in SERVQUAL statements. From Lewis and Mitchell's perspective, researchers might consider the use of a bipolar semantic differential graphic scale to overcome the problems highlighted with the SERVQUAL measurement tool.
Carman (1990) performed a replication of the SERVQUAL scale with the purpose of testing the SERVQUAL battery and offered suggestions for its use. Carman's new approach investigated six questions related to the SERVQUAL scale:
(1) How many dimensions and how generic are they?
(2) How much can item wording be changed to fit a particular service situation? (3) What about service situations that include multiple service functions? How much does the quality of the product included in the retailer's service contribute to perceptions?
(4) How valid is it to analyze the difference between expectations and perceptions?