Visual Analytics and knowledge creation
from Big Data: A systematic review
Alessandro Vieira dos Reis1 Caio Gaiarsa Simões Lasagno2
ISSN: 2316-7963
Abstract
This paper is about Visual Analytics: the use of visual resources to interpret informa-tion and create knowledge in Big Data. To identify the best practices in the area a sys-tematic review of papers related to the topic was done. Some filters were used, such as: articles published at most 3 years ago, peer--reviewed, with title and abstract aligned with how to use Visual Analytics. As the main fin-dings of the review we have: a) the prevalen-ce of techniques using metaphors to monitor data through maps and dashboards; b) the need for specialists from different areas who can work with statistics applied to data inter-pretation. The paper finishes with suggestions of use of the findings and new research pro-posals concerning the creation of knowledge using Big Data.
Key-words: Big Data; Visual
Analyti-cs; Knowledge Creation.
1. Introduction
Big Data is getting more and more popular in organizations in different applica-tions since its origins, around 20 years ago (DIEBOLD, 2012). Roughly, it consists in the gather and statistical treatment of big volumes of online data, followed by the analysis of the subsequent information aiming to create knowledge in the desired area (CHEN; MAO; LIU, 2014)
In such context, different problems arise concerning how to interpret these Big Data information, having as a target to create reliable knowledge to support decision making. This paper’s main objective is to identify ways to do it through Visual Analyt-ics, word which designates analysis and interpretation of information in visual repre-sentations. It is thought that applying the best Visual Analytics practices, the Big Data researchers will create better knowledge.
To achieve this goal a systematic review from the literature was done, followed by the bibliometric analysis of the findings. Such procedures were selected because of the exploratory and quantitative character of it, which allows the creation of a picture of a specific knowledge area.
This article aims only to identify the main issues in the use of Visual Analytics. It is not part of it the creation of a complete methodology to create knowledge in Big Data researches.
2. Big data and visual analytics
This section presents the theoretical basis of the knowledge creation tools in Big Data context.
2.1 Big Data: History and Definition
There is no consensus about the creation of the term “Big Data”. However, one of the possible authors of the definition is the chief scientist John Mashey, from Sili-con Graphics, in 1998, in a presentation called “Big Data and the Next Wave of InfraS-tress” (DIEBOLD, 2012). Even so, for many years the term was of little relevance to the audience, or even people connected to that field of knowledge.
One of the turning points to increase funding in Big Data is related to the 9-11 attacks, when the U.S. government saw the need and possibility of using great vol-umes of data to identify suspicious and dangerous individuals (FRIEDMAN, 2012). However, a big change started in 2005 with the beginning of Web 2.0, and after, when Yahoo! turned Hadoop in an open source technology, in 2008 (TARIFA, 2014). Meanwhile, the fast spread of mobile devices contributed to the exponential growth of data, bringing new needs and possibilities in analytics. Recently, the internet of things (IoT), self-driving cars and other technologies are incrementing this tendency of data growth, storage and analysis of these information.
There are concurrent visions concerning the definition of Big Data. Anyway, a common explanation start from the number of “Vs” (letters V). The first of them was
defined by Doug Laney, in 2001, where he showed that Big Data does not rely only on volume but also variety and velocity in the usage of them (DIEBOLD, 2012). This definition lasted until 2011, when International Data Corporation came up with a new standard to define it, adding another V, this time standing for value, making it clear that the difference between Big Data and a “bunch of data” is in the creation of val-ue (CHEN; MAO; LIU, 2014). The last definition adds another V meaning veracity, by doing so, the discussion about quality and reliability of the data got more important. (BURBANK, 2017)
The process of Big Data involves gather and storage of big volumes of data, with big variety (structured, semi-structured and non-structured) and quick retrieval of it, making the usage of non relational databases mandatory. These data characteristics demand techniques that are able to interpret and give meaning to the information from the data. One way to do it is called Knowledge Discovery in Databases (KDD). According to Fayyad, Piatetsky-shapiro and Smyth (1996, p. 40): “Kdd is the non trivial process to identify valid, new and potentially useful and understandable patterns in data”. This way, the KDD process can be represented as picture 1 shows below:
Picture 1: From data to knowledge
Source: Fayyad, Piatetsky-shapiro e Smyth (1996, p. 41)
As shown in picture 1, the process can be defined in nine basic steps:
1. Developing a previous understanding of the data and identifying the objectives of the process from the client’s point of view;
2. Creating a database with relevant information where new things can be discovered; 3. Cleaning and pre-processing of data, including definitions as noise removal, treat-ment of missing values, etc;
4. Finding out methods to represent the data according to the objective, such as di-mensional reduction or data transformation;
5. Conciliating the objectives of the KDD process with a data mining method, such as regression, clusterization and others;
6. Exploratory analysis, modelling and hypothesis selection, where the algorithms and methods are chosen to find out patterns in data;
8. Interpreting the patterns, possibly returning to any of the previous steps;
9. Utilizing the knowledge generated, incorporate it to other systems, document it and presente it to the people involved. In short, give a destination to the knowledge. The multivariate character of Big Data is shown in people working with it. The area is made of different processes and analysis and because of that, professionals from diverse areas can be found working with it. Programmers, software architects, data-base administrators are common in data gathering and structuring of data. To analyze and present the data it is possible to find mathematicians, physicists, engineers and economists. In the last few years, a new profession was created to accomplish these diverse requisites called data scientist.
2.2 Big Data’s object of study
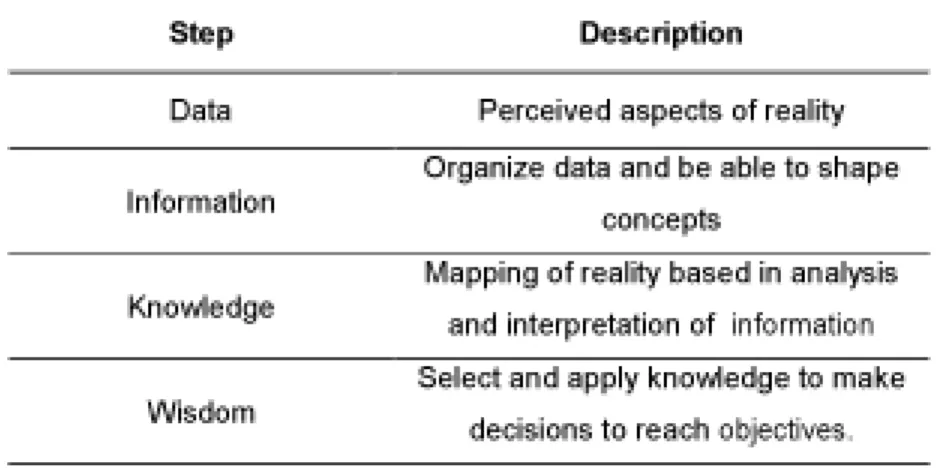
As it suggests, the fundamental object of Big Data is data. According to Semidão (2014), the definition of data involves “something known, made and done that became necessary… that makes itself present” (p. 70). Information can be defined as “giving me-aning to cognitive contents” (pag 77). The gather of information happens as the data are observed, evaluated and integrated, creating the central effect of information, the “reduction of uncertainty in the decision making process” (Porto e Magalhães, 2014, pag 86). It means, the comprehension of reality is based on the data gathered about it, treated to become something to help giving meaning to it.
After collecting the information, the creation of knowledg happens. Knowledge is a word of many meanings, but in this context we will use the definition of Semidão (2014) in which knowledge is the skill to identify and comprehend things and states. It means to be able to accurately describe a reality from the information available. Wis-dom is the name given by Semidao (2014) to knowledge applied for good decision making in the real world. Someone wise is able to act based on knowledge.
Table 1: Elements of Big Data
In chart 1, we can observe how this process adds more organization and gains importance in decision making as it evolves. Therefore, research in Big Data, captu-res the data to be used as raw material to generate information after they are treated.
These must be interpreted with tools, analytical models, to generate knowledge con-cerning the reality from which they were extracted to be used in decision making. At last, wisdom, must be understood as the capacity to integrate knowledge and insight as basis for decision making.
2.3 Methodological issues in Big Data
Big Data uses quantitative research procedures, because it works with measura-ble data and statistical treatment (DIEBOLD, 2012). The quantitative research “aims to quantify data and apply some sort of statistical analysis” (MALHOTRA, 2001, p. 155). More than that, quantitative research involves issues such as sample size for the re-search. It means this sort of research needs bigger samples to be to analysed when compared to qualitative research. Also, the numbers in quantitative research must be related to reality, to describe it and make it more familiar (GIL, 2002). Therefore, Big Data research are usually classified as quantitative and descriptive
An epistemological analysis of Big Data brings about issues related to the quality of the knowledge generated. Boyd and Crawford (2016) suggest the Big Data profes-sional to question: a) the reliability of the collected data; b) how to interpret data to obtain consistent information; c) how to evaluate how good the created knowledge is to describe the observed reality; d) if the knowledge obtained by Big Data makes the human intuition unnecessary to make decisions.
This paper underlines the epistemological question related to the interpretation of information from Big Data. Picture 2 explains the interpretation process:
Picture 2: Data, information and knowledge
Source: based on Semidão (2014).
Picture 2 shows how data, via statistical treatment, are organized to turn into information and, as such, being interpreted to generate knowledge. As an example of interpretation in Big Data, the use of the psychological analytical model OCEAN by Cambridge Analytica, also known as Big Five Personality Traits. This test was crea-ted and validacrea-ted before Big Data, but it was used as a tool to interpret the informa-tion gathered about people. According to the news magazine The Guardian (DAVIES, 2017), this test was used to create the psychographic and motivational profiles in the 2016 U.S. presidential election.
Picture 3 – The Big Five Model applied on Big Data
Picture 3 shows how an analytical model consists in a second level of treatment, dedicated to the information, not data. This level is not necessarily statistical, but in Cambridge Analytica’s case, they use a model from psychology as a tool to interpret information.
2.4 Visual Analytics
As stated by Zhang at al (2012) the term `Visual Analytics`, created in 2005, refers to a wide range of information interpretation techniques based on visual re-sources. In short, it is about generating graphics from data and interpreting them as a method to treat condensed information.
Every sort of graphical representation is called, in this case, of `visualization`. These can be numerical, nominal, geo-related or networks. There are great num-bers of Visual Analytics techniques, some commonly used are: bar graphs, histogram, scatter plots, treemaps and others. They can be static or dynamic. The dynamic ones use resources such as projections, zooming and dimensional reduction, and try to give more liberty and flexibility to users to explore the data and interpret these infor-mation.
Despite the short existence and the few systematization of the area, Visual Analy-tics presents itself as a key element to create knowledge in Big Data, once it makes it easier to comprehend the results and, because of that, facilitates decision making. Big Data teams usually have specialists in Visual Design helping in Visual Analytics, as well as professionals from different areas to interpret the visualizations.
3. Methodological Procedures
To achieve the research goals a systematic review of publications was done to identify enough material related to the paper`s objective.
3.1 Systematic Review and Bibliographical Research
There were two reasons why systematic review was used : 1) systematic reviews collect a wide range of publications under determined criteria; 2) the availability of online databases related to the topic at low cost.
The systematic review consists in a sort of bibliographical research. Gil (2002) states that the main advantage in bibliographical research is in the cover of a wide range of phenomena, wider than it could be done in other types of research. Accor-ding to Lakatos (1992, p.44) “the bibliographical research can be considered also as the first step of every scientifical research”.
Yet, the systematic review is a more judicious type of bibliographical resear-ch because it is not limited to known and prefered references by the researresear-cher. It promotes a wide research in a knowledge area. This kind of bibliographical research “makes a summary of evidences related available to a specific strategy of intervention by the application of explicit and systematized methods of search, critical apprecia-tion and summarizaapprecia-tion of the selected informaapprecia-tion” (MEDEIROS;VIEIRA;BRAVIANO, 2015, p.95)
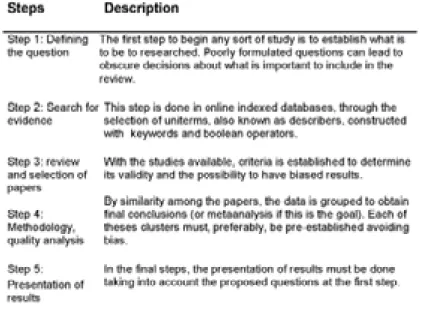
According to Sampaio and Mancini (2007), the process of systematic review can be summarized in 5 steps, shown in table 2:
Table 2 – Systemactic Review. Source: based on Sampaio e Mancini (2007)
The five described steps in Table 2, can not be interpreted as a linear process, because it allows to go back and forth in between the steps. For example, to analyze the methodological quality from the studies (step 4) the necessity of new reviews to be done in new databases is possible. (step 2).
3.2 Systematic Review in this paper
In this article, step 1 (question definition) was done between November 20, 2016 and March 22, 2017. The initial idea consisted in an analytical model research from Behavioral Economics in Big Data. This proved not to be viable, because of the lack of references found. The search terms in the four initial reviews were: 1) “Big Data” + “Consumer Behavior” + “model” + “consumer”; 2) “Big Data”,“Consumer behavior” + “predictive analysis”; 3) “Big Data” + “Analytic*” + “decision *”; 4) “Big Data” + “data analysis” + “data visualization” + “visual databases”.
During the first four reviews the search terms and the article objectives were changed. The tittle and abstracts’s reviews found in these four preliminary researches revealed another theme: Visual Analytics. This happened because this term appeared in many papers aligned to the main theme: the interpretation of information in Big
Data.
After deciding it, the fifth review was done with the terms: “Big Data, Data Visual*,
Data Analisys e Visual Analytics”. Big Data was selected to connect the research with
papers about Big Data, the paper’s initial focus. Data Visual* was used to eliminate the ambiguity between visualization and visualisation. Moreover, this term was related to one of the questions the paper aimed to explore: visualization of big volumes of data. Data analysis refers to the search for techniques and methods to give meaning and analyze great volumes of data. Finally, visual analytics was used to search for methods to visually present/analyze data, which is one of the challenges to work with big data.
Step 2 (search for evidence) happened through systematic review using key- words selected in step 1 in the following databases: OpenGrey, SciElo, BDTD, DOAJ, ProQuest, IBICT - OasisBr, IEEE Xplore and Science Direct. The final review used only three databases: ProQuest, IEEE Xplore and Science Direct, because of the connec-tion to the paper’s theme, providing a good number of returns to the research. The databases left out were not well aligned with the paper, not providing results for the queries.
Step 3 (selection of papers found) started in March 22, 2017. Only papers pu-blished from 2015 to 2017 related to the research were selected, with open access and peer review. The exclusion criteria for the papers was done by reading the titles, abstract and keywords of the papers.
Step 4 (selected papers analysis) consisted in establishing an importance hie-rarchy among the selected articles. The selected criteria was the journal’s quality, measured by bibliometric indexes.
Step 5 (display of results) focused in the writing and publishing of this paper. Below are the results from two systematic reviews, summarized and added with bibliometric data from the selected papers.
4. Results
The last review finished with 53 papers found until step 2. Seventeen of these were selected at the end of step 3. From the 36 papers left out, 14 had little connec-tion with Big Data and 22 involved Big Data applicaconnec-tions in diverse areas, but without mentioning the visual analytics methodology used.
4.1 Selected Papers
From the 17 papers connected to the research, 13 were found in magazines and 2 in conferences. In the magazines, most were related to Informatics and Information Sciences, but also magazines from other areas, such as education and psychology. From the eleven magazines mentioned, six were from United Kingdom, Cambridge Analytica’s Country (DAVIES, 2017).
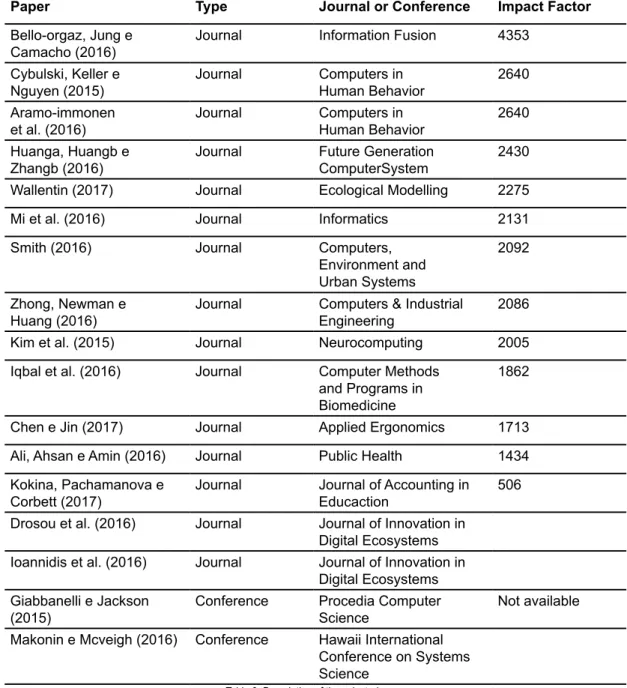
Chart 3 presents the title of the 17 selected papers, type of publication, event or magazine’s name and a bibliometric index. The papers were arranged from the highest to the smallest Impact Factor bibliometric index.
Table 3: Description of the selected papers
According to Table 3, from the 17 selected papers, all 15 articles published in magazines and 2 presented in conferences. Ten of them were from United Kingdom, three from USA, 2 from Saudi Arabia e 2 from Netherlands. The Journal of Innovation in Digital Ecosystems was first published in January, 2017, because of that, there were no bibliometric indexes available. About Big Data application, a wide range of cations were verified in many areas. Nine out of 17 papers were clear about the appli-cation: 3 in public health, 2 in social networks, 2 in visualization of multidimensional data, 1 in business management, 1 in architecture and 1 in ecology. One publication is about many areas, including public health and social network, but the focus is on finance and marketing use.
4.2 Identified Visual Analytics Techniques
The tools used to interpret Big Data results in the 17 papers are shown below.
Paper Type Journal or Conference Impact Factor
Bello-orgaz, Jung e
Camacho (2016) Journal Information Fusion 4353
Cybulski, Keller e
Nguyen (2015) Journal Computers in Human Behavior 2640
Aramo-immonen
et al. (2016) Journal Computers in Human Behavior 2640
Huanga, Huangb e
Zhangb (2016) Journal Future Generation ComputerSystem 2430
Wallentin (2017) Journal Ecological Modelling 2275
Mi et al. (2016) Journal Informatics 2131
Smith (2016) Journal Computers,
Environment and Urban Systems
2092 Zhong, Newman e
Huang (2016) Journal Computers & IndustrialEngineering 2086
Kim et al. (2015) Journal Neurocomputing 2005
Iqbal et al. (2016) Journal Computer Methods
and Programs in Biomedicine
1862
Chen e Jin (2017) Journal Applied Ergonomics 1713
Ali, Ahsan e Amin (2016) Journal Public Health 1434
Kokina, Pachamanova e
Corbett (2017) Journal Journal of Accounting inEducaction 506 Drosou et al. (2016) Journal Journal of Innovation in
Digital Ecosystems Ioannidis et al. (2016) Journal Journal of Innovation in
Digital Ecosystems Giabbanelli e Jackson
(2015) Conference Procedia Computer Science Not available
Makonin e Mcveigh (2016) Conference Hawaii International Conference on Systems Science
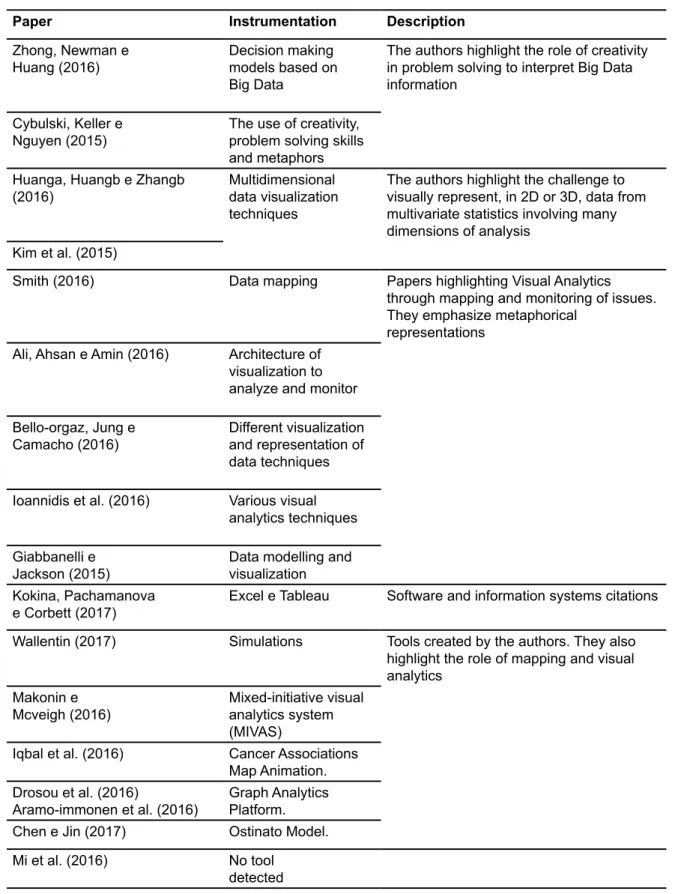
Table 4: Papers and instrumentation What is common in the papers displayed in Table 4 is:
a) In eight papers the visualization techniques emphasized the use of maps and metaphors to comprehend data.
b) Four papers highlighted that the role of map visualization is to promote
moni-Paper Instrumentation Description
Zhong, Newman e
Huang (2016) Decision making models based on Big Data
The authors highlight the role of creativity in problem solving to interpret Big Data information
Cybulski, Keller e
Nguyen (2015) The use of creativity, problem solving skills and metaphors Huanga, Huangb e Zhangb
(2016) Multidimensional data visualization techniques
The authors highlight the challenge to visually represent, in 2D or 3D, data from multivariate statistics involving many dimensions of analysis
Kim et al. (2015)
Smith (2016) Data mapping Papers highlighting Visual Analytics
through mapping and monitoring of issues. They emphasize metaphorical
representations Ali, Ahsan e Amin (2016) Architecture of
visualization to analyze and monitor Bello-orgaz, Jung e
Camacho (2016) Different visualization and representation of data techniques Ioannidis et al. (2016) Various visual
analytics techniques Giabbanelli e
Jackson (2015) Data modelling andvisualization Kokina, Pachamanova
e Corbett (2017) Excel e Tableau Software and information systems citations Wallentin (2017) Simulations Tools created by the authors. They also
highlight the role of mapping and visual analytics
Makonin e
Mcveigh (2016) Mixed-initiative visualanalytics system (MIVAS)
Iqbal et al. (2016) Cancer Associations Map Animation. Drosou et al. (2016)
Aramo-immonen et al. (2016) Graph Analytics Platform.
Chen e Jin (2017) Ostinato Model.
Mi et al. (2016) No tool
toring of its study objects via the creation of dashboards to keep up with the changes. Three papers highlighted that the monitoring must, by nature, help the specialists predict future states of the subject. In two papers the focus were in representing mul-tidimensional data in 2 or 3 dimensions.
c) 4 papers were about the use of different techniques and models, used in po-orly systematized form.
d) Only one paper mentioned tools and programming languages (Excel and Ta-bleau);
e) Two papers highlighted the importance of creative problem solutions in Big Data interpretation for decision making.
f) From the 17 papers, four developed their own tools, named below:
• Mixed-initiative visual analytics system (MIVAS): Makonin e Mcveigh (2016) mentioned five steps to Visual Analytics: data structure, choosing alternatives to vi-sualize data from comparisons, doing parametric interactions, tracing and exploring historics and promoting changes in the system from the graphics;
• Cancer Associations Map Animation (CAMA): It is about a dynamic graphic which allows to visualize cancer comorbidity from demographic criteria. The tool allowed professionals from the medical field to observe and make better inferences about how cancer associates with other illnesses;
• Graph Analytics Platform (GAP): The tool mixes diverse visualization techni-ques, with emphasis in behavioral clustering, interactive visualizations and multi-ob-jective optimization. According to Drosou et al (2016) GAP auxiliates the social media analysts to obtain insights about the more important information among subjects in online communication;
• Ostinato Model. Developed by Aramo-immonen et al (2016) it aims to moni-tor informal learning in communities measured by twitter. The tool promotes Visual Analytics of data from Twitter users in automated interactive cycles in search for lear-ning evidence and community organization.
5. Discussion
Next, the results obtained will be discussed in three topics: ontological and epis-temological Big Data issues found in the research; findings about identified knowled-ge creation tools; one part about diverse issues.
5.1 Lack of interpretation protocols
The paper’s initial goal consisted in research interpretation models in Big Data from economics, psychology and other social science. The systematic reviews results were unsuccessful, but they showed Visual Analytics as a relevant topic to be resear-ched. The lack of well defined protocols to work with make the Big Data professionals prefer to use visual resources to facilitate interpretation.
visualization design than on the results of interpretative models used to understand problems. That can be partially explained by the big volume of information created by it. This way, visualization techniques help make the results comprehensible before interpretation.
5.2 Best practices in Visual Analytics
As summarized in chart 1, ontologically, Big Data involves a growing refinement of information. It starts with data, becomes grouped information, then the knowled-ge is mapped and wisdom must be created to support decision making. The seven-teen selected papers showed that data structuration and mapping of information are commonly mentioned as parts of the same process. It is possible to imply that pro-fessionals working with visual representations know how the data was structured and statistically treated. The use of Visual Analytics requires a specialist with knowledge in statistics and visualization techniques. The paper about mapping cancer comorbidi-ties with Big Data used health professionals to work both in statistics and interpreta-tion of results (IQBAL ET AL, 2016).
In the issues involved in the papers, it was observed that Visual Analytics is used to describe and map results with multiple possible answers without being very spe-cific. Issues like “how to score candidates from the same house?” creates ordinated scales as answers which are easier to interpret, because they are more precise. Pro-blems involving multiple possible answers, such as “where will the next flu outbre-ak be?” generate lots of information visualizations, like maps and dashboards which require a specialist to interpret and monitor it. In that sort of issues, Visual Analytics facilitates Big Data results interpretation.
Integrating what was presented so far, the process of Visual Analytics can be represent according to the diagram in Picture 4:
Picture 4 – Visual Analytics Process
Picture 4 indicates that an interdisciplinary specialist must be responsible for the process. It happens because such professional, or team of professionals, must know about at least three subjects: a) statistical knowledge to understand how the infor-mation was extracted from data; b) creation of inforinfor-mation visualizations techniques; c) some sort of previous knowledge to analyze and express visually the information and make decisions out of these created visualizations (economists, psychologists, marketers and others).
5.3 Preference for customized tools
It is observed that the biggest values in the Impact Factor index are from papers related to theoretical basis about creativity in visualization and problem solving, and techniques to do it. Opposingly, the papers with tools created by the authors had little impact, according to the index. This suggests that researchers do not want tools developed by others, but want to design their own, preferring the first sort of publi-cation.
It means Visual Analytics seems to be specific for its own purpose of design, being hard to use or adapt it to other ends. An alternative explanation could be that the tools would be very specialized in its own area of knowledge. Because of that, there are not a whole lot of people or places to use it. One way or another, Visual Analytics tools are made on demand, and are very customized to its own purpose, making it difficult to reutilize them in other contexts.
5.4 About the Visual Analytics tools found
The four tools found (MIVAS, CAMA, GAP and Ostinato Model) have in common the promotion of dynamic mapping, continuous monitoring of the issue and high customization (as mentioned in item E.3). Therefore, a wide set of visualization tech-niques are blended to create monitoring dashboards which work as a mapping tool of the issue in a metaphorical representation scheme (ZHANG ET AL, 2012).
Another highlight is the challenge to interpret multidimensional data in 2 or 3 dimensions. This task demands a comprehension of multivariate statistics, dimensio-nal reduction, forecasting and others to make them tangible in visual representations. Finally, the utilization of the four tools still requires the analysis of a specialist in the field. It means, Visual Analytics act as a support for decision making. The knowle-dge and intuition of a professional are necessary to make good use of them.
6. Final Considerations
The main remarks from the authors about the research results, were organized by theme in four sections.
6.1 About the Objective and Method in this paper
This paper achieved its objective once a picture of Visual Analytics was deve-loped after a judicious research. In terms of method, the systematic review with the bibliometric analysis proved to be an adequate procedure for the study, because it allowed to explore in quantitative and qualitative manner the area of Visual Analytics in Big Data.
However, the authors question if the publications in journals and conferences express a good display of the state of the art in Visual Analytics. That is because some
of the main developers of this techniques are private companies. As many others, they may not have the interest in academic publishing of their findings and developments.
6.2 Possible uses of this paper
As possible contributions of this paper we have:
a) The importance of having statistical knowledge, visualization techniques and professionals from different areas together to perform Visual Analytics in Big Data;
b) The suggestions of Visual Analytics process for some issues, addressable by Big Data, to make data into knowledge to support decision making.
6.3 Future research suggestions
As suggestions for future research:
a) Methodological issues in Big Data, involving ethics and epistemology, the is-sue of reliability in the created knowledge and data usage privacy;
b) Innovative ways of visualizing data through augmented and virtual reality to represent information from multidimensional data.
REFERENCES
ALI, M.a.; AHSAN, Z.; AMIN, M.. ID-Viewer: a visual analytics architecture for infectious diseases 15 surveillance and response management in Pakistan. Public Health, Kabul, v. 134, n. 12, p.72-89, 12 maio 2016.
ARAMO-IMMONEN, Heli et al. Visualizing informal learning behavior from conferen-ce participants’ Twitter data with the Ostinato Model. Computers In Human
Beha-vior, London, v. 55, n. 1, p.584-595, 22 fev. 2016.
BOYD, Danah; CRAWFORD, Kate. Six provocations for Big Data. 2016. Available : <http://www.ils.albany.edu/wordpress/wp-content/uploads/2016/01/Six-provoca-tions-for-Big-Data1.pdf>. Acessed in: 18 mar. 2017.
BURBANK, Donna. The 5 V’s of Big Data. Available in: <http://enterprisearchitects. com/the-5v-s-of-big-data/>. Acessed in: 02 apr. 2017.
BELLO-ORGAZ, Gema; JUNG, Jason J.; CAMACHO, David. Social big data: Recent achievements and new challenges. Information Fusion, London, v. 28, n. 12, p.45-59, mar. 2016.
CHEN, Min; MAO, Shiwen; LIU, Yunhao. Big Data: A Survey. Mobile Networks And
org/10.1007/s11036-013-0489-0. Available in: <http://www.ece.ubc.ca/~minchen/ min_paper/BigDataSurvey2014.pdf>. Acessed in: 22 mar. 2017.
CHEN, Xiaoyu; JIN, Ran. Statistical modeling for visualization evaluation through data fusion. Applied Ergonomics, New York, v. 2, n. 4, p.45-56, 19 jan. 2017.
CYBULSKI, Jacob L.; KELLER, Susan; NGUYEN, Lemai. Creative problem solving in digital space using visual analytics. Computers In Human Behavior, London, v. 42, n. 12, p.20-35, 10 jan. 2015.
DAVIES, William. How statistics lost their power – and why we should fear what
comes next. 2017. Available in: <https://www.theguardian.com/politi-
cs/2017/jan/19/crisis-of-statistics-big-data-democracy>. Acessed in: 18 mar. 2017.
DIEBOLD, Francis X.. On the Origin(s) and Development of the Term “Big Data”. 2012. Available in: <https://economics.sas.upenn.edu/sites/economics.sas.upenn. edu/files/12-037.pdf>. Acessed in: 28 mar. 2017.
DROSOU, Anastasios et al. An enhanced Graph Analytics Platform (GAP) providing in-sight in Big Network Data. Journal Of Innovation In Digital Ecosystems, New York, v. 3, n. 2, p.83-97, 23 dez. 2016.
FAYYAD, Usama; PIATETSKY-SHAPIRO, Gregory; SMYTH, Padhraic. From Data Mining to Knowledge Discovery in Databases. Ai Magazine, [s.i], v. 17, n. 3, p.37-54, Não é um mês valido! 1996. Available in: <http://www.aaai.org/ojs/index.php/aimagazine/ article/viewFile/1230/1131>. Acessed in: 01 apr. 2017.
FRIEDMAN, Uri. Big Data: a short history. 2012. Available i n : <http://foreignpolicy.com/2012/10/08/big-data-a-short-history/>. Acessed in: 04 mar. 2017.
GIABBANELLI, Philippe J.; JACKSON, Piper J.. Using Visual Analytics to Support the Integration of Expert Knowledge in the Design of Medical Models and Simulations.
Procedia Computer Science, London, v. 15, n. 2, p.755-764, mar. 2015.
GIL, Antonio Carlos. Como elaborar projetos de pesquisa . São Paulo: Atlas, 2002 HUANGA, Mao Lin; HUANGB, Tze-haw; ZHANGB, Xuyun. A novel virtual node appro-ach for interactive visual analytics of big datasets in parallel coordinates. Future
Ge-neration Computer Systems, Londres, v. 55, n. 12, p.510-523, fev. 2016.
IQBAL, Usman et al. Cancer-disease associations: A visualization and animation throu-gh medical big data. Computer Methods And Programs In Biomedicine, London, v.
127, n. 121, p.44-51, 1 abr. 2016.
KIM, Hannah et al. Doubly supervised embedding based on class labels and intrinsic clusters for high-dimensional data visualization. Neurocomputing, Washington, v. 150, n. 8, p.575-582, 20 fev. 2015.
KOKINA, Julia; PACHAMANOVA, Dessislava; CORBETT, Andrew. The role of data visu-alization and analytics in performance management: Guiding entrepreneurial growth decisions. Journal Of Accounting Education, London, v. 38, n. 12, p.50-62, 12 mar. 2017.
MAKONIN, Stephen; MCVEIGH, Daniel. Mixed-Initiative for Big Data: The Intersection of Human + Visual Analytics + Prediction. In: HAWAII INTERNATIONAL CONFERENCE ON, 49., 2016, Honululu. Anais... . Honululu: Iee, 2016. v. 4, p. 342 - 354.
MALHOTRA, N. Pesquisa de marketing. 3.ed. Porto Alegre: Bookman, 2001.
MARCONI, Marina de A. & LAKATOS, Eva. M. Fundamentos da Metodologia
Científi-ca. São Paulo: Atlas, 2003.
MEDEIROS, Ivan L. de; VIEIRA, Alessandro; BRAVIANO, Gilson. Revisão Sistemática e Bibliometria facilitadas por um Canvas para visualização de informação. Revista
Bra-sileira de Design da Informação, São Paulo, v. 1, n. 12, p.93-110, MAR.2015. Available
in: <https://www.infodesign.org.br/infodesign/article/viewFile/341/213>. Acessed in: 24 mar. 2017.
MI, Peng et al. AVIST: A GPU-Centric Design for Visual Exploration of Large Multidi-mensional Dataset. Informatics, New York, v. 4, n. 3, p.123-134, out. 2016.
NETTO, Adriana Sodré del Prá; MORO, Evandro Pioli; FERREIRA, Fernanda Folly. Big
Data e suas influências sobre a estratégia das empresas. 2015. Available
in: <https://www.gta.ufrj.br/grad/15_1/bigdata/vs.html>. Acessed in: 18 mar. 2017. LAKATOS, Eva Maria; MARCONI, Marina de Andrade. Fundamentos de metodologia
científica. São Paulo: Atlas, 1985.
OANNIDIS, Dimosthenis et al. Occupancy driven building performance assessment.
Journal Of Innovation In Digital Ecosystems, London, v. 2, n. 3, p.57-69, dez. 2016.
PORTO, Renata Maria Abrantes Baracho; MAGALHÃES, Amarildo Martins de. Gestão da informação como suporte à redução de incerteza no processo decisório: estudo de caso do Instituto Federal de Minas Gerais - IFMG. Informação & Tecnologia (itec), Marília, v. 1, n. 1, p.81-95, MAR, 2014. Semestral. Available in: <http://pe-riodicos.ufpb.br/index.php/itec/article/view/19373/11009>. Acessed in: 18 mar. 2017.
SAMPAIO, R. F., MANCINI, M. C. Estudos de Revisão Sistemática : Um Guia Para Sínte-se Criteriosa Da Evidência Científica. Revista brasileira de fisioterapia, São Carlos, v. 11, n. 1, : 83-89, jan./fev. 2007.
SEMIDÃO, Rafael Aparecido Moron. DADOS, INFORMAÇÃO E CONHECIMENTO
EN-QUANTO ELEMENTOS DE COMPREENSÃO DO UNIVERSO CONCEITUAL DA CIÊN-CIA DA INFORMAÇÃO: CONTRIBUIÇÕES TEÓRICAS. 2014. 198 f. Dissertation -
Cur-so de Programa de Pós-graduação em Ciências da Informação, Universidade Estadual Paulista, Marília, 2014. Available in: <https://www.marilia. unesp.br/Home/Pos-Graduacao/CienciadaInformacao/Dissertacoes/semidao_ram_ me_mar.pdf>. Acessed in: 18 mar. 2017.
TARIFA, Alexandre. Big Data: o que é e como usar na sua empresa. 2014. Available in: <https://endeavor.org.br/big-data-descubra-o-que-e-e-como-usar--na-sua-empresa/>. Acessed in: 01 apr. 2017.
SMITH, Duncan A.. Online interactive thematic mapping: Applications and techniques for socio-economic research. Computers, Environment And Urban Systems, Lon-don, v. 57, n. 13, p.106-117, 12 maio 2016.
ZHANG, Leishi et al. Visual Analytics for the Big Data Era – A Comparative Review of State-of-the-Art Commercial Systems. In: IEE CONFERENCE ON VISUAL ANALYTICS, 1., 2012, Seatle. Proceedings... . Seatle: Giusepe Santucci, 2012. p. 173 - 182.
ZHONG, Ray Y.; NEWMAN, Stephen T.; HUANG, George Q.. Big Data for supply chain management in the service and manufacturing sectors: Challenges, opportunities, and future perspectives. Computers & Industrial Engineering, Liverpool, v. 101, n. 12, p.572-591, 12 nov. 2016.