DESIGN OF A SUPPLY CHAIN NETWORK WITH FINANCIAL
CONSID-ERATIONS
Maria Alexandra Teixeira Borges Vieira Pouzada
Thesis
Doctoral Program in Business and Management Studies
Supervised by
Dalila Benedita Machado Martins Fontes José Fernando Gonçalves
Biographical note
Alexandra Borges is a lecturer at Polytechnic Institute of Viana do Castelo (IPVC) since 2001, in the area of Logistics and Operations Management. She started her professional career in the automotive business sector (BMW PT) in 1996, where she remained until 2012, developing professional experience in the marketing/commercial and quality/operations management areas. In 2012 she got a title of specialist in Management and Administration (area of quality management) awarded by IPVC, Instituto Politécnico de Bragança (IPB) and IPP (Instituto Politécnico do Porto) through the provision of public evidence. She has a degree in Management from the Faculty of Economics, University of Porto and a master graduation in Business Operations Management from the Catholic University of Porto. She is now a candidate to conclude the Doctoral Program in Business and Management Studies in the Faculty of Economics of Porto.
2
Acknowledgments
The research, development, and writing of a PhD thesis requires the help and the creative energy of many people. And this one was not an exception. I especially thank my supervisor, Professor Dalila Fontes, for all the help during this process, through her knowledge sharing, her supervising skills, energy and inspiration; and thank my co-supervisor, Professor José Fernando Gonçalves for his precious help. They both contributed with sugestions, comments, ideias and, of course, corrections, that improved this work. I also thank to Instituto Politécnico de Viana do Castelo (IPVC) for all the support. Finnaly, I thank my family for the confidence, support, help and friendship.
The support of ERDF – European Regional Development Fund through the
Operational Programme for Competitiveness and Internationalisation -
COMPETE 2020 Programme and the Portuguese funding agency, FCT - Fundação para a Ciência e a Tecnologia within project POCI-01-0145-FEDER-031821 is acknowledge.
3
Abstract
In the past few years, important supply chain decisions have captured managerial interest. One of these decisions is the design of the supply chain network incorporating financial considerations, based on the idea that the establishment of new facilities and the operating costs have a direct effect on the company’s financial performance. However, works on supply chain network design (SCND) incorporating financial decisions are scarce. In this work, we propose a mixed integer linear programming (MILP) model to address a SCND problem where combined operational and investment decisions maximize the company value, measured by Shareholder Value Analysis (SVA), while respecting the usual operational constraints, as well as financial ratios and constraints. In particular, our model considers the design of a deterministic multiproduct, multi-echelon supply chain network (SCN) problem in a dynamic environment, allowing for decision making at every single time period of the planning horizon, in order to deal with market fluctuations. The model is tested using a case study available in the literature and is solved using the mathematical program-ming solver Gurobi 7.0.1.
This work extends current research by introducing infrastructure dynamics, and adding the pos-sibility of closing facilities. It also improves financial aspects when modelling a SCN by considering debt repayments and shareholders capital entries as decision variables, as well as improving on the calculation of some financial values; which together lead to greater value creation. Finally, measur-ing the value created by usmeasur-ing SVA is also an improvement to current research not only because it is the most supported approach in the literature, but also because it avoids some of the drawbacks of Economic Value Added (EVA), such as increasing inventories (which increases production) in order to increase the value of the company.
4
Resumo
Nos últimos anos, decisões importantes sobre a cadeia de abastecimento captaram o interesse dos gestores. Uma dessas decisões é a configuração / reconfiguração da rede da cadeia de abaste-cimento incorporando considerações financeiras, com base no facto de o investimento necessário para estabelecer novas instalações e os custos operacionais resultantes afetarem diretamente o de-sempenho financeiro da empresa. No entanto, trabalhos sobre a configuração da cadeia de abaste-cimento que incorporem decisões financeiras são escassos. Nesta tese, propomos um modelo de programação linear inteira mista para resolver um problema de configuração de uma cadeia de abastecimento, que inclui as decisões operacionais usuais, mas também decisões de investimento e tem por objetivo a maximização do valor da empresa, medido por Shareholder Value Analysis (SVA). Para além das restrições operacionais usuais, também se impõem restrições que permitam cumprir diversos indicadores e rácios financeiros. Em particular, o nosso modelo considera a configuração / reconfiguração de um problema determinístico de rede de cadeia de abastecimento de múltiplos produtos e níveis, em ambiente dinâmico, permitindo a tomada de decisões em todos os períodos do horizonte de planeamento, de forma a poder reagir às flutuações do mercado de forma eficaz e eficiente. O modelo é resolvido recorrendo ao Gurobi 7.0.1 e testado num estudo de caso dispo-nível na literatura.
Este trabalho é inovador e contribui para a literatura em quatro vertentes. Por um lado, para além de permitir a abertura de instalações, também permite o seu fecho. Por outro lado, tais deci-sões são tomadas num ambiente dinâmico, ou seja, as decideci-sões quanto à configuração da rede da cadeia de abastecimento são tomadas em cada um dos períodos do horizonte de planeamento. Relativamente aos aspetos financeiros há duas contribuições distintas. Uma relativa à inclusão de decisões financeiras, que nos trabalhos anteriores não eram consideradas, e outra relativa à função objetivo utilizada. A utilização do SVA como medida do valor da empresa, para além de ser a abordagem mais suportada na literatura, evita as desvantagens da utilização Economic Value Added (EVA), que incentiva a criação de inventários (e, consequentemente, da produção) como forma de aumentar o valor da empresa. Adicionalmente, é melhorado o cálculo de alguns valores financeiros, tais como depreciações, fluxos de caixa e amortização da dívida.
5
Contents
List of tables 7
List of figures 10
1 Introduction 11
1.1 Introduction to supply chain management 11
1.2 The need for financial considerations 12
1.3 Scope of the thesis 13
1.4 Thesis overview 14
2 Literature review 16
2.1 From logistics to supply chain management 16
2.1.1 First essays 16
2.1.2 The emergence of a new discipline 16
2.1.3 Creating maturity 17
2.1.4 Supply chain management 19
2.2 Planning the supply chain network 21
2.3 Modeling the supply chain network 24
2.4 Supply chain models with financial issues 36
2.5 Supply chain design and its relevance for shareholder value creation 43
2.6 Research opportunities in supply chain network design 47
3 Problem definition 49
3.1 Problem description 49
3.2 Solution approach 52
4 Mathematical programming model 54
4.1 Objective function 58
4.2 Constraints 64
4.2.1 Financial constraints 65
6
5 Computational experiments 79
5.1 Case study description 79
5.2 Modelling with EVA as the objective function 81
5.2.1 EVA base-case 81
5.2.2 EVA dynamic – opening 84
5.2.3 EVA dynamic – opening and closing 85
5.2.4 EVA dynamic – opening and closing with financial aspects (full model) 87
5.3 Modelling with SVA as the objective function 91
5.3.1 SVA base-case 92
5.3.2 SVA dynamic – opening 94
5.3.3 SVA dynamic – opening and closing 94
5.3.4 SVA dynamic – opening and closing with financial aspects (full model) 96
5.4 Discusssion of the results 105
6 Conclusions and future work 110
Appendix A 114
Appendix B 119
7
List of tables
Table 1 Summary of the literature review on supply chain network design (2008-2019) (i). ...32
Table 2 Summary of the literature review on supply chain network design (2008-2019) (ii). ...33
Table 3 Summary of the literature review on supply chain network design (2008-2019) (iii). ...34
Table 4 Summary of the literature review on supply chain network design (2008-2019) (iv). ...35
Table 5 Inventory quantities by plant at the beginning of the planning horizon. ...80
Table 6 Demand by customer zone and in each time period. ...80
Table 7 Total aggregated flows transported from the plants to the warehouses for the EVA base-case. ...83
Table 8 Total aggregated flows transported from the warehouses to the distribution centers for the EVA base-case. ...84
Table 9 Total aggregated flows transported from the distribution centers to the customer zones for the EVA base-case. ...84
Table 10 Transportation costs for alternative routes in year 1. ...85
Table 11 Selling price for each facility at each time period (in monetary units). ...86
Table 12 Total aggregated flows transported from the plants to the warehouses for EVA full-model. ...90
Table 13 Total aggregated flows transported from the warehouses to the distribution centers for EVA full-model. ...90
Table 14 Total aggregated flows transported from the distribution centers to the customer zones for EVA full-model. ...91
Table 15 Production quantities by plant and time period for EVA full-model. ...91
Table 16 Total aggregated flows transported from the plants to the warehouses for SVA base-case. ...93
Table 17 Total aggregated flows transported from the warehouses to the distribution centers for SVA base-case. ...93
Table 18 Total aggregated flows transported from the distribution centers to the customer zones for SVA base-case. ...94
Table 19 Discounted free cash flow calculation considering the sale of W4 in years 3 and 4 for SVA dynamic – opening and closing. ...95
Table 20 Production quantities for each plant and time period for SVA full-model. ... 100
Table 21 Final inventory quantities by plant and time period for SVA full-model. ... 100
Table 22 Aggregated flows transported from the plants to the warehouses for SVA full-model. ... 101
Table 23 Inventory quantities by warehouse and time period for SVA full-model. ... 101
Table 24 Aggregated flows transported from the warehouses to the distribution centers for SVA full-model. ... 102
Table 25 Final inventory quantities by distribution center and time period for SVA full-model. ... 102
Table 26 Aggregated flows transported from the distribution centers to the customer zones for SVA full-model. ... 103
Table 27 Production, transportation, and inventory costs for each time period for SVA full-model. ... 104
8
Table 29 Value created and network structure obtained in each experiment, with EVA as the objective
function. ... 106
Table 30 Value created and network structure obtained in each experiment, with SVA as the objective function. ... 108
Table 31 EVA value for both optimization criteria. ... 109
Table 32 SVA value for both optimization criteria. ... 109
Table 33 Maximum production capacity. ... 114
Table 34 Coefficient of utilization of resources. ... 114
Table 35 Demand by product in time period 1. ... 114
Table 36 Demand by product in time period 2. ... 115
Table 37 Demand by product in time period 3. ... 115
Table 38 Demand by product in time period 4. ... 115
Table 39 Production and storage costs at plants in relative money units per ton. ... 116
Table 40 Transportation cost from plants to warehouses, in relative money units per ton. ... 116
Table 41 Warehouses infrastructure costs and inventory costs in relative money units per ton. ... 116
Table 42 Transportation cost from warehouses to distribution centers, in relative money units per ton. 116 Table 43 Distribution centers infrastructure costs and inventory costs in relative money units per ton. . 117
Table 44 Transportation cost from distribution centers to customer zones, in relative money units per ton. ... 117
Table 45 Price of products for each customer zone, in relative money units per ton. ... 117
Table 46 Balance sheet at the beginning of the planning period, in relative money units per ton. ... 118
Table 47 Financial cycle parameters in each time period. ... 118
Table 48 Bounds for financial ratios. ... 118
Table 49 Production quantities in PL1 by product and in each time period for SVA full-model. ... 119
Table 50 Production quantities in PL2 by product and in each time period for SVA full-model. ... 119
Table 51 Production quantities in PL3 by product and in each time period for SVA full-model. ... 119
Table 52 Flows transported from the plants to W1 by product and in each time period for SVA full-model. ... 120
Table 53 Flows transported from the plants to W2 by product and in each time period for SVA full-model. ... 120
Table 54 Flows transported from the plants to W3 by product and in each time period for SVA full-model. ... 121
Table 55 Flows transported from the plants to W4 and in each time period for SVA full-model. ... 121
Table 56 Flows transported from the warehouses to DC1 by product and in each time period for SVA full-model. ... 122
Table 57 Flows transported from the warehouses to DC2 by product and in each time period for SVA full-model. ... 122
Table 58 Flows transported from the warehouses to DC3 by product and in each time period for SVA full-model. ... 123
9
Table 59 Flows transported from the warehouses to DC4 by product and in each time period for SVA
full-model. ... 123
Table 60 Flows transported from the warehouses to DC5 by product and in each time period for SVA full-model. ... 124
Table 61 Flows transported from the warehouses to DC6 by product and in each time period for SVA full-model. ... 124
Table 62 Flows transported from the distribution centers to CZ1 by product and in each time period for SVA full-model... 125
Table 63 Flows transported from the distribution centers to CZ2 by product and in each time period for SVA full-model... 126
Table 64 Flows transported from the distribution centers to CZ3 by product and in each time period for SVA full-model... 127
Table 65 Flows transported from the distribution centers to CZ4 by product and in each time period for SVA full-model... 128
Table 66 Flows transported from the distribution centers to CZ5 by product and in each time period for SVA full-model... 129
Table 67 Flows transported from the distribution centers to CZ6 by product and in each time period for SVA full-model... 130
Table 68 Flows transported from the distribution centers to CZ7 by product and in each time period for SVA full-model... 131
Table 69 Flows transported from the distribution centers to CZ8 by product and in each time period for SVA full-model... 132
Table 70 Inventory quantities at PL1 by product and in each time period for SVA full-model. ... 133
Table 71 Inventory quantities at PL2 by product and in each time period for SVA full-model. ... 133
Table 72 Inventory quantities at PL3 by product and in each time period for SVA full-model. ... 133
Table 73 Inventory quantities at W1 by product and in each time period for SVA full-model. ... 134
Table 74 Inventory quantities at W2 by product and in each time period for SVA full-model. ... 134
Table 75 Inventory quantities at W3 by product and in each time period for SVA full-model. ... 134
Table 76 Inventory quantities at W4 by product and in each time period for SVA full-model. ... 134
Table 77 Inventory quantities at DC1 by product and in each time period for SVA full-model. ... 135
Table 78 Inventory quantities at DC2 by product and in each time period for SVA full-model. ... 135
Table 79 Inventory quantities at DC3 by product and in each time period for SVA full-model. ... 135
Table 80 Inventory quantities at DC4 by product and in each time period for SVA full-model. ... 135
Table 81 Inventory quantities at DC5 by product and in each time period for SVA full-model. ... 135
10
List of figures
Figure 1 A generic supply chain network (Melo et al., 2009). ...21
Figure 2 Alternative production locations in a global supply chain (Meixell and Gargeya, 2005). ...22
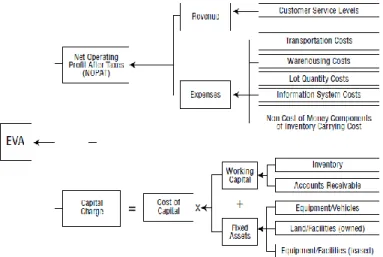
Figure 3 Logistics impacts on EVA (Lambert and Burduroglu, 2000). ...46
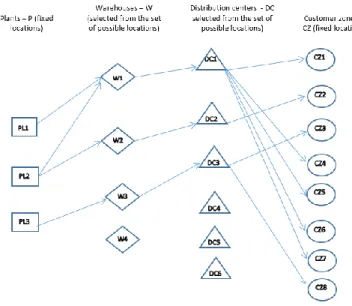
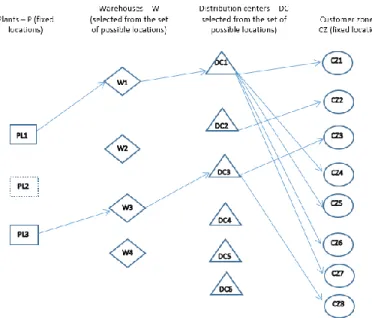
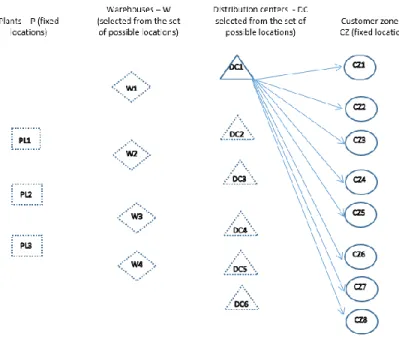
Figure 4 The supply chain network considered in the proposed model. ...49
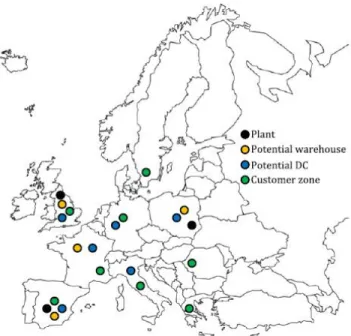
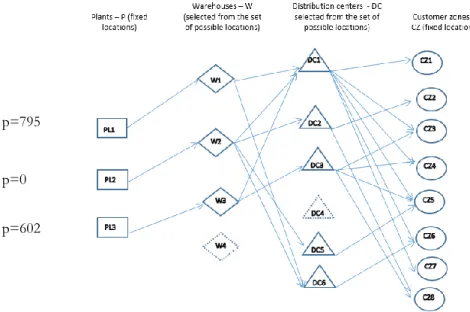
Figure 5 The possible locations for the network of the case study. ...79
Figure 6 Network structure and total production quantities and product flows over the 4 years for the EVA base-case. ...83
Figure 7 Network structure and used product flows in year 1 for EVA full-model. ...88
Figure 8 Network structure and used product flows in year 2 for EVA full-model. ...89
Figure 9 Network structure and used product flows in year 3 for EVA full-model. ...89
Figure 10 Network structure and used product flows in year 4 for EVA full-model. ...90
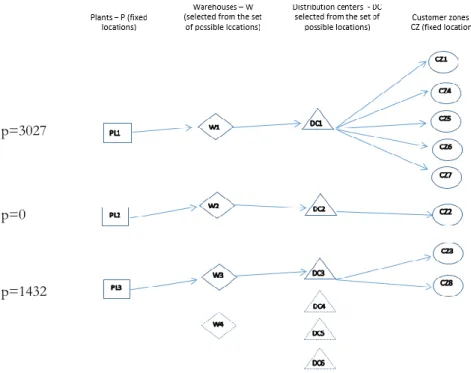
Figure 11 Network structure and used product flows for SVA base-case. ...93
Figure 12 Network structure and used product flows for the complete model in year 1 for SVA full-model. ...98
Figure 13 Network structure and used product flows for the complete model in year 2 for SVA full-model. ...98
Figure 14 Network structure and used product flows for the complete model in year 3 for SVA full-model. ...99
Figure 15 Network structure and used product flows for the complete model in year 4 for SVA full-model. ...99
11
1
Introduction
1.1 Introduction to supply chain management
One of the most significant changes in the paradigm of modern business management is the entering in a new era where individual firm performance and competitive advantage are linked to supply chain performance (Lambert et al., 1998). A supply chain consists of a set of companies directly involved in the upstream and/or downstream flows of products or services from a supplier to a customer (Mentzer et al., 2001). The main objective of supply chain management (SCM) is to maximize competitiveness and profitability of the company, as well as the whole supply chain net-work, as it offers the opportunity to capture the synergy of intra and inter-company integration and management (Lambert et al., 1998).
Until recently, strategic planning exercises in many companies were based on qualitative mana-gerial judgments about future directions of the firm and the markets in which they compete, often ignoring supply chain. In the past few years, however, important supply chain decisions have cap-tured managerial interest (Shapiro, 2004). Several developments, such as new technologies and short-life products, as well as fierce competition among companies and increasing expectations of customers have led organizations to make large investments in their supply chains (Govindan et al., 2017). In addition, the growth of globalization in the last couple of decades, along with its management challenges, has motivated both practitioner and academic interest in global supply chain management (Meixell and Gargeya, 2005; Govindan et al., 2017).
One of the greatest challenges in supply chain management is the design of the supply chain network of a company or of a set of collaborating companies. Supply chain network design (SCND) involves decision making at both strategic and tactical levels. The former addresses deci-sions regarding the number, location, and capacity of the facilities and the assignment of each market region to one or more facilities locations; while the latter addresses decisions regarding production (product mix and production quantities at each plant), inventory (which products are stocked at each facility and in which quantities), distribution (product flows), and transportation modes (Melo et al., 2009; Meixell and Gargeya, 2005; Klibi et al., 2010).
The strategic decisions are made for a long planning horizon (Klibi et al., 2010) and are consid-ered one of the most important stages of supply chain management as it affects all the future tactical and operational decisions (such as production and transportation scheduling or vehicle routing) of the chain (Farahani et al., 2014). Therefore, to achieve important cost savings, they
12
should be addressed simultaneously, when optimizing the supply chain network (Shen, 2007). Moreover, companies operate in growing demand uncertainty environments, due the globaliza-tion of economic activities together with fast developments in informaglobaliza-tion technologies, which have led to shorter product life cycles, smaller lot sizes and a very dynamic customer behaviour in terms of preferences (Melo et al., 2009). Such complexity leads to a great economic potential and practical need to optimally designing all activities of all supply chain entities (Garcia and You, 2015). As a result, a growing interest in sophisticated optimization models and tools has been observed in recent years both by practitioners and by academics (Melo et al., 2009; Papageorgiou, 2009; Grossmann, 2005; Barbosa-Póvoa, 2012; Chopra and Meindl, 2012).
1.2 The need for financial considerations
Besides the analysis of decisions affecting supply chain, researchers have mentioned the im-portance of financial considerations in the SCM context (Applequist et al., 2000; Shapiro, 2004; Meixell and Gargeya, 2005; Shah, 2005; Hammami et al., 2008; Puigjaner and Guillén, 2008; Melo et al., 2009; Papageorgiou, 2009; Longinidis and Georgiadis, 2011; Ramezani et al., 2014). Shapiro (2004) suggests that strategic planning in the firm should include analysis of corporate financial decisions when modelling a supply chain. For example, each year projected profits before interest and taxes, which are heavily dependent on supply chain and demand management decisions, are critical inputs to financial planning exercises. Conversely, corporate financial decisions regarding the expansion of the company (e.g. acquisition of companies with complementary product lines) are critical to the projected competitiveness of the firm’s supply chain. Elgazzar et al. (2012) argue that managers should be aware of the connection between supply chain performance and the fi-nancial strategy of the company and how their operational actions can impact the overall fifi-nancial performance, stating that the larger part of expenditures of the companies are related with supply chain activities. This view was already supported by Christopher and Ryals (1999). According to the authors, the drivers for value creation are revenue growth, operating cost reduction, fixed capital efficiency, and working capital efficiency; all of them are both directly and indirectly affected by supply chain management.
However, optimization models for corporate financial planning that merge with optimization models for supply chain planning are still scarce. Many authors (e.g., Shapiro, 2004; Ramezani et al., 2014; Mohammadi et al., 2017) state that most of the studies have ignored decisions involving revenues, uncertainties, investment planning and other corporate financial decisions, and many
13
other aspects of enterprise planning that interact with supply chain planning. Our literature review allowed us to find two different lines of research in this subject. One, although innovative because it considers financial aspects as endogenous variables which model the financial operation and are optimized along with the other SCND variables, is too much focused on scheduling and planning problems of batch process industries. In the other, financial aspects are merely considered as known parameters used in constraints and in the objective function. We only found three studies (Longinidis and Georgiadis, 2011; Ramezani et al., 2014; Mohammadi et al., 2017) out of these lines of research, that explore the integration of operational decisions with financial decisions when planning the supply chain. However, comparing these three studies with our work, we inno-vate by using a new objective function (shareholder value analysis), by making decisions in a dy-namic environment, and by including the possibility of closing facilities at any time period of the planning horizon. Furthermore, Longinidis and Georgiadis (2011) work uses too many assump-tions which are far from realistic; Ramezani et al. (2014) study is single product; and Mohammadi et al. (2017) is focused on modelling the financial statement of the company disregarding opera-tional decisions.
1.3 Scope of the thesis
Given the growing interest of both practitioners and academics in global supply chain manage-ment, and the connection between supply chain performance and the financial strategy of the company, there is a need to develop supportive decision tools, to help managers making decisions in order to improve the overall performance of the company.
In this context, the main purpose of this work is to integrate financial aspects in supply chain network design (SCND) in a decision-making model, ensuring the company sustainability and growth. Therefore, we address a deterministic multiple-period, multi-echelon, and multi-product problem that considers simultaneously operations and financial decisions. To solve this problem we develop a mixed integer linear programming (MILP) model, which extends that of Longinidis and Georgiadis (2011). At the strategic level our model determines number and location of facilities (plants, warehouses, and distribution centers), along with the links among them. At the tactical level, our model decides the quantities to produce and to store at each facility and to make them available at each customer zone, ensuring satisfaction of demand. As financial decisions, our model chooses the amount to invest, the source of the money needed to make this investment (cash, bank debt, or capital entries from shareholders) and the repayments policy to the bank. The objective
14
function is the maximization of the value of the company through shareholder value analysis (SVA). SVA computes shareholder value (or equity value) by deducting the value of the long term liabilities at the end of the lifetime of the project from the value of the firm for the planning horizon in analysis, which is obtained through de discounted free cash flow (DFCF) method. Re-garding the constrains, in addition to the usual operational constrains, we also consider minimum and/or maximum threshold values for performance ratios, efficiency ratios, liquidity ratios, and leverage ratios, in order to ensure the financial health of the company, while making supply chain strategic and tactical decisions. The problem is formulated as a MILP and is solved using the math-ematical programming solver Gurobi 7.0.1. A receding horizon strategy can be used to account for environment dynamics of uncertainty, since such a strategy encompasses the implementation of the model decisions only in the short period, while solving the problem for a longer period. By repeatedly doing so, one can adapt its network to the reality being faced at any time.
By addressing the above issues, this thesis will improve current literature models in several ways.
We will use shareholder value analysis to calculate shareholder value creation, which is the most supported approach in the literature. Moreover, our model is adaptive in nature and is capable of dealing with market dynamics, up to a certain extent, since it allows changing the infrastructure during the planning horizon, rather than just setting it at the beginning. These strategic decisions include not only the number and location of facilities to be opened but also the possibility of closing any facility during the planning horizon. It also allows making decisions for three echelons of the supply chain (plants, warehouses, and distribution centers). In addition, it considers account-ing rules to calculate financial statement, balance sheet and financial ratios.
Part of this work, considering debt repayments and new capital entries as decision variables, improving on the calculation of some financial values, as well as introducing infrastructure dynam-ics while maximizing EVA, was already published as a book chapter (see Borges et al., 2019).
1.4 Thesis overview
The remaining chapters of this thesis are organized as follows:
Chapter 2 provides a literature review of supply chain management and all the decisions con-cerned with planning its structure. Then we review the main studies modelling supply chain and continue with a review of models with financial considerations, highlighting the importance of joint operational and financial decisions. Finally, we present the future trends in supply chain mod-elling.
15
Chapter 3 describes the problem that we address and the solution approach. The problem con-siders the design of a deterministic multiproduct, multi-echelon supply chain network, in a dynamic environment, regarding the production and distribution, as well as the infrastructure. Thus, allow-ing for decision makallow-ing at every sallow-ingle period of the plannallow-ing horizon. The problem is formulated as a MILP and is solved with the commercial software Gurobi Optimizer 7.0.1.
Chapter 4 describes the mathematical formulation of the problem. The proposed MILP uses shareholder value analysis as objective function and two groups of constraints: operational con-straints (functional and logical) for the three echelons considered and financial concon-straints to ensure that financial ratios are in accordance with the bounds established, in order to maintain the financial health of the company.
Chapter 5 tests the validity of our model using the case study from Longinidis and Georgiadis (2011). We have performed two sets of experiments: on the one hand, used the objective function of the original work, which is the maximization of the economic value added (EVA); on the other hand, we used our proposed objective function, which is the maximization of shareholder value (SVA). In order to understand which aspects of our model improve the original work the most, we made several tests in each set of experiments. The results are reported and compared with the original work.
Finally, Chapter 6 draws some conclusions, explains limitations and points out future research directions. We conclude for the benefits of our model: on the one hand, the operational and finan-cial decisions obtained allow creating more value for the company and, on the other hand, it is a model with less assumptions and thus, much closer to reality.
16
2
Literature review
2.1 From logistics to supply chain management
The logistics concept, first known as physical distribution, has undergone many significant changes over the past decades. As a cross disciplinary field, it is informed by a wide range of established disciplines like economics, mathematics, and engineering, each having its own perspec-tive and methods, which lead the first logisticians to bring to the area the perspecperspec-tives and methods from the fields and institutions where they came from (Klaus, 2009). The overall body of knowledge began in the late 1950s and early 1960s, despite the fact that a few authors started talking earlier about the benefits of getting the right goods to the right place at the right time. In the mid-1960s and until the mid-1980s it entered a new phase, which allowed the development and relative maturity of the discipline. From the late 1980s to the early 1990s, logistics entered a new era, called supply chain management.
2.1.1 First essays
The concept of trading off transportation and inventory costs was recognized formally at least as early as the mid-1880's, when Jules Dupuit, a French engineer wrote about the selection between road and water transport, and that exploitation of this basic trade-off goes even farther back in time (Langley, 1986). In academic literature physical distribution first appeared in the early 1900s and until the 1940’s agricultural economics had a great deal of influence, since the attention was centred on transporting products from farms to markets (Kent and Flint, 1997).
From 1940 through the late 1950s, logistics embraced both business and military sectors. The mil-itary requirements of the World War II developed concepts such as transport engineering and efficient physical distribution (Kent and Flint, 1997). In the business sector, academic writings started only after the end of the war and, by that time, physical distribution was seen as a subset of marketing. Warehousing, wholesaling, inventory control, materials handling and inbound and outbound transportation were separate functions (Kent and Flint, 1997). These activities were not coordinated within the firm; they were very fragmented, because areas like marketing, production, and finance were thought to be more important (Langley, 1986; Ballou 2007).
2.1.2 The emergence of a new discipline
17
and practice. A study of the airline industry from 1956 made by Lewis et al. (in Kent and Flint, 1997) introduced the concept of total cost analysis to logistics and played a very important role in laying the foundations for physical distribution. Bowersox (1983) called the period from 1950 to 1964 the “Origination and a new direction”. He explains that after the war world economy was growing, production was being expanded and the fast product proliferation needed to be supported by new distribution channels. However, he points out that the diffusion of the sales points and the need for more field inventories and warehouses reduced the distribution efficiency, substantially raising distribution costs. This led some companies to create a unit to manage physical distribution, with control over warehousing and transportation, but with no direct responsibility for inventory (Bowersox, 1983). Also in the early 1960,’s Peter Drucker raised the problem and focused attention on the challenges and opportunities in the field of logistics and distribution (Langley, 1983). The recognition of the high logistic costs led Drucker declare physical distribution as one of the most promising areas of business (Ballou, 2007). With marketing and production being relatively mature areas of analysis, logistics was an obvious area of attention (Ballou, 2007). The first logistics college course and textbook also appeared around 1960 (Ballou, 2007), but research was primarily descrip-tive and exhortadescrip-tive (Klaus, 2009).
The appearance of the systems concept integrated various outbound logistics functions into physical distribution, shifting the focus of physical distribution to an entire system of activities, called “integrated logistics” (Kent and Flint, 1997). The scope of physical distribution was extended to include physical supply and was called business logistics (Kent and Flint, 1997; Ballou, 2007).
Neither purchasing nor production was yet considered to be part of logistics and whereas pur-chasing was initially considered a buying activity, there were efforts to expand the scope to include many of the activities familiar to physical distribution but associated with the inbound side of the firm, calling them procurement or materials management (Ballou, 2007).
2.1.3 Creating maturity
In the early 1970s, the customer was regarded as the primary focus of the firm and customer service became a significant issue (Langley, 1986; Kent and Flint, 1997). By this time, marketing and production were established functions within business and they both embraced physical distri-bution, but their lack of attention to these activities led physical distribution to be developed as a separate function in a firm (Ballou, 2007).
mate-18
rials management maturity”. Throughout the world, business began to experience a series of eco-nomic downturns and the corporations moved from a purely cost-to-cost orientation to one that included revenue analysis (Bowersox, 1983). Physical distribution managers began to analyse mar-keting programs and planned customer service as well as to participate in inventory decisions and the materials management concept emerged, becoming proactive in planning strategies rather than reactive to reduce costs (Bowersox, 1983). The physical distribution structure expanded its span of control to include order processing, customer service, finished goods inventory as well as trans-portation and warehousing, and was commonly headed by top-level executives (Bowersox, 1983).
The role of operations research started in the late 1960s, due to the new possibilities of running large-scale models and mathematical calculations on computers along with a recognized need for truly scientific analysis and the growing operations research popularity (Klaus, 2009). One line of research focused on geographical aspects of logistical systems design and optimization, industrial location decisions, new approaches to vehicle routing, and scheduling and transportation optimi-zation; another line of research focused on inventory levels, lot sizing and scheduling in production and distribution (Klaus, 2009). On those early years, scholars and practitioners could not agree on a title for the field. Some of the most commonly used are distribution, physical distribution, logis-tics, business logislogis-tics, integrated logislogis-tics, materials management, value chains, and rhocrematics (a greek term referring to materials flow management) (Ballou, 2007).
From the 1970s and 1980s, when third party logistics organizations concentrated and profes-sionalized, the concept of industrialization of services, rooted in the field of scientific manage-ment, was gradually being discovered (Klaus, 2009). Another line of research that came up in par-allel was the engineering instrumentation that started through engineers who specialized on re-search and development of hard equipment and systems for logistics operations such as mecha-nized and automated transport warehousing and packaging (Klaus, 2009). Latter, this work ex-panded to industrial materials flow equipment, container hardware systems, integration of tech-nologies, computer-assisted planning, controlling, among others (Klaus, 2009).
After deregulation of transportation in the late 1970s and early 1980s, there was a strong eco-nomic incentive to coordinate inbound and outbound product movements within the manufactur-ing operations and purchasmanufactur-ing activities were added to the scope of logistics management (Ballou et al., 2000).
In addition to legal changes, there were advances in information technology, extended product-flow channels brought about by the international and global operations of many firms, and in-creased customer demands for customized products and services with quick delivery response
19
forced by high levels of competition (Ballou et al., 2000). These have encouraged managers to define their strategies in terms of product-flow channels that by then encompass multiple enter-prises of suppliers, customers, and carriers (Ballou et al., 2000).
In the early 1980s, logistics started to play a key role as a differentiator for the firm and the concept of “supply chain management” emerged (Kent and Flint, 1997). The concepts of inter organizational efficiency, environmental logistics, reverse logistics also emerged along with the awareness of the importance of globalization (Kent and Flint, 1997). Logistics became a key input to strategy formulation in the area of market segmentation and, for some industries, logistics ac-tivities became their main competitive advantage (Langley, 1986).
2.1.4 Supply chain management
Supply Chain Management (SCM) is a discipline with several influences from logistics and trans-portation, operations management, materials and distribution management, marketing, as well as purchasing and information technology (Giunipero et al., 2008). The name “supply chain manage-ment” was first used by Keith Oliver, a senior vice president in Booz Allen, in 1982 (Laseter and Oliver, 2003). Oliver developed an integrated inventory management process to balance trade-offs between the customers’ desired inventory and customer service goals. The original focus was in managing the supply chain as a single entity and not as a group of distinct functions, with the goal of fixing the suboptimal deployment of inventory and capacity caused by conflicts between func-tional groups within the company (Laseter and Oliver, 2003).
The early definitions, in 1990s, focused on the supply chain as a concept that covered the flow of goods, and management of relationships from suppliers to the ultimate customer (Giunipero et al., 2008). However, the definition of SCM as led to great discussions (Giunipero et al., 2008) and the diffusion of the field of supply chain management did not take place until the late 1990s, with most of the theoretical and empirical investigation commencing in 1997 (Lambert et al., 1998). Exactly what is SCM is still being debated: while some say it is a new concept, others say that it is a fulfilment of the activity integration promise implied in logistics early definitions, recognizing that the logistics pioneers had many of the ideas promoted by current supply chain enthusiasts (Ballou, 2007).
In 1998, the Council of Logistics Management, now named Council of SCM Professionals (CSCMP) modified the council’s name and its definition of logistics, to indicate that logistics is a subset of supply chain management and that the two terms are not synonymous (in Ballou, 2007): Supply Chain Management encompasses the planning and management of all activities involved in sourcing
20
and procurement, conversion, and all Logistics Management activities. Importantly, it also includes coordina-tion and collaboracoordina-tion with channel partners, which can be suppliers, intermediaries, third-party service pro-viders, and customers. In essence, Supply Chain Management integrates supply and demand management within and across companies. Logistics management is that part of SCM that plans, implements, and controls the efficient, effective forward and reverse flows and storage of goods, services, and related information be-tween the point of origin and the point of consumption in order to meet customer requirements.
Lambert et al. (1998) defined SCM as the integration of key business processes from end user through original suppliers that provide products, services, and information that add value for cus-tomers and other stakeholders.
Mentzer et al. (2001) define SCM as the ‘‘systematic, strategic coordination of the traditional business functions and the tactics across these business functions within a particular company and across businesses within a supply chain, for the purposes of improving the long-term performance of the individual companies and the supply chain as a whole.” The same authors define supply chain as “a set of three or more entities (organizations or individuals) directly involved in the up-stream and downup-stream flows of products, services, finances, and/or information from a source to a customer”. According to Giunipero et al. (2008), the definition by Mentzer et al. (2001) is the most encompassing. Giunipero et al. (2008) explains that the definition suggests that SCM activi-ties should include integration behaviour on the part of a firm, which would consist of a firm’s customer and supplier base. Additionally, the firms involved in the supply chain should mutually share information, risks and rewards, as well as cooperate on activities performed within the chain. Modern industrial enterprises typically involve multiproduct, multi-purpose, and multi-site fa-cilities operating in different regions and countries and dealing with global customers. In a context of multi-enterprise networks, the issues of global enterprise planning, coordination, cooperation, and robust responsiveness to customer demands are critical for ensuring effectiveness, competi-tiveness, sustainability and growth along with investment and operating costs reduction (Papageor-giou, 2009). Supply chain analysis is a key to achieving enterprise efficiency as a system view is taken. Companies cannot be competitive without considering supply chain activities, because a single company can rarely control the production of a commodity together with sourcing, distri-bution, and retail (Papageorgiou, 2009). Furthermore, supply chains compete to increase their mar-ket shares and, even if they are not facing any competitor, they should be prepared for possible future competitive situations (Farahani et al., 2014).
21
2.2 Planning the supply chain network
Management of supply chains is a complex task mainly due to the large size of the physical supply network and its inherent uncertainties. As the physical structure of a supply chain influences its performance (Shen, 2007), determining such a structure is considered one of the most im-portant stages as it affects future tactical and operational decisions of the chain (Farahani et al., 2014).
Competitiveness should also be considered in all stages of designing new supply chains (Fara-hani et al., 2014), since in a highly competitive environment improved decisions are required for efficient supply chain management at both strategic and operational levels (Papageorgiou, 2009).
Lambert et al. (1998) consider the structure of the supply chain, the network of members and the links between them, to be one of the three essential elements of the supply chain management. The other two elements being: the business processes (the activities that produce a specific output of value to the customer) and the business components (the managerial variables with which the business processes are integrated and managed). The design of the supply chain network (SCN) depends on the identification of the critical members of the supply chain and their tiers, and on the different types of process links across the SC (Lambert et al., 1998).
SCN design (or planning) involves several decisions, such as the number, location, and capacity of warehouses and manufacturing plants of a company or a set of collaborating companies (Meix-ell and Gargeya, 2005; Melo et al., 2009; Klibi et al., 2010); the flow of material through the logistics network (Melo et al., 2009); the assignment of each market to one or more locations (Meixell and Gargeya, 2005); the selection of suppliers for sub-assemblies, components, and materials; subcon-tractors; and 3PLs (third part logistics) (Meixell and Gargeya, 2005; Klibi et al., 2010), as illustrated in Figure 1.
Figure 1 A generic supply chain network (Melo et al., 2009).
22
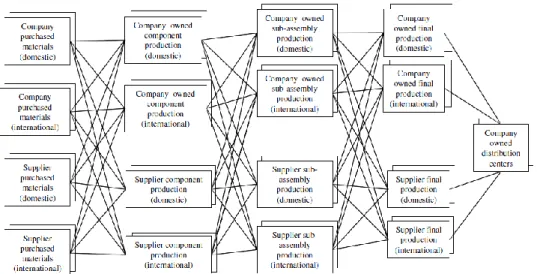
Global supply chain design extends this definition to include selection of facilities at interna-tional locations and the special globalization factors that this involves (Meixell and Gargeya, 2005). Figure 2 depicts a global supply chain network.
Figure 2 Alternative production locations in a global supply chain (Meixell and Gargeya, 2005).
The decisions of SCN design are at the strategic level, and have a long-lasting effect on the firm (Melo et al., 2009; Klibi et al., 2010). These strategic decisions must be made here-and-now but, after an implementation period, the SCN will be used on a daily basis for a long planning horizon (Klibi et al., 2010). In general, a network design project starts with the identification of potentially interesting sites for new facilities and the required capacities and, typically, large amounts of capital must be allocated to a new facility; thus, making this type of investment a long-term project (Melo et al., 2009). Although usually no design decisions are made on the tactical or even operational level, a number of issues are strongly related to them such as plant production planning and sched-uling, inventory control policies, the choice of transportation modes and capacities, vehicle routing, and warehouse layout and management (Melo et al., 2009; Papageorgiou, 2009; Ramezani et al., 2014; Garcia and You, 2015). Thus, to achieve important cost savings, the supply chain should be optimized as a whole, that is, the major cost factors that can influence the performance of the supply chain should be considered simultaneously when making such decisions (Shen, 2007).
In addition to the great level of investments and the long-term impact of the decisions, there are other complexity factors in the design of the SCN. The first factor is industry structure and decoupling points, for example, problems involving complex manufacturing make-to-order pro-cesses (Klibi et al., 2010). Moreover, changes of multiple natures during a facility lifetime may turn a good location today into a bad one in the future (Melo et al., 2009). Furthermore, global supply
23
chains design is even more difficult to manage namely because of increased transportation costs, inventory cost trade-offs due to increased lead-time in the supply chain, cultural differences that might diminish the effectiveness of business processes (Meixell and Gargeya, 2005), and other factors such as transfer prices, tariffs, tax regulations and trade barriers must also be accounted for (Klibi et al., 2010). Global supply chains also carry unique risks that influence performance, includ-ing variability and uncertainty in currency exchange rates, economic and political instability, and changes in the regulatory environment (Meixell and Gargeya, 2005). Day-to-day procurement, pro-duction, warehousing, storage, transportation, and demand management decisions generate prod-uct flows in the network, with associated costs, revenues, and service levels. The adequate design of a supply chain network requires the anticipation of these future activity levels (Klibi et al., 2010, Garcia and You, 2015). Henceforth, a rolling horizon decision-making method, which is a common business practice in this context (Sethi and Sorger, 1991), should be adopted in order to adjust to constant market changes.
Despite a rich literature on SCN design, most published works consider only a subset of these issues (Klibi et al., 2010). In short, the SCN design problem is the reengineering of such networks to enhance value creation in the companies involved. In general, SC networks are composed of five main entity types: i) external suppliers, ii) plants manufacturing intermediate and/or finished products, iii) distribution and/or sales centers, iv) demand zones, and v) transportation assets. In order to reengineer an existing SCN, an alternative potential network, including all possible options regarding supply, location, capacity, marketing, and transportation must be elaborated (Klibi et al., 2010). The main strategic questions addressed using this generic SCN design approach are the following: Which markets should we target? What delivery time should we provide in different product markets and at what price? How many production and distribution centers should be es-tablished? Where should they be located? Which activities should be externalized? Which partners should we select? What production, storage, and handling technologies should we adopt and what should their capacity be? Which products should be produced / stored in each location? Which factory / distribution / demand zones should be supplied by each supplier / factory / distribution center? What means of transportation should be used? Recovery and revalorization activities can also be considered. These strategic questions are not usually examined all together, but rather in isolation or at most few at a time (Klibi et al., 2010).
The choice of performance metrics to assess the quality of network designs is another im-portant challenge. Such measures can be used to either design a system with appropriate level of performance or compare alternative systems (Papageorgiou, 2009). Quantitative performance
24
measures can include: i) measures based on customer responsiveness (fill rate maximization, prod-uct lateness minimization, and customer response time or lead-time minimization) and ii) measures based on financial flow (cost minimization, sales and profit maximization, inventory investment minimization, and return on investment maximization) (Papageorgiou, 2009). As large investments are often required to implement strategic SCN decisions, managers require an assessment of return on investments before making such decisions (Klibi et al., 2010).
2.3 Modeling the supply chain network
Supply chain design and planning determines the optimal infrastructure (assets and network) and seeks to identify how best to use the production, distribution, and storage resources in the chain to respond to orders and demand forecasts in an economically efficient manner (Papageor-giou, 2009). According to Melo et al. (2009), the supply chain configuration problem involves ge-neric facility location setup, but also other areas such as procurement, production, inventory, dis-tribution, and routing. The need for coordinated planning of these areas was early recognized by the management science community and led to the development of mathematical models (Pa-pageorgiou, 2009). The first facility location models have gradually evolved to design distribution networks (Sadjady and Davoudpour, 2012) considering the supply chain as a whole (Melo et al., 2009).
According to Papageorgiou (2009), supply chain models can be either mathematical or simula-tion-based. Mathematical programming models are developed to optimize high-level decisions in-volving unknown configurations, taking an aggregate view of the dynamics and detail of operation, while simulation models can study the detailed dynamic operation of a fixed configuration under operational uncertainty and evaluate the expected performance measures for the fixed configura-tion.
In fact, location models have been studied in various forms for hundreds of years (ReVelle et al., 2008). The contexts in which these models have been proposed may differ; however, their main features are similar: the known location of customers and facilities whose location is to be deter-mined in a given space, while optimizing an objective function (ReVelle et al., 2008). Latter, within the context of supply chain management, location models were expanded.
Early research was mainly focused on static and discrete facility location problems (Melo et al., 2009; Papageorgiou, 2009; Klibi et al., 2010). In a discrete facility location problem (FLP), the selection of the sites where new facilities are to be established is restricted to a finite set of available
25
candidate locations and the set of demand zones that need to be satisfied are at known and given locations. On the other hand, continuous models typically assume that facilities can be located anywhere, while demand points are often taken as being at discrete and known locations. (ReVelle et al., 2008; Melo et al., 2009; Ulukan and Demircioğlu, 2015).
Sadjady and Davoudpour (2012) argue that Weber’s studies in 1909, which led to his industrial location theory, should be considered the first studies in FLP. The Weber problem consists of locating a single facility to serve m demand points with coordinates (𝑥𝑖, 𝑦𝑖) with i=1,…, m and weights (wi) with i=1,…,m. Distances in the Weber problem are often taken to be straight-line or
Euclidean distances. The problem is to find a location for a single facility, with coordinates (𝑥0, 𝑦0),
that minimize the demand-weighted total distance (ReVelle et al., 2008).
Discrete facility location problems (FLP) are concerned with choosing the best location for facilities from a given set of potential sites such that the total cost is minimized while satisfying customers’ demand. The uncapacitated facility location problem (UFLP) assumes that each facility has no limit on its capacity and that each customer is supplied by exactly one facility. The simplest forms of a UFLP are the Simple Plant Location Problem (SPLP) and the p-median problem (Ulukan and Demircioğlu, 2015). Given a set of possible locations for establishing new facilities (e.g., plants or warehouses), in the SPLP one wishes to determine the location of the supplier of a single product to a set of known customers, such that the total cost incurred is minimized (Krarub and Pruzan, 1983). Although with an uncertain origin, Krarub and Pruzan (1983) refer the works of Kuehn and Hamburger, in 1963, Manne, in 1964, and Balinski, in 1963 as the first explicit formulations of SLPL. The p-median problem is a translation of the Weber problem into a graph version by Hakimi, in 1964, that showed that an optimal solution for each problem is provided by facilities located just in the nodes of the graph (Bruno et al., 2014). In the p-median problem, p facilities are to be selected from a given set of n ≥ p facilities, in order to minimize the total weighted distances or costs for supplying customer demands, assuming that all candidate sites involve the same setup cost to establish a new facility (Melo et al., 2009).
In ReVelle et al. (2008) categorization, analytical models are based on a large number of simpli-fying assumptions. For example, a typical analytic model assumes that demands are uniformly dis-tributed across a service region and admit closed-form expressions for the total cost, typically as a function of the total number of facilities being located. However, the stringent assumptions made by this class of models make them of limited value for decision-making for practical location prob-lems ReVelle et al. (2008).
26
One of the most important extensions of the UFLP is the Capacitated Facility Location Prob-lem (CFLP), in which exogenous values are considered for the maximum demand that can be sup-plied from each potential site (Melo et al., 2009).In the Single Source Capacitated Facility Location Problem (SSCFLP) each customer is assigned to one facility that must supply its entire demand. The total demand of the customers assigned to each facility cannot exceed the capacity of the aforementioned facility. Each used facility implies an opening cost; thus, the objective is the mini-mization of the total cost, which includes the cost of opening the facilities and the cost of suppling the customers (Ulukan and Demircioğlu, 2015). This problem is, computationally, a harder problem and is usually referred to as the set partitioning problem (Klibi et al., 2010).
All of the above mentioned models have several common characteristics namely, a single-period planning horizon, deterministic demand and costs, a single product, and one type of facility and involve location–allocation decisions (Melo et al., 2009; Klibi et al., 2010). However, these models are clearly insufficient to cope with many realistic facility location settings. Therefore, several ex-tensions to the basic problems have been considered and studied (Melo et al., 2009; Klibi et al., 2010).
An important development was the consideration of a longer planning horizon, that is usually divided into several time periods, which lead to the multi-period location problem. In this problem, parameters change over time, although in a predictable way, and the goal is to adapt the configura-tion of the facilities to these changes (Melo et al., 2009). Some of the proposed models are static, that is, they involve design decisions only at the beginning of the planning horizon, but they use several planning periods to anticipate more closely operational decisions. Dynamic models have also been proposed, in this case, it is possible to revise design decisions (number, location, tech-nology, and capacity of facilities; sourcing and marketing policies) at the beginning of each plan-ning period (Klibi et al. 2010). The recognition of uncertainty, usually associated with demand or costs, led to the introduction of stochastic components (Melo et al. 2009).
Another aspect to drive location problems to be more realistic is the consideration of different types of facilities (multiple echelon), each of which with a specific role, such as production, ware-housing, etc. and with a flow between them (Melo et al., 2009). Models have also been developed to cope with multi-commodity problems (Melo et al., 2009). In the last few years, major efforts have been devoted to the development of location models with a much more detailed anticipation of transportation (routing and mode) and inventory management decisions (Klibi et al., 2010).
More recently, models have been proposed to address the reverse logistics flows, which refers to the activities dedicated to the collection and/or recovery of product returns or packages, and
27
also integrated logistics (forward and reverse logistics) (Melo et al., 2009; Pishvaee et al. 2010). Melo et al. (2009) provide a comprehensive literature review on discrete facility location prob-lems in the context of supply chain management, identifying 120 articles published between 1998 and 2008. In their first analysis, four basic features are taken into account, namely: multi-echelon facilities, multiple commodities, single or multi period and deterministic or stochastic parameters. The results of the analysis show that most of the literature deals with single-period (approximately 82% of the surveyed papers) and deterministic (approximately 80% against 20% of stochastic models) problems. Different sources of uncertainty can be found in the literature, namely: cus-tomer demands, exchange rates, travel times, amount of returns in reverse, supply lead times, trans-portation costs, and holding costs. Almost 80% of the surveyed papers refer to one or two echelons and among these, around two-thirds model location decisions in a single echelon. Moreover, as previously mentioned, it is generally assumed that customers can only be supplied from the closest echelon. The authors consider, however, that this assumption is not valid in many SCND design problems, where it may be possible to have direct shipments from upper echelon facilities to cus-tomers or to facilities not in the echelon immediately below. Another important characteristic of many supply chain networks regards flows in the same echelon. Around 59% of the papers con-sider a single product.
In a second analysis, the authors identify other decision, besides the classical location-allocation decisions. About 60% of the articles feature additional decisions, and facility location decisions are frequently combined with inventory and production decisions. In contrast, procurement, routing, and the choice of transportation modes (alone or integrated with other types of decisions) have not received much attention. Capacity expansion decisions were found just in eight articles, most of them combined with multi-period location decisions. Some authors confine capacity decisions to one specific echelon only. Inventory planning decisions are mostly focused on one echelon, namely the one involving storage. Nevertheless, five articles propose inventory decisions in several layers. The small number of papers integrating decisions regarding procurement, routing, and the choice of transportation modes with other decisions, in particular those focusing on the strategic planning level, show that existing literature is still far from combining many aspects relevant to SCM.
A final analysis was made on the type of supply chain performance measures used, the meth-odology followed to solve the problems, and applications of facility location models to strategic supply chain planning. The majority of the papers (75%) feature a cost minimization objective. Moreover, this objective is typically expressed as a single objective through the sum of various cost
28
components that depend on the set of decisions modelled. In contrast, profit maximization has received much less attention (16%). Two different categories of profit maximization can be found in the literature: i) maximization of revenues net of operational costs (operational income), and ii) after-tax profit maximization (net income). The last and smallest group of articles (9%) refers to models with multiple and conflicting objectives. In this case, in addition to economic factors, measures based on resource utilization and customer responsiveness are also considered. The latter include fill rate maximization, i.e., the maximization of the fraction or amount of customer demand satisfied within the promised delivery time, and product lateness minimization, i.e., the minimiza-tion of the time elapsed between the promised date and the actual product delivery date.
Regarding solution methodologies, about 75% of the reviewed papers solve the problems through a specific purpose method developed for the problem in hands. An exact method is used in 30% of the cases and they include branch-and-bound, branch-and-cut, column generation, and decomposition methods. Among the exact approaches, branch-and-bound algorithms have been a popular solution scheme, sometimes also combined with Lagrangean relaxation or heuristic pro-cedures to obtain bounds. When the number of discrete variables is large, and this often occurs when the strategic location decisions refer to more than one facility echelon in the supply chain network, then the resulting models are comparatively more complex and realistically sized problems can only be solved by a heuristic method (45% of the problem approaches use such a method). The remaining papers (25% of the reviewed ones) use a general purpose solver software. Finally, 68% of the articles report on case studies, while the remaining 32% use randomly generated data in an industrial context.
Meixell and Gargeya (2005) reviewed model-based literature from 1982 to 2005, specifically addressing the global supply chain design problem and selected eighteen articles based on their relevance. Global supply chain design models are a special class of supply chain design models, due to the differences in the cost structure and additional complexity of international logistics. Most of the models proposed select locations for production and/or distribution facilities in global sup-ply chains. Twelve of the proposed models consider decisions on material flows in the form of shipment quantities between production, distribution, and market locations; however, only five of them consider the supplier selection problem; a shortcoming in the author’s opinion considering the extent of outsourcing in practice today. Two of the models proposed also address capacity decisions, both how much and when. Regarding application areas, one of the proposed models address problems in the following fields: financing arrangements, product allocation, production shifting, and transportation mode selection.
29
Regarding performance measures, half of the articles analysed by Meixell and Gargeya (2005) consider profit, operating profits, or after-tax profits. From the remaining ones, eight minimize cost, one minimizes production and distribution times (instead of cost or profit), two consider flexibility in global supply chains by proposing a cost-based model and then investigating the value of having options to assign production to facilities after observing actual currency exchange rates, and another maximizes robustness of the cost-based solution, also under conditions of uncertain currency exchange rates.
Concerning integrating decisions, Meixell and Gargeya (2005) identified seven articles that co-ordinate multiple production sites and multiple markets, two that consider multiple supplier sites for multiple production sites and six that coordinate multiple production–distribution tiers for multiple markets. All eighteen articles provide an exchange rate parameter to convert local curren-cies to a common currency; six account for variability in the exchange rate by using a time index and seven use a random variable to introduce uncertainty on the global supply chain design prob-lem. Eleven of the models incorporate tariffs or duties, and eight consider non-tariff barriers. Corporate income taxes are considered in eight articles. Most of the articles provide the structure to explicitly evaluate the impact of extraordinary transportation costs in global supply chains, but only two incorporate the impact of long transit times in cost terms. The authors conclude that despite some advances, few models comprehensively address outsourcing, integration, and strategic alignment in global supply chain design.
In order to update the literature review, we searched at b-on (Online Knowledge Library) for articles published between 2008 and 2019 in academic journals with peer review using “supply chain network design model” and “supply chain network design + finance” in the title. We found 83 articles (see Table 4), after excludingsurveys, non-printed articles, articles of a qualitative nature, and articles with models covering only tactical and operational issues. We have followed a structure of analysis similar to that of Melo et al. (2009).
We began by analysing problem description characteristics, where we have included four basic features: number of echelons, number of locations, number of products, and planning horizon. We found that the great majority of the articles address multi-echelon and multi-location, repre-senting, respectively, 99% and 98%, respectively, of the total articles. Only 61% of the articles deal with multi-product and even a lesser number deals with a multi-period planning horizon (49%). Regarding stochastic elements, we found that 58% consider some sort of uncertainty. Among those, demand is the most common source of uncertainty, which has been considered in 74% of the works, followed by costs (28%). Other sources of uncertainty are also considered, namely: