Departamento de Engenharia Geogr´afica, Geof´ısica e Energia
Electricity trading through both pool and bilateral markets:
Integration of self-scheduling models in the MAN-REM
simulation software
Afonso Mota Cardoso Neves da Silva
Mestrado Integrado em Engenharia da Energia e do Ambiente
Disserta¸c˜ao orientada por:
Doutor Fernando Jorge Ferreira Lopes (Laborat´orio Nacional de Energia e Geologia) Doutora Ana Isabel Lopes Estanqueiro (Faculdade de Ciˆencias da Universidade de Lisboa)
Firstly, I would like to show my sincere appreciation to Ph.D. Fernando Jorge Ferreira Lopes and Ph.D. Ana Isabel Lopes Estanqueiro for their support and availability, for encouraging, helping and guiding me in exploring the subject of this dissertation and whose guidance was essencial for this dissertation.
A special thank you to Ph.D. Miguel Centeno Brito, who was of always available for key-discussions and helpful when required.
I would like to thank my grandparents, parents and siblings for providing an invaluable environment of stability and support, as well as as my friends for their patience and under-standing during the times they were undeservedly not my priority.
The development of the electrical sector whether in the new business model resulting from the liberalisation of a traditionally state-controlled and/or state-regulated sector or due to the de-ployment of new clean electricity production technologies poses big challenges. In particular, the advent of renewable energy and the massive penetration of variable renewable electric-ity have shaken some of the traditional pillars of the electricelectric-ity sector. Despite being the symbol of a liberalised market, the pool market is a trading mechanism which induces great uncertainty on market participants’ operations, becoming a considerable source of risk to the goals defined by the electricity sector’s companies, particularly the goal of profit maximisation. In this context, the first objective of this work is the extension of the multi-agent electricity market simulator (MAN-REM), developed by the Portuguese National Laboratory of Energy and Geology, allowing greater and better operation and mainly more interactivity of this soft-ware regarding the profit maximisation of generation companies through the optimisation of their portfolio’s production scheduling.
After the development of a mouse and keyboard based interface which greatly facilitates the interaction with users and provides a functioning structure, three profit optimisation mod-els were programmed and added to the software. Each of these modmod-els is characterised by its own portfolio composition, including the following technology portfolios: thermal, hydro and wind, and thermal and wind.
After the extension of the simulator with these new features, this work focused on demon-stration of the optimisation models, aiming to investigate their response to di↵erent input values, namely to market prices forecasts (necessary to the self-scheduling algorithms). Addi-tionally, a second case study was considered to use some of the initial features of MAN-REM to demonstrate the sensibility of market-clearing to higher wind production ratios.
The results of the first case study revealed a good logical coordination between the equa-tions of each optimisation model and the output values. Furthermore, the second case study demonstrated the well-known impact of high levels of variable generation on market clearing prices.
Keywords: Self-scheduling Optimisation| Portfolio Management | Pool Market | Bilateral Contracts| Multi-agent Systems.
A evolu¸c˜ao do sector el´ectrico, tanto ao n´ıvel do seu modelo de neg´ocio atrav´es da liberaliza¸c˜ao de um mercado h´a muito controlado e/ou regulado pelos estados, quer ao n´ıvel da evolu¸c˜ao das tecnologias de produ¸c˜ao de energia el´ectrica, apresenta grandes desafios. O advento das ener-gias renov´aveis e a penetra¸c˜ao massiva da produ¸c˜ao de eletricidade de cariz vari´avel vieram abalar alguns do princ´ıpios pelos quais o sector sempre se regeu.
Apesar de se assumir como o mecanismo s´ımbolo de um regime de mercado liberalizado, o mercado em bolsa (pool ) induz grande incerteza nas opera¸c˜oes dos agentes que nele partic-ipam, tornando-se uma fonte de risco para os objectivos tra¸cados por cada agente, podendo representar, em ´ultima an´alise, perdas n˜ao negligenci´aveis que se refletem nos balan¸cos das empresas e, por conseguinte, na sua sustentabilidade financeira a m´edio e longo prazo. A op¸c˜ao por contratos bilaterais de compra e venda de energia el´ectrica, cujas condi¸c˜oes de transa¸c˜ao s˜ao detalhadamente definidas ap´os negocia¸c˜ao e acordo entre as partes, torna-se, deste modo, uma op¸c˜ao de mitiga¸c˜ao do risco em que os agentes de mercado incorrem.
Nesta perspectiva, o objectivo deste trabalho ´e composto, numa primeira fase, pela exten-s˜ao do simulador multi-agente de mercados de energia, MAN-REM, desenvolvido pelo Lab-orat´orio Nacional de Energia e Geologia (LNEG), permitindo uma maior operacionalidade e interatividade do software na sua vertente de maximiza¸c˜ao do lucro das empresas (agentes) de produ¸c˜ao de energia el´ectrica, atrav´es da optimiza¸c˜ao do agendamento de opera¸c˜oes da sua carteira de ativos, no que respeita `as infraestruturas de produ¸c˜ao de energia el´ectrica.
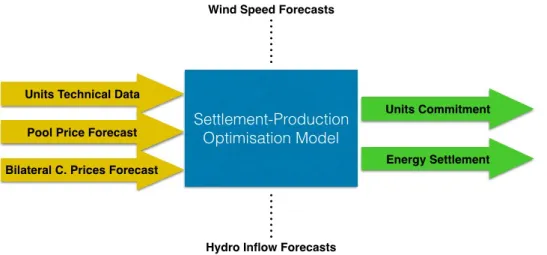
O plano de agendamento ´e calculado com base nas caracter´ısticas t´ecnicas de cada central, como o custo de produ¸c˜ao fixo, custo de produ¸c˜ao vari´avel, custo de desligamento, custo de liga¸c˜ao e, no caso de centrais t´ermicas, custos de emiss˜ao de gases de efeito de estufa. A soma de todos estes factores (quando aplic´aveis) representa, nos modelos de optimiza¸c˜ao considera-dos, o encargo financeiro decorrente da produ¸c˜ao de energia el´ectrica que dever´a ser minorado pela coloca¸c˜ao informada de volumes de energia no mercado, permitindo a anula¸c˜ao dos custos atrav´es da majora¸c˜ao dos proveitos. Consequentemente, as previs˜oes de disponibilidade de produ¸c˜ao de centrais el´ectricas de cariz vari´avel — traduzidas atrav´es de dados hor´arios de velocidade do vento (para a gera¸c˜ao e´olica) e escorrˆencia de ´aguas (para a produ¸c˜ao h´ıdrica) — e a estimativa de pre¸cos de mercado para compra e venda de energia el´ectrica, s˜ao tam-b´em dados de entrada essenciais, que permitem a um produtor “prever” quais as unidades de produ¸c˜ao rent´aveis a uma determinada hora e qual a forma mais ben´efica para a sua venda: o mercado em bolsa ou a contrata¸c˜ao bilateral.
essencial do trabalho. As diversas janelas criadas permitem simular as fun¸c˜oes de adi¸c˜ao manual de novos agentes produtores — incluindo todas as caracter´ısticas t´ecnicas dos seus portf´olios segundo as v´arias tecnologias de produ¸c˜ao inerentes a cada central —, a adi¸c˜ao de novos agentes a partir de ficheiros de dados externos (EXCEL), a optimiza¸c˜ao do agendamento da produ¸c˜ao de um agente, a visualiza¸c˜ao de dados de sa´ıda detalhados do processo de opti-miza¸c˜ao e, finalmente, a simula¸c˜ao de uma plataforma electr´onica de casamento autom´atico de ofertas compra e venda de energia em ambiente de transa¸c˜ao bilateral. Adicionalmente, foram programados trˆes modelos de optimiza¸c˜ao de lucro atrav´es do agendamento da pro-du¸c˜ao de energia el´ectrica, resultando num exerc´ıcio de programa¸c˜ao moderado a elevado. Os modelos contam com diferentes composi¸c˜oes caracter´ısticas de portf´olios, tendo sido consid-eradas carteiras de unidades produtivas exclusivamente t´ermicas, h´ıdricas e e´olicas e ainda t´ermicas e e´olicas. Os trˆes modelos foram adicionados ao simulador j´a existente (MAN-REM).
Ap´os a amplia¸c˜ao das fun¸c˜oes do simulador, quer ao n´ıvel da interface, quer do c´odigo necess´ario para possibilitar todas as suas funcionalidades e a compatibilidade com o software j´a existente, este trabalho focou-se essencialmente na demonstra¸c˜ao dos modelos de optimiza-¸c˜ao da produ¸c˜ao adicionados ao simulador, de forma a analisar a sua resposta a diferentes valores de entrada, nomeadamente `as previs˜oes de pre¸cos de mercado em bolsa (necess´arias aos algoritmos de agendamento) e, assim, assegurar o seu correto funcionamento.
A formula¸c˜ao do primeiro caso de estudo, composto por duas simula¸c˜oes do mercado di´ario por cada exerc´ıcio de valida¸c˜ao dos modelos testados, requereu, para as vinte e quatro horas de um dado dia, a utiliza¸c˜ao de um conjunto de perfis de consumo fixos, alocados a um grupo de agentes comercializadores de energia el´ectrica — retalhistas — assim como um outro con-junto de ofertas de venda de energia, proveniente de um grupo de produtores de eletricidade, de forma a dotar o mercado de uma competi¸c˜ao significativa, tanto do lado da procura como da oferta. Para cada um dos modelos, a primeira simula¸c˜ao de mercado contou com a partici-pa¸c˜ao de todos os agentes referidos — produtores e retalhistas — e de uma oferta de venda de energia adicional proposta por um novo agente produtor (produtor-teste). Os vinte e quatro pre¸cos relativos ao custo marginal de mercado, resultantes da simula¸c˜ao da primeira sess˜ao, foram ent˜ao utilizados como previs˜oes de pre¸cos do mercado pool do produtor-teste numa segunda sess˜ao de mercado, na qual as suas ofertas de venda de energia el´ectrica, decorrentes da sua atividade produtiva, foram sujeitas ao algoritmo de optimiza¸c˜ao a ser validado. Desta forma, a concordˆancia de valores referentes aos volumes de energia el´ectrica enviados para o mercado nas primeira e segunda sess˜oes pelo produtor-teste, permitiram atestar o funciona-mento dos algoritmos de optimiza¸c˜ao em estudo. De facto, os resultados dos testes realizados
erentes com os resultados que seriam esperados.
De forma a utilizar as novas ferramentas disponibilizadas pelo MAN-REM para a demon-stra¸c˜ao da susceptibilidade dos pre¸cos de mercado em bolsa `a variabilidade intr´ınseca `a pro-du¸c˜ao de energia el´ectrica de origem renov´avel, nomeadamente a partir do recurso e´olico, e dos seus reduzidos custos marginais, foi considerado outro caso de estudo. Deste modo, e utilizando o mesmo grupo de agentes retalhistas do exerc´ıcio anterior, foram considerados dois cen´arios antag´onicos no que respeita `as condi¸c˜oes atmosf´ericas para produ¸c˜ao renov´avel, tendo sido analisados os efeitos da maior ou menor contribui¸c˜ao de energia e´olica sobre o pre¸co marginal do mercado bolsista. Consequentemente, foi poss´ıvel verificar o efeito de re-du¸c˜ao substancial dos pre¸cos marginais do mercado bolsista nas situa¸c˜oes em que a produ¸c˜ao e´olica vari´avel apresenta valores m´edios hor´arios acima da m´edia, corroborando o pressuposto te´orico de que tecnologias com menores custos de produ¸c˜ao marginal contribuem para uma maior eficiˆencia deste mecanismo de comercializa¸c˜ao, n˜ao s´o atrav´es de uma redu¸c˜ao do custo da energia el´ectrica em mercado por substitui¸c˜ao de tecnologias mais dispendiosas, como tam-b´em de um aumento do bem-estar social por efeito da majora¸c˜ao do volume total de energia el´ectrica a ser efetivamente negociado e transacionado em mercado.
Palavras-chave: Optimiza¸c˜ao de Agendamento da Produ¸c˜ao | Gest˜ao de Portfolio | Mercado em Bolsa | Contratos Bilaterais | Sistemas Multi-agente.
Acknowledgments . . . iii
Abstract . . . vii
Resumo . . . ix
Table of Figures . . . xvi
Table of Tables . . . xvii
Acronyms . . . xix
Nomenclature . . . xxi
1 Introduction 1 1.1 Contextualisation and Motivation . . . 1
1.2 Objectives . . . 5
1.3 Structure . . . 6
2 Liberalised Electrical Energy Markets and Multi-Agent Market Simulators 7 2.1 Considerations on Market Competition and Regulation . . . 9
2.1.1 Traditional Market Structures . . . 9
2.2 Key Market Entities . . . 10
2.3 Trading Mechanisms . . . 12
2.3.1 Spot Market . . . 12
2.3.2 Bilateral Contracts Market . . . 16
2.3.3 Derivatives Market . . . 17
2.4 E↵ect of Renewables on the Electricity Spot Market . . . 18
2.5 The Iberian Electricity Market (MIBEL) . . . 22
2.5.1 Market Organisation . . . 23
2.5.2 Market Main Indicators . . . 24
2.6 Agents and Multi-Agent Systems . . . 27
2.6.1 Multi-Agent Simulators for Energy Markets . . . 29
3 Portfolio Optimisation and Self-Scheduling Models 33 3.1 Thermal Portfolio Model . . . 34
3.2 Thermal and Wind Portfolio Model . . . 36
3.3 Hydro and Wind Portfolio Model . . . 40
4 The Multi-agent Simulator MAN-REM: Initial and Extended Versions 45 4.1 The Initial Simulator . . . 45
4.1.1 Participants: Agents Menu . . . 47
4.1.2 Market Models: Markets Menu . . . 47
4.2 The Extended MAN-REM Simulator . . . 49
4.2.1 Portfolio Construction . . . 49
4.2.2 Scheduling Process . . . 54
5 Production Scheduling: Case Studies 61 5.1 Case Study I: Demonstration of the Optimisation Models . . . 62 5.2 Case Study II: E↵ect of High Levels of Renewable Variable Generation on Pool Market
Prices . . . 69
6 Conclusions and Further Developments 73
6.1 Further Developments . . . 74
Appendices 83
A Wind Power Turbine Models 85
B Case Study I 89
1.1 Evolution of regional electricity generation mixes under the 2DS [2] . . . 3
1.2 Evolution of coal prices in several maturities (Jan13 - Oct15) [5] . . . 4
1.3 Evolution of capacity factors of gas- and coal-fired power plants in Portugal (2000-2014) [6, 7] . . . 4
2.1 Typical supply and demand curves in a pool market session . . . 14
2.2 Pay-as-bid vs single-price systems in a pool market . . . 15
2.3 Annual wind power installation in the EU (2004-2014) [29] . . . 19
2.4 Medium wind production scenario (22thApril, 2013) [7, 38, 39] . . . 21
2.5 Low wind production scenario (8thDecember, 2013) [7, 38, 39] . . . 21
2.6 High wind production scenario (4thJanuary, 2014) [7, 38, 39] . . . 21
2.7 Day-ahead and intra-day market sessions [42] . . . 23
2.8 Implications of interconnection capacity on MIBEL’s price coupling (19Jan2013 - 25Jan2013) [5] . . . 26
2.9 Electricity generation in Portugal and Spain, by source (2004-2014) [6] . . . 27
2.10 Typical agent [50] . . . 29
3.1 Input and output data of the considered scheduling models . . . 34
3.2 Illustration of both series coupling and standalone operation for hydro reservoirs and units . . . 41
3.3 Performance curves for plant i and discretisation of curve 1 (Power vs Water Discharge) [63] . . . 42
4.1 MAN-REM simulator: home screen . . . 46
4.2 Window to create a new agent . . . 48
4.3 Add a new production agent: GenCo personal info window . . . 48
4.4 Pricing mechanisms window . . . 48
4.5 Add a new production agent: add portfolio window . . . 50
4.6 Adding a new production agent: preliminary information windows . . . 50
4.7 Adding a new production agent: add new thermal/hydro unit to GenCo windows . . . . 51
4.8 Adding a new production agent: add new wind unit to GenCo windows . . . 52
4.9 Scheduling a GenCo’s portfolio: add portfolio window (final) . . . 53
4.10 Adding a new production agent: set GenCo’s price forecasts window . . . 54
4.11 Scheduling a GenCo’s portfolio: choosing model window . . . 55
4.12 Scheduling a GenCo’s portfolio: set pre-sold energy volumes window . . . 56
4.13 Scheduling a GenCo’s portfolio: place pool bids windows . . . 57
4.14 Scheduling a GenCo’s portfolio: scheduling output window . . . 58
4.15 Over-the-counter contracts clearing tool . . . 59
5.4 Retailers’ power bids shares on the market . . . 64 5.5 Partial acceptance of the thermal producer’s (P 1T) bided electricity volumes . . . 65
5.6 Representativity of each generation technology composing the generation system . . . . 70 5.7 Day-ahead pool market clearing prices . . . 71 5.8 Hourly power generation by technology under a low wind speed scenario . . . 72 5.9 Hourly power generation by technology under a high wind speed scenario . . . 72
5.1 “Thermal Portfolio” model validation results . . . 66
5.2 “Thermal and Wind Portfolio” model validation results . . . 67
5.3 “Hydro and Wind Portfolio” model validation results . . . 68
5.4 GenCos’ portfolios composition . . . 70
A.1 Wind power turbine models . . . 87
B.1 Retailers’ market bids — Best Energy . . . 91
B.2 Retailers’ market bids — SCO Corporation . . . 92
B.3 Retailers’ market bids — Electro Center . . . 93
B.4 Retailers’ market bids — First Energy . . . 94
B.5 Producers’ market bids — P0 . . . 95
B.6 Producer’s day-ahead market bids — P2 . . . 96
B.7 Producer’s day-ahead market bids — P3 . . . 97
B.8 Producer’s day-ahead market bids — P4 . . . 98
C.1 Scenarios for low and high wind speed computed from the Portuguese national wind production [38] . . . 101
C.2 Output wind power generation volumes . . . 102
C.3 Thermal power plants’ general and technical specifications . . . 103
C.4 CO2 and N O2emission factors from fuel combustion for electricity generation . . . 103
C.5 CO2 and N O2emission factors from fuel combustion for electricity generation . . . 103
C.6 Hydro power plants’ reservoir characteristics . . . 104
C.7 Hydro power plants’ piecewise linearisation of performance curves . . . 104
C.8 Wind farms’ turbines models . . . 105
C.9 Generation’s fixed and variable costs . . . 105
ABMS Agent-based Modelling and Simulation
BC Bilateral Contracts
CAPEX Capital Expenditures
CCGT Combined Cycle Gas Turbine
CfD’s Contracts for Di↵erences
CHP Combined Heat and Power
CMVM Comiss˜ao do Mercado de Valores Mobili´arios
CNE Comis´ıon Nacional de Energ´ıa
CNMV Comis´ıon Nacional del Mercado de Valores
CO2 Carbon Dioxide
EDP Energias de Portugal
ERSE Entidade Reguladora dos Servi¸cos Energ´eticos
GenCo Generation Company
GHG Greenhouse Gases
GW Gigawatt
ISO Independent System Operator
LNEG Laborat´orio Nacional de Energia e Geologia
MAN-REM Multi-Agent Negotiation and Risk Management in Electricity Markets
MAS Multi-agent System
MCP Market Clearing Point
MIBEL Iberian Electricity Market
MMP Marginal Market Price
MO Market Operator
MW Megawatt
N O2 Nitrogen Dioxide
OMIE Operador del Mercado Ib´erico de Energ´ıa - Polo Espa˜nol OMIP Operador do Mercado Ib´erico de Energia - Polo Portuguˆes
OPEX Operational Expenditures
PC Performance Curves
PT Portugal
PV Photovoltaic
REE Red El´ectrica de Espa˜na
REN Redes Energ´eticas Nacionais
SP Spain
NT set of hours ranging the considered scheduling period NU T set of thermal units owned to the GenCo
NU H set of hydro units owned to the GenCo NU W set of wind units owned to the GenCo
L set of blocks for piecewise linearisation of the hydro units performance curve M conversion factor equal to 3.6· 10 3 [Hm3s/m3h]
d1t,k, d2t,k binary variables used for the discretisation of the performance curve of
hydro units
It,i binary variable equal to 1 if thermal unit i is online at time t It,k binary variable equal to 1 if hydro unit k is online at time t It,u binary variable equal to 1 if wind unit u is online at time t Pt,i energy produced by thermal units at time t [M W h] Pt,k energy produced by hydro units at time t [M W h] Pt,u energy produced by wind units at time t [M W h]
P 01k minimum power output of hydro unit k for performance curve 1 [M W ]
P 02k minimum power output of hydro unit k for performance curve 2 [M W ]
P 03k minimum power output of hydro unit k for performance curve 3 [M W ]
VSale
Bilateralt total energy sold through bilateral contracts at time t [M W h]
VBilateralP urchaset total energy bought through bilateral contracts at time t [M W h] VP oolt,i energy produced by thermal units at time t sold in the pool [M W h]
VP oolt,k energy produced by hydro units at time t sold in the pool [M W h]
VP oolt,u energy produced by wind units at time t sold in the pool [M W h]
SUi start-up costs for thermal units i [e] SUk start-up costs for hydro units k [e] SDi shut-down costs for thermal unit i [e]
ut,k water discharge of hydro unit k at time t [m3/s] ult,k water discharge of block i of hydro unit k at time t [m
3/s] Ulmax
k maximum water discharge of block l of hydro unit k [m
3/s] Ulmink minimum water discharge of block l of hydro unit k [m3/s]
k
Vkmax maximum content of the reservoir associated to hydro unit k [Hm3] V Lk lower level limit of the reservoir associated to hydro unit k [Hm3] V Uk upper level limit of the reservoir associated to hydro unit k [Hm3]
yt,i binary variable equal to 1 if thermal unit i is start-up at the beginning of time t
yt,k binary variable equal to 1 if hydro unit k is start-up at the beginning of time t
yt,k binary variable equal to 1 if hydro unit k is start-up at the beginning of time t
wlt,k binary variable equal to 1 if water discharged by hydro unit exceeded block
l
Wt,k hourly water inflow of the reservoir of hydro unit k at time t [Hm3/h] zt,i binary variable equal to 1 if thermal unit i is shut-down at the beginning
of time t
⇡P oolt forecasted market clearing price for the day-ahead market [e/MWh]
⇡BilateralSale t forecasted sale price of bilateral contracts at time t [e/MWh] ⇡P urchase
Bilateralt forecasted purchase price of bilateral contracts at time t [e/MWh]
⇢1lk slope of block l of the performance curve 1 of hydro unit k [M W/m
3/s] ⇢2lk slope of block l of the performance curve 2 of hydro unit k [M W/m
3/s] ⇢3lk slope of block l of the performance curve 3 of hydro unit k [M W/m
3/s] ⌧ time delay between consecutive hydro units [h]
1.1
Contextualisation and Motivation
The electricity sector presents itself as a strategic area for both the economy and the sovereignty of states, not only by its impact on services, but also by its importance on the daily life of companies, industries and households. Therefore, it is expected that the optimisation and improvement of efficiency in the sector result in a relieving of energy costs — a powerful contributor to the financial burden of almost all activities.
Electricity is mainly produced in large power plants, away from major centres of con-sumption, typically in suburban and industrial areas, due to technical and economic reasons, including availability of primary energy resources as well as infrastructural and environmental constraints. The electrical energy produced in large plants is delivered to the transmission system, consisting of high voltage power lines — the energy highways. Through transformers, power flows from high to medium and low voltage distribution networks, and then to con-sumers, the base of the electricity value chain.
Generation units vary with respect to size, production cost, technology, fuel, and the time required to respond to orders of dispatch (i.e., the time elapsed from the moment when the decision to generate electricity is taken and the moment when it is delivered to the grid). From the point of view of both market and grid operators, units with more flexibility and dispatch-ability represent higher value. Controlling such units o↵ers the opportunity to adapt production to instant consumption, maintaining equilibrium and ensuring the security of sup-ply [1].
Regional geopolitics, geographical barriers and the availability of natural resources are nat-ural shapers of the diversity and characteristics of electrical systems across the world. Given that, the recent modernisation of electricity generation fleets (and related infrastructures) into a renewables-based production towards a more sustainable power sector is often constrained by the same factors as well as by cost and technical suitability of solutions.
The global introduction of renewables for mass electricity production, which became all too apparent during the last twenty years, has embodied an attempt of countries to limit their CO2 emissions — and meet the targets defined and signed at the last Conference of the Par-ties, embodied in the United Nations Sustainable Development Goals — as well as their risk exposure to fuels price oscillations, which have proven significantly unstable due to several phenomena, such as armed conflicts, cartelisation, price manipulation and economic wars. Overall, this policy has led to an increased external independence of the primary energy’s importing countries, promoting greater safety of supply. However, these deep changes in the electrical systems, as they are being made, have also involved the rise of some consequent issues that might disturb the balance and operational status quo of the electrical sector.
Abreast renewables’ deployment, investment on cleaner fossil-based technologies is a key-alternative onto a more sustainable electricity system. As fossil fuels represented 65% of the world’s electricity mix in 2015, the deployment of cleaner electricity production technolo-gies assumes a clear and logical pathway towards the decarbonisation of the sector. IEA’s forecasted scenarios for climate change mitigation, released under the “Energy Technology Perspectives 2015” publication, stated that, under a 2-degrees scenario (2DS)1, in 2050, fos-sil fuels will still play an important role, accounting 20% of the overall produced electricity, whereas, considering a 6DS2, fossil fuels would remain stable and continue to lead as the main source of electric generation. However, despite the considerable importance that hy-drocarbons are expected to play, even in the 2DS, only 7% of the electricity produced by fossil-fuelled thermal plants is generated by facilities without carbon capture and storage — mainly gas-fired facilities with low capacity factors, running occasionally when renewables balancing is necessary, which would allow an average CO2 intensity of about 40 gCO2/kW h (533 gCO2/kW h in 2012). In order to achieve such ambitious goals, countries must start to act and pave the way with strategic plans to contain and reduce greenhouse emission gases. On the contrary, if a strong dependency on fossil fuels endures, leading to a 6DS, an average CO2 intensity of 480 gCO2/kW h will be the most probable scenario, a completely contrasting forecast when compared with what should be achieved to remain under the 2DS (see Figure 1.1).
1The 2-Degree Scenario (2DS) is the main focus of Energy Technology Perspectives. The 2DS lays out an
energy system deployment pathway and an emissions trajectory consistent with at least a 50% chance of limiting the average global temperature increase to 2 C. The 2DS limits the total remaining cumulative energy-related
CO2 emissions between 2015 and 2100 to 1 000 GtCO2. The 2DS reduces CO2 emissions (including emissions
from fuel combustion and process and feedstock emissions in industry) by almost 60% by 2050 (compared with 2013), with carbon emissions being projected to decline after 2050 until carbon neutrality is reached [2].
2The 6-Degree Scenario (6DS) is largely an extension of current trends. Primary energy demand and CO
2
emissions would grow by about 60% from 2013 to 2050, with about 1700 GtCO2 of cumulative emissions.
In the absence of e↵orts to stabilise the atmospheric concentration of greenhouse gases, the average global temperature rise above pre-industrial levels is projected to reach almost 5.5 C in the long term and almost 4 C by the end of this century [2].
Figure 1.1: Evolution of regional electricity generation mixes under the 2DS [2]
One of the main aspects of the undergoing global energy transition is the variable nature of the production of new CO2-free technologies that are currently in great expansion. De-spite the fact that significant deployment of technologies — such as wind and photovoltaic — has indeed the power to reduce greenhouse gases’ emissions (GHG), the uncertainty that characterises these energy sources, and hence their output, presents important and complex challenges to the grid.
The second aspect concerns the decentralised nature of low- and medium-power produc-tion facilities — small hydro, wind or solar photovoltaic — and their necessity to be often installed in remote areas where optimised production can be achieved. Consequently, both the scale and the scattered production raise significant challenges of interconnection to the grid, making them more suitable to be connected to distribution networks rather than to high-voltage lines [3].
The third aspect is related to the fugacity of market conditions: thermal-based electricity generation is very dependent on financial and commodities markets, since fuel prices are the main drivers which influence production costs. Therefore, dynamic prices of oil, gas or coal induce significant changes on the generation unit’s merit order. The current panorama of fuel prices, for instance, dictated by political and international relations, reveals an implosion of coal prices over the past few years (Figure 1.2). This sharp fall is mainly caused by the shale gas boom occurring intensively in the United States of America, where a significant share of the internally produced and once consumed coal has now to be drained out to other regions, ”flooding” the market. The e↵ects of excess of coal in the market are being felt in the Europe, as coal prices fell and remained significantly low during the last years. At the
Figure 1.2: Evolution of coal prices in several maturities (Jan13 - Oct15) [5]
Figure 1.3: Evolution of capacity factors of gas- and coal-fired power plants in Portugal (2000-2014) [6, 7]
same time, high regional prices of natural gas and geo-political conflicts whether in Eastern Europe, Middle East or Northern Africa, have increased doubts and reticence among gas mar-ket’s users, namely in the electricity production sector. Consequently, the pressure exerted by low coal prices and the absence of an efficient and strong carbon european market on other technologies, particularly gas, have yielded perverse e↵ects on the path towards the CO2-free electricity generation targets and the environmental sustainability of European countries [4]. In fact, capacity factors of gas-fired power plants have been decreasing over the last few years due to the growing installed capacity and decreasing generation shares. On the contrary, the coal-fired capacity has seen its capacity factors rising (Figure 1.3). This reality results in significant setbacks in terms of sustainability policies, a↵ecting, most of all, the environment and threatening the achievement of climate change mitigation goals, by increasing electricity’s CO2 intensity.
All the mentioned conditions — price variation of primary energy sources, intermittent production of most of the newly added (renewable) installed capacity and scattered generation — are just some of the contributors which justify the development of computational systems that allow specialists to study the dynamic of markets and allow market participants to foresee and plan their actions in advance. Such tools, often called “market simulators”, can be part of the necessary decision-taking process for the technical governance of utilities. Additionally, and among others, these software tools provide invaluable support to study the impact that di↵erent technologies, such as Carbon Capture and Storage (CCS), battery storage banks or pumping storage, may have on the market, being a source of knowledge on the behaviour of marginal costs, generation units’ merit order and electricity market-clearing prices.
By using accurate self-scheduling models, producers are provided with invaluable help to manage their unit portfolios in order to achieve their goals — profit maximisation, costs min-imisation or others. At the same time, market simulators constitute an important platform for researchers who try to adapt market rules, processes, and policies to a non-static reality. Simulations, generally developed under multi-agent systems (MAS), provide an approxima-tion to “real” decisions, and can be important to all market participants.
1.2
Objectives
The main objectives of this thesis are as follows3:
1. Study the existing models for electrical energy generation, namely those who seek a proper market settlement towards the maximisation of profit;
2. Study the main energy markets, particularly the day-ahead market and the bilateral contracts market;
3. Study the multi-agent simulator “MAN-REM”, which permits market participants to enrol in energy transactions, negotiate bilateral agreements [8, 9], colligate with each other [10], and manage the active role of consumers [11, 12];
4. Adopt some of the self-scheduling models referred in (1) and expand the existing version of MAN-REM by developing and implementing computational agents which simulate electrical energy producers, and whose operations are particularly based on those models; 5. Expand MAN-REM by adding market simulation functions for very-short
over-the-counter bilateral contracts clearing;
3This work was performed under the project MAN-REM (FCOMP-01-0124-FEDER-020397), supported by
both FEDER and National funds through the program “COMPETE–Programa Operacional Tem´atico Factores
6. Develop a case study to demonstrate the functioning of the self-scheduling models added to the MAN-REM;
7. Develop a case study regarding the trading of high renewable electricity levels on the wholesale market and evaluate its impact on the day-ahead market prices;
1.3
Structure
This dissertation is divided into six chapters: Introduction, Liberalised Electrical Energy Mar-kets and Multi-Agent Systems, Portfolio Optimisation and Self-Scheduling Models, MAN-REM Extension, Production Scheduling - Case Studies and Conclusion. In the first chapter, one can find a short introduction and contextualisation of this work as well as its main objectives and the structure of this document.
The second chapter is entirely dedicated to a concise explanation of a broad range of topics that were considered relevant to this work. Platforms for electricity trading, most common maturity periods for its transaction, principal market agents and a summary of the Iberian electricity market (MIBEL) regarding its composition, operation and challenges due to the deployment of variable clean electricity generation technologies are also addressed.
The third chapter presents a selection of three optimisation models, developed for genera-tion companies to self-schedule their producgenera-tion. The models will be added to the pre-existing MAN-REM simulation software, increasing its features.
The fourth chapter presents an exhaustive description of the developments made to the MAN-REM simulator, including all the JAVA-programmed windows, which constitute the new interface, built to allow an user-friendly use of the software and its inherent markets.
The fifth chapter presents two case studies. The first is meant to demonstrate and analyse the new features of the MAN-REM simulator by testing its response to several input data, and the second to demonstrate (through a market simulation) the e↵ect of high levels of variable renewable penetration on the day-ahead electricity pool market prices.
Finally, conclusions arising from this study and suggestions for further work developments and improvements to the MAN-REM software, regarding the simulation of electricity trading under a liberalised electricity market, are present in the sixth chapter.
Multi-Agent Market Simulators
Since the early times of the electricity sector, scale economies and transaction cost savings achieved with vertical integrations favoured the emergence and establishment of natural mo-nopolies. This sector was therefore controlled by single public or private companies, properly regulated — since the 1980’s — by state agencies [13]. In Portugal, as in many other countries, the four key-business components of the electricity sector (generation, transmission, distribu-tion and retail) were owned by the same monopolist firm: Energias de Portugal (EDP).
Traditionally, power plants were run according to central dispatch directives which en-sured the stability of the system. Regulated prices or tari↵s have generally failed to signal real generation costs, aiming above all, maximising social welfare and limiting the power held by monopolists in the market, but disregarding the fundamental efficiency and sustainability of the industry and the correct remuneration of all interveners [14, 15].
The Electricity Pool of England and Wales appeared in 1990 as a first glance over the coming reforms that started to occur across Europe and in the United States of America. To replace the existing system, the British government designed a wholesale market, where all generation companies could sell their output on the same terms [16]. Besides the maintenance of the technical stability of the electric system, such solution also aimed the achievement of a mandatory remuneration for the produced and consumed energy. Additionally, British au-thorities wanted to help participants to schedule their market positions by setting conditions to get more stable prices.
In fact, this decision has e↵ectively led to significant competition in both generation and supply sides, which was clearly demonstrated by a fall of the electricity prices to consumers of above thirty percent [16]. As a result of this reformulation, the British model for the electricity sector was followed in many other countries, and the pool platform became a symbol of the liberalised market.
In 1996, the European Commission approved the first European Directive [17] for the energy sector, embodying the will to liberalise its activities under the light of the above prin-ciples. The Directive 96/92/EC has broaden the access conditions to networks and solved the issue of determining the cost of transmission infrastructures. Standardised rules were also set for production, transmission and distribution. The spirit of competition ensured that con-sumers would be free to choose their electricity supplier and that new capacity should only be allocated through authorisation or be awarded by tender [18].
The challenges posed by the liberalisation of the electricity sector are usually convergent: to abolish barriers and dismantle old monopolies, design a new architecture for the sector’s organisation and improve the allocation of resources to achieve an optimum, mainly comprised of financial sustainability, improved social welfare and market efficiency.
In this sector, the principle of dismantling vertically integrated activities into di↵erent and independent segments of the value chain emphasises three key-measures: decoupling activities (unbundling), stimulating access to the grid by third-parties, and the creation of independent regulatory authorities [18]. We should be aware that the switchover from regulated monopo-lies to competitive markets, in which consumers have the possibility to choose their supplier freely, does not mean only the increase of the number of operators [13]. Under this scenario, the risk for producers increases (theoretically) but, at the same time, they get greater freedom to establish their own strategies in order to maximise profits, taking into account, of course, the behaviours of their competitors [13].
During the late 90’s, there was the conviction that developing a Single European Energy Market would be a no easy task, given the wide variety of existing solutions in the Member States and their variety of liberalisation degrees. Furthermore, the European geography also presents specificities that do not facilitate the interconnection of networks: it consists of a cen-tral core — France, Germany and Benelux — and peripheral regions — the UK and Ireland, Scandinavia, the Italian Peninsula and the Iberian Peninsula. Weighted these constraints, it seemed preferable to draw on the experiences of existing or arising regional markets and then, from that point, start to build the Single European Energy Market. As a consequence of such plan, the Portuguese Government proposed to the Spanish Government, in 2000, the creation of a new regional electricity market, the MIBEL [18].
2.1
Considerations on Market Competition and Regulation
Energy markets, as many others, are independently regulated. Thereby, regulators are re-sponsible for defining prices and tari↵s that rule transactions between producers, retailers and consumers. As a matter of fact, regulation entities may also act as supervisors, ensuring that all actors comply to the existing rules, and punishing them otherwise. Traditionally, state-regulated activities intent one of the following main purposes: intervention towards a more efficient market or promotion of a maximised social welfare through greater equity, sol-idarity between individuals and regions, as well as guaranteeing basic social needs [19].The relationship between cost and product valuation, made by consumers, is essential to understand and evaluate the level of efficiency of a market. Hence, the pure seeking of efficiency by gradually lowering the production cost of an asset is not the only condition to achieve e↵ective efficient market conditions. In every single liberalised activity, the value of a good or service is defined by the price consumers are willing to pay in order to adquire it. As a consequence, the true value of an asset is dictated by the price paid for the last consumed unit. This definition leads to the essence of the concept “market efficiency”, which states that a truly efficient market is attained when consumers valuation of a good is equal to the exact cost at which the producer incurs to produce it — often known as marginal production cost [19].
2.1.1 Traditional Market Structures
Monopoly
For a long time, the electricity sector was ruled as a monopoly due to the idea that, despite the absence of competition, it was the most efficient operational market regime. Electricity companies were vertically integrated, from production to retail. Some of them can still be found across Europe, operating now in liberalised markets as former-monopolist companies: EDP (Portugal), Enel (Italy), or EDF (France). A classic monopoly situation is achieved when a market is composed by a single producer or a restricted group of producers acting as a cartel. Such absence of real competition among producers was often regulated by an independent agency in order to limit their market power over consumers and to guarantee access to the population.
Oligopoly
An oligopolistic market is broadly defined as a restricted number of producers who are re-sponsible for providing a certain good or service. Due to this limited range of service/good providing companies, some of them hold significant influence on the market, which gives them
the power to continuously influence prices. Consequently, competition is mainly punctuated by interaction strategies, not only with consumers, but most often with producers. This market framework has been deeply studied since the nineteenth century and often modelled by well known models such as Cournot’s or Bertand’s. The exercise of profit maximisation made by producers operating in oligopolist markets gets more complex than that made by monopolist companies. In fact, most of the times, the equilibrium situation for an oligopolist market often results in lower prices [3, 20].
Perfect Competition
In order to exhibit characteristics of perfect competition, a market must guarantee one major requirement: the existence of a range of both producers and consumers large enough to as-sure that none of the market participants hold sufficient market power to influence prices and quantities. This particular model also implies a perfect efficient market, where marginal pro-duction costs equal the price consumers are willing to pay, whereas in the long-run, marginal costs should equal minimum average production costs. Following the above premises, it is clear that a producer, in a perfectly competitive market, produces the exact quantity of a good/service socially accepted, and thus, that consumers can absorb. Additionally, if long-run convergence is achieved, producers are actually operating with minimum possible costs, avoiding unnecessary waste and use of scarce resources.
2.2
Key Market Entities
The electricity market is comprised of several key entities who ensure that households, in-dustry and services receive a proper electricity delivery service with considerable safety and reliability:
Generation Companies (GenCos) are responsible for producing electrical energy and sell it through the variety of trading mechanisms at their disposal. They can also provide a range of ancillary services to the System Operator, helping this entitiy to maintain the electrical balance of the grid, and consequently the security of the system. GenCos can also participate in the market by buying energy to their competitors, whether for immediate delivery or to cover eventual imbalance risks. Each company can own a single power plant or a portfolio of producing units that, depending on the dimension, may provide the producer considerable power to influence the market.
Transmission Companies are responsible for the operation, maintenance and development of transmission lines, transformers and reactive compensation devices. Transmission
compa-nies often play the role of the Transmission System Operator. They are, by nature, the last stronghold of former monopolies, due to the enormous costs inherent to the construction of a transmission grid.
Distribution Companies own and are responsible for the operation of the distribution net-work. Due to technical and financial constraints, and even in partially liberalised systems, the distribution sector is hardly subject to competition. Such constraints are naturally related to the need of having a physical grid for each competitor, which would greatly increase costs.
Retailers are entities responsible for the resale of the electricity bought from producers in the wholesale market. Since they are non-supervisor actors who do not need to own physical infrastructures to operate, retailers have proliferated in liberalised systems. These entities buy electricity from generation companies and use — and pay a tax for — both transmission and distribution lines in order to supply small customers, ‘’located” at the end of the chain.
Consumers are commonly categorised according to their level of consumption. Small con-sumers include domestic concon-sumers and small companies which means they do not possess enough power to influence the market. Consumers in liberalised markets are free to choose the retail company to whom they agree to buy electricity. On the other hand, large consumers, due to their dimension and consumption volumes, can operate in the wholesale market and buy electricity directly to generation companies. In general, large consumers represent large industrial facilities that may be directly connected to the transmission network.
The Regulator is most commonly embodied by a government agency, responsible for en-suring the efficiency and transparency of all operations that occur within the sector.
The Transmission System Operator (TSO) is an independent actor responsible for run-ning the last resort market and balancing demand and supply in real-time towards a secure electrical system.
The Market Operator (MO) is responsible for managing both sale and purchase bids, matching them and guaranteeing the proper course of all trading processes. However, for -short and very-short horizon transactions, the Independent System Operator assumes the leading role.
2.3
Trading Mechanisms
Distinct and simultaneous forms of power trading are common in deregulated markets, en-suring a proper technical and economical operation of the electrical sector. Power producers can bid in the spot market and/or engage in derivative contracts with buyers, setting a le-gal contractual bond for future transactions. Generally, both methods may be adopted by power producers to maximize their profits using the available market information. Consider-ing the features of deregulated markets, it is essential that power producers develop generation scheduling techniques and procedures that consider the technical characteristics of the power plants’ portfolio, operation limits, production costs, maintenance costs and market behaviours (e.g., electricity prices) to maximise their benefits [1, 21].
2.3.1 Spot Market
The spot market is defined by its immediacy, where sellers supply goods and buyers pay for them with no reversibility of deals. As this market operates on a short-term horizon, both buyers and sellers are able to adquire and o↵er the exact amount of goods they need or have available, respectively. Hereupon, scarcity of goods or sudden demand increase are rapidly mirrored by higher spot prices, enhancing the considerable volatility of prices and quantities. On the contrary, a rise of the ratio supply/demand will therefore lead to a fall of prices [22]. As discussed in [15], these interactions ultimately lead to an equilibrium set by prices or, in other words, meeting supply and demand results in the transacted amount of a good and its price.
Ideally, electricity spot markets should operate based on forecasts of both demand and supply, where retailers — representing medium and small consumers — and large consumers estimate their consumption for a given period in order to place their purchase bids. Likewise, producers are responsible for setting their sale o↵ers in order to fulfil a forecasted rate of con-sumption, having always in mind its profit, mostly related to production costs. In fact, such deterministic approach to the market cannot be applied, particularly in electricity trading. Generation units obviously su↵er form sudden failures, technical problems, maintenances or other type of events that might originate unavailabilities. The same constraints are appli-cable to transmission lines that connect the electricity generation level to the grid and all the downstream infrastructures. Additionally, the fast deployment of intermittent electricity production technologies with inaccurate forecasts regarding their production output exacer-bates even more this problem. Consequently, and because demand is also hardly accurately predictable, the rendering of a proper balance is specially hampered by limited and expensive storage capacity of potencial energy in water reservoirs, batteries or through high-rampage
generation technologies, such as CCGT systems or more modern and flexible coal-fired power plants [23].
Pool Market
The pool platform is a representative cornerstone of the liberalised electricity market philos-ophy. The creation of this trading mechanism envisioned the establishment of a transparent, efficient, flexible and competitive wholesale market that could provide guarantees to produc-ers, retailers and consumers. Although pool markets are very unusually adopted as trading mechanisms in commodity markets, they are very well established in electricity systems. One of the main features of a pool platform is the absence of a negotiation process between two (or more) parties and, therefore, the transaction process occurs with absolutely no reliance on iterative attempts to reach an agreement. Despite some circunstancial di↵erences that may be verified from one market to another, pool sessions usually follow the following procedures: 1. Generation companies submit selling bids for a certain amount of electrical energy at a
certain price;
2. Similarly, large consumers and retailers submit purchase orders, specifying both quan-tities and prices they are willing to pay for each energy unit.
3. The market operator ranks both purchase and sale bids in order to get a purchasing-price crescent curve and a selling-price decrescent curve, respectively (see Figure 2.1). 4. The intersection point of the two curves is computed by the market operator and
re-sults in the “market clearing point” (MCP), whose coordinates represent the “market marginal price” (MMP) and the total tradable energy volume. Therefore, the market operator accepts all generators’ o↵ers which are bellow the MMP [24] and, consequently, all GenCos located on the left side of the market clearing point see their production of-fers accepted and are required to supply the proposed volumes of electricity. For the sake of classification, o↵ers to the market whose price is bellow the MMP are “in merit”. Producers whose o↵erings are on the right side of the intersection — “out of merit” — will be excluded for the respective market’s spanning period.
From this point on, several versions of a pool auction may be found, depending on the specific electricity market configuration. With regard to the o↵ered prices by each generation entity, two main variations may be encountered: in a price-based auction, generators can bid at any price they find appropriated, whereas in a cost-based auction, prices should reflect the inherent marginal costs of each particular unit. Similarly, a pool can also be di↵erentiated
Figure 2.1: Typical supply and demand curves in a pool market session
by its initial operating assumptions and be referred to as sided or two-sided : in a one-sided auction, the demand level is predicted by the market operator, based on the theoretical concept of market inelasticity and historical records, and hence all o↵ers from producers are cleared against this demand assumption, with no input contribution from buyers. On the contrary, in a two-sided auction, the market operator’s dispatch is based on both buyer’s de-manded quantity and the supply o↵ered by sellers.
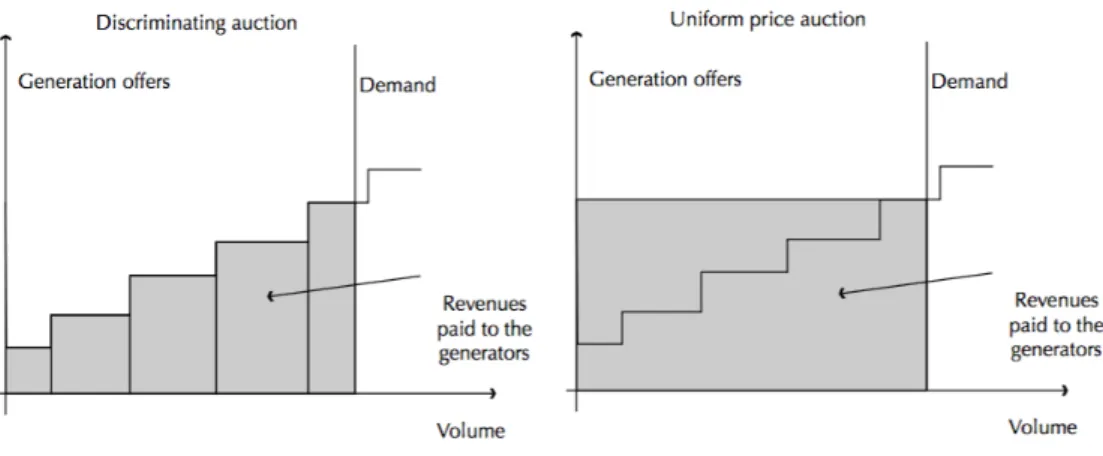
Finally, a pool platform can also operate according to two opposed remuneration philoso-phies (Figure 2.2): in a single-price auction, “in merit” participants (buyers and sellers) pay and are paid in accordance to the resulting market marginal price, whereas in a pay-as-bid auction, “in merit” generators are paid the exact price they had individually submitted to the market operator.
Both trading models have strengths and weaknesses. In pay-as-bid auctions, certain be-haviours are more likely to occur in order to influence the MMP (upwardly). A classic situation is observed when a generator who owns a power plant with a given marginal cost, knowing that the forecasted MMP for the next auction is significantly higher than his marginal production costs, bids at a selling price substantially above his marginal cost, having nearly the same chances of getting his o↵er accepted. As discussed in [15], a pay-as-bid scheme is often not adopted because it discourages generators from placing o↵ers that reflect their marginal costs. GenCos would then try to guess the forthcoming MMP and would bid at that level of prices, attempting to maximise their revenues. Also, in a pay-as-bid situation, the absence of a single price to rule the purchase of an asset assumes a critical dimension when a price indicator is needed whether for statistical ends or as a benchmark for setting bilateral contracts [1].
Figure 2.2: Pay-as-bid vs single-price systems in a pool market
Ancillaries Market
As already discussed, the balance of the electrical system is of capital importance. Therefore, in order to maintain the integrity of the system without compromising the electricity supply, the transmission system operator (TSO) controls a set of balancing tools, which are gener-ally categorised according to their timescale e↵ectiveness. Spot markets usugener-ally comprise one daily market — day-ahead — where participants bid their purchase and sale o↵ers for the next twenty-four hours. A smoother maintenance of this balance is achieved, over the day, by the intraday market, thats aims to harmonise some natural fluctuations, allowing both producers and consumers to adjust their positions.
Although minor momentaneous imbalances do not represent a major security issue, they must be promptly detected and corrected, since frequency variations tend to weaken the sys-tem, making it much less resilient to further technical complications that may occur, harming its stability.
Such adjustments require the existence of a bench of backup units which can be “called” to perform corrective actions on production. This reserve is often subdivided into “spinning reserve” and “non-spinning reserve”. Spinning reserve is distinguished by its quick response, which may vary up to ten minutes, and is fundamentally oriented for frequency services — meant for constant frequency regulation. Therefore, and because of the haste these correc-tions require, such generation facilities are commonly equipped with a governor system which allows a direct and automated control of its power output by the ISO. On the other hand, the non-spinning reserve consists of production units with lower response rates — up to sixty minutes — and are specially designed to handle slower (but usually larger) fluctuations, par-ticularly during intra-period oscillations — the following services.
2.3.2 Bilateral Contracts Market
Bilateral trading constitutes a mechanism for energy transactions where two parties negotiate and get an agreement without the intervention of third-parties. In transactions via bilateral contracts, almost all conditions — including price, time of delivery and energy volumes — are dependent of the goals and concession tolerance of each intervenient in the negotiation. Customised long-term bilateral contracts are flexible and negotiated privately to meet the needs of both parties. They usually involve the sale of large amounts of power over long periods of time due to large transaction costs associated with the negotiation of such contracts, making them worthwhile only when the parties want to buy or sell large amounts of energy. On the other hand, short-term bilateral contracts, celebrated within a short maturity horizon, are classified as spot market operations and usually adopt one of the following concepts:
• Trading ’Over-the-Counter’ is a mechanism specially designed for the necessary adjust-ments to eventual assumed positions through long-term agreeadjust-ments. Producers and consumers can perform corrective actions to their previous perspectives for a given pe-riod, towards an equilibrium between demand and supply. The nature of this market makes it a low-volume energy transactions’ mechanism.
• Electronic Trading is an electronic platform where buyers and sellers can send their o↵ers to the market. Typically, each bid comprises four main features: order (purchase or sale), period of delivery, energy amount and energy price. When a participant sends an o↵er to this computerised platform, the system seeks for other submitted o↵ers that may be matchable with it. If the matching happens to be impossible, the o↵er is added to a queue list, waiting for further o↵ers that may clear it. The electronic trading is commonly used for fine-tuning of the participants positions, some minutes before the market closure.
Bilateral contracts evolved and greatly expanded over recent years. The MIBEL, as well as other electricity markets, is an example of the increasing relevance that bilateral contracts have to market participants. Besides the main goal of risk-reduction, BC present also some positive collateral e↵ects [25], as providing greater stability in spot markets, and the curtail-ment of potential market power situations and reduction of demand fluctuations. Although pool markets and BC are distinct mechanisms of trading, they are naturally related and can be used to take advantage from price variations and market speculation, providing an extra source of income. Energy bought in the pool market can satisfy the bilateral deals assumed by the producer, if such prices prove to be lower than the inherent marginal costs for energy production. Similarly, if a producer holds a position benefiting from bilaterally contracted power, he might find it financially beneficial to resell part of this power in the pool, aiming at obtaining a significant profit [25].
2.3.3 Derivatives Market
The mitigation of possible harmful e↵ects from sudden changes in market conditions has led to the appearance of derivative products, which induce more predictability and reduce risk exposure. These instruments are most commonly found as legal private transaction contracts establishing agreed quantities and negotiated prices for a certain asset. In fact, some of these contracts can be highly complex, to a point that contracted quantities and prices may vary hourly or according to existing intraday tari↵s [26].
The market transactions can be physical or purely financial. On one hand, financial trans-actions are cash-settled, with the cashflows calculated through formulas referencing energy prices established in di↵erent markets (and possibly other prices and variables). On the other hand, physical transactions require the delivery of physical electricity, for instance spot trans-actions are, by definition, physical transtrans-actions. These transtrans-actions are often structured using the templates developed for the financial markets, including swaps and options [1]. Some of the most vulgar derivatives mechanisms are presented and briefly explained below:
• Forward contracts are one of the simplest derivative mechanisms and involve agreements on energy volumes and prices, for future transaction events, on previously scheduled de-livery dates. Further details are also usually safeguarded, such as energy quality and penalties for default. Therefore, this tool allows two parties to set an agreed price of a given volume of energy, capping eventual losses which may occur in future pool market sessions, if the evolution is not favourable. For instance, if a buyer is trying to prevent the e↵ects of an eventual price escalade, he might be willing to pay a higher amount than the current energy price in order to reduce his exposure to price variations. This di↵erence between the expected pool price and the contracted price is often called the “premium”, and reflects the price producers are willing to pay in order to have pre-dictable and controlled selling prices over a given period of time. When contracts are signed, buyers assume a “long position”, while sellers take on a “short position” [15, 27].
• Options contracts can be materialised as “call options” or “put options”. A call option defines the allocation of a buying right of a certain asset at a certain price (strike-price) to its holder, whereas the owners of a put option detain the legal right to sell their asset according to the conditions stated on the contract [27]. Contracts can be designed considering a single-day execution date (“European options”) or over a ranging period with a given expiration date (maturity) (“American options”).
• Future contracts assume themselves, in the energy market landscape, as an opportunity for non-energy firms to take advantage from the considerable volatility of prices in en-ergy markets. Future contracts do not carry any physical delivery of enen-ergy associated and, therefore, contribute only for market speculation. Accordingly, speculators buy and sell “paper energy”, trying to profit with future price oscillations that may occur before reaching the maturity expiration date. Since some of the participants enrolled in futures are neither consumers nor producers, as the date of delivery approaches, contract holders have to balance their position in the physical market (either buying or selling).
• Contracts for Di↵erences ( CfD’s) are purely financial-driven contracts, not involving any physical transaction of electrical energy, and used to mitigate the exposure to price variations. The two subscribers of a CfD agree upon a strike-price for the thereafter traded energy. Consequently, both parts have the legal right to be compensated by each other whenever they sell/buy energy at a lower/higher price than the agreed strike-price [28].
2.4
E↵ect of Renewables on the Electricity Spot Market
Currently, at a time when the penetration of renewable energy technologies is already ex-tremely relevant in many countries (see Figure 2.3), another phenomenon arising from the mass production of “non-conventional” intermittent electricity has undergone a deep study and some discussion: the influence that non-dispatchable technologies — wind and solar in particular — have on electricity market prices [29, 30].
In pool markets, as explained in detail in Section 2.3, market operators aggregate pur-chase and sale o↵ers, previously submitted by buyers and sellers, sorting them according to a meritocratic hierarchy which sets the price and amount of the electricity traded. From the time when this mechanism was primordially designed, in the early 1990’s, until now, reality has being severely changing due to renewables deployment [31].
At the origin of these changes is the sorting logic of production units: based on operational expenditures (OPEX) — very dependent on the cost of fuels and susceptible to rapid changes in extraordinarily limited time periods. Thus, marginal costs of fuel-fired power plants are closely related to the price of commodities in the market, being possible to establish a link between the evolution of the plants’ operating costs and the price of fuels.
Figure 2.3: Annual wind power installation in the EU (2004-2014) [29]
Contrary, costs from photovoltaic or wind technologies are mainly influenced by capital expenditures (CAPEX), due to the large initial investments needed for construction and lim-ited capacity factors. Given that, the OPEX of wind projects can be considered a minor cost in comparison to its CAPEX, particularly due to “free fuel” [32].
The combination of this bidding selection process with the fact that the marginal costs of wind or PV generation are considerably lower, led — over the years — to a change of the tradi-tional shape of the supply curve. Despite frequent assumptions of null marginal costs for wind power production, it is essencial to account operation and maintenance variable costs (O&M) which include predictive maintenance — activities performed on equipments expected to fail soon, typically based on the results of condition based monitoring — and corrective mainte-nance — performed to repair equipments that are damaged or underperforming. Depending on the literature and also on the specific characteristics of each electric grid, estimations of marginal costs may vary considerably [33, 34], being estimated to range up to 12 e/MWh. Moreover, costs arising from the integration of this type of technology into the electricity system were also considered and comprise [35]:
• Additional system reserve costs:
– Additional requirements for instantaneous and frequency keeping reserves; – Additional requirements for scheduling reserve;
• Additional system generation capacity costs;
• Transmission constraints and reinforcement costs driven by wind power. Hence, total wind power marginal costs were estimated below 14 e/MWh.
Through the following historical data records of three “characteristic days”, one can in-stinctively understand the referred e↵ect of wind production in MIBEL pool prices: the 22thApril, 2013 — medium wind production (P
av= 1 483 MW) —, the 8thDecember, 2013 — low wind production (Pav = 64 MW) — and the 4thJanuary, 2014 — high wind production (Pav = 2 950 MW).
Figure 2.4 illustrates a medium wind production day with an average hourly output of 1 483 MW, whereas Figure 2.5 illustrates a low wind-based electricity generation characteristic day with an average hourly output of sixty-four megawatt, and Figure 2.6 depicts a high wind production day with an average output of 2 950 MW — corresponding to capacity factors of about 1.3%, 32.0% and 65.0% of the Portuguese installed capacity, respectively [7].
By analysing Figures 2.4, 2.5 and 2.6, it turns easier to understand the subjacent e↵ect of high wind production — whose marginal costs are below of any other traditional technology. High wind production, here represented by Figure 2.6, causes a shift of the traditional capacity to the right-side of the MCP (assuming an electricity market where demand is approximately inelastic). Examining the changes induced by the introduction of wind production, a major e↵ect is easily distinguishable: a decline of the marginal market price. This e↵ect is often known as “merit of order e↵ect” [36].
By comparing both annual maximum and minimum wind generation days, the correlation between wind production and pool prices is even more evident: while on the 8th December, with very low wind production output, hourly prices in MIBEL ranged from 83.4 e/MWh to 111.0 e/MWh, on the 4th January, the high production output from wind farms led to extremely low pool prices in the Iberian market, ranging from 0.0 e/MWh to 19.0 e/MWh. An intermediate case, represented by the case of 22th of April, shows an average production situation where the outcoming prices were around 25.0 e/MWh.
Through this example (not necessarily simplistic), it can be concluded that wind power contributes for considerable energy cost savings. Therefore, it follows that a substantial pres-ence of wind technologies in the market may lead to increased overall efficiency of the pool mechanism, resulting in a significantly lower MMP [36, 37].
Figure 2.4: Medium wind production scenario (22thApril, 2013) [7, 38, 39]
Figure 2.5: Low wind production scenario (8thDecember, 2013) [7, 38, 39]
However, despite going beyond the scope of this work, it should be emphasised that this economy — due to lower pool prices — may not be a net gain for consumers and, hence, it should be holistically analysed. Some studies were carried out on this matter with the intention of finding out whether there is a net benefit from the socio-economical optimisation perspective arising from high penetration of wind power, being many of them contradictory. In a study, Azofra et al. [40] essentially focus on the Spanish electricity generation system, and conclude that, despite the feed-in tari↵s guaranteed to renewable energy producers — indirectly supported by consumers — the significant reduction of the market marginal price results in significant savings for consumers.
On the other hand, Mulder et al. [41] focused on the Dutch electricity market and con-cluded that the reduction of the electricity retail price is not necessarily an evidence, since a clear gain for the consumers cannot be admitted. However, this study admits the possibility that the low preponderance of renewable technologies in the Dutch electrical production sys-tem might be the cause of such ine↵ectiveness.
2.5
The Iberian Electricity Market (MIBEL)
The Iberian Electricity Market (MIBEL) results from the cooperation of the Portuguese and Spanish Governments, aiming to promote a better integration of both countries’ electrical systems. Its significant contribution for the establishment of an integrated electricity market, not only at the Iberian level but, also at the European scale, is an important step to take on the pathway towards the envisioned “energy union” [42].
This market was fully launched on 1stJuly 2007 and is subdivided into two main poles: the OMIE — from the Spanish side — and the OMIP — from the Portuguese side. Despite the fact that MIBEL is an unified electricity market, the OMIE takes responsibility for the spot market clearance, whereas the OMIP ensures the management of the bilateral agreements, including forwards, futures and options.
The joint regulation of the Iberian electricity market is operated by “ERSE - Entidade Reguladora dos Servi¸cos Energ´eticos” and “CMVM - Comiss˜ao do Mercado de Valores Mobil-i´arios”, in Portugal, and by “CNE - Comisi´on Nacional de Energ´ıa” and “CNMV - Comisi´on Nacional del Mercado de Valores” in Spain.
Regarding the transmission industry, the Iberian market is composed by two major com-panies, the “REN - Rede El´ectrica Nacional” and the “REE - Red El´ectrica de Espan˜a”, which
![Figure 1.1: Evolution of regional electricity generation mixes under the 2DS [2]](https://thumb-eu.123doks.com/thumbv2/123dok_br/19202735.954497/25.892.176.735.159.402/figure-evolution-regional-electricity-generation-mixes-ds.webp)
![Figure 1.3: Evolution of capacity factors of gas- and coal-fired power plants in Portugal (2000-2014) [6, 7]](https://thumb-eu.123doks.com/thumbv2/123dok_br/19202735.954497/26.892.142.742.477.688/figure-evolution-capacity-factors-fired-power-plants-portugal.webp)

![Figure 2.3: Annual wind power installation in the EU (2004-2014) [29]](https://thumb-eu.123doks.com/thumbv2/123dok_br/19202735.954497/41.892.148.770.157.393/figure-annual-wind-power-installation-eu.webp)
![Figure 2.4: Medium wind production scenario (22 th April, 2013) [7, 38, 39]](https://thumb-eu.123doks.com/thumbv2/123dok_br/19202735.954497/43.892.153.761.151.395/figure-medium-wind-production-scenario-th-april.webp)
![Figure 2.8: Implications of interconnection capacity on MIBEL’s price coupling (19Jan2013 - 25Jan2013) [5]](https://thumb-eu.123doks.com/thumbv2/123dok_br/19202735.954497/48.892.149.728.152.402/figure-implications-interconnection-capacity-mibel-price-coupling-jan.webp)
![Figure 2.9: Electricity generation in Portugal and Spain, by source (2004-2014) [6]](https://thumb-eu.123doks.com/thumbv2/123dok_br/19202735.954497/49.892.149.744.164.522/figure-electricity-generation-portugal-spain-source.webp)
![Figure 3.3: Performance curves for plant i and discretisation of curve 1 (Power vs Water Discharge) [63] v t,k V L k [d 1 t,k d 2 t,k ] + V U k ⇥ d 2 t,k , 8 t 2 N T , 8 k 2 N U H v t,k V k max ⇥ d 2 t,k + V L k [1 d 1 t,k ] + V U k [d 1 t,k d 2 t,k ], 8](https://thumb-eu.123doks.com/thumbv2/123dok_br/19202735.954497/64.892.158.721.159.352/figure-performance-curves-plant-discretisation-power-water-discharge.webp)