F
ACULDADE DE
C
IÊNCIAS
D
EPARTAMENTO DE
B
IOLOGIA
V
EGETAL
D
IVERSITY OF AEROBIC ANOXYGENIC PHOTOTROPHIC
BACTERIA IN MICROPHYTOBENTHIC BIOFILMS FROM
TAGUS ESTUARY
Maria Inês Dias Cardoso
D
ISSERTAÇÃO
M
ESTRADO EM
M
ICROBIOLOGIA
A
PLICADA
F
ACULDADE DE
C
IÊNCIAS
D
EPARTAMENTO DE
B
IOLOGIA
V
EGETAL
D
IVERSITY OF AEROBIC ANOXYGENIC PHOTOTROPHIC
BACTERIA IN MICROPHYTOBENTHIC BIOFILMS FROM
TAGUS ESTUARY
Dissertação orientada por Prof.ª Doutora Ana Tenreiro
Maria Inês Dias Cardoso
M
ESTRADO EM
M
ICROBIOLOGIA
A
PLICADA
D
IVERSITY OF AEROBIC ANOXYGENIC PHOTOTROPHIC
BACTERIA IN MICROPHYTOBENTHIC BIOFILMS FROM
TAGUS ESTUARY
Maria Inês Dias Cardoso
2013
This thesis was fully performed at Center for Biodiversity,
Functional and Integrative Genomics (BioFIG- FCUL) under the
direct supervision of Prof.ª Dr.ª Ana Tenreiro in the scope of the
Master in Applied Microbiology of the Faculty of Sciences of the
PERSONAL ACKNOWLEDGMENTS
Esta tese de mestrado fecha um percurso de cinco anos no grupo BioFIG (Unidade de Investigação de Microbiologia e Biotecnologia, Tec Labs, Faculdade de Ciências, Universidade de Lisboa), no início como aluna da Licenciatura em Microbiologia em estágio curricular e depois como aluna do Mestrado em Microbiologia Aplicada e bolseira de investigação no projeto SeaPhoB (PDTC/MAR/101410/2008, Fundação para a Ciência e a Tecnologia). Foi um período muito enriquecedor e, até ao momento, o mais importante da minha formação. A todos os que partilharam comigo a sua experiência, que me ajudaram e, que assim, se dedicaram ao meu crescimento profissional e pessoal, o meu mais sincero obrigado.
À minha orientadora, Professora Ana Tenreiro, e também ao meu chefe de projeto, Professor Bruno jesus, um agradecimento especial, por acompanharem de perto toda esta jornada. Por todos os vossos conselhos, sugestões e por todo o suporte para a construção desta tese. Ao Professor Rogério Tenreiro e ao seu grupo de trabalho por ter criado todas as condições necessárias à realização deste trabalho e por todos os extras que advieram de fazer parte deste grupo com uma bagagem científica tão cheia, tentei aproveitar ao máximo.
À Sandra e ao Mickael, que trabalharam mais próximos de mim e que estiveram diretamente envolvidos neste projeto: muito obrigado, convosco tudo foi mais fácil. Mickael obrigado pela ajuda na amostragem, na granulometria, na estatística e no tratamento dos dados em R. Sandra, obrigado por toda a orientação nas técnicas de biologia molecular, em especial na reta final de correção da tese. E aos outros intervenientes no trabalho desta tese que das mais variadas formas contribuíram para o resultado final: Professora Lélia Chambel (por me ter introduzido ao software Bionumerics), Professora Ana Viana (por todo o apoio na técnica de microscopia de força atómica), Professor Paulo Cartaxana (pela ajuda nas várias amostragens), Bernardo (pelos serviços de sequenciação), Christian Jeanthon (por ceder a estirpe tipo que foi usada como controlo) e Cláudia.
A todos os “ colegas” de laboratório que passaram por mim ao longo destes anos e que à sua maneira também contribuíram: Abdou, Ana, Bruno, Carolina, Cátia, Cheila, Cláudias, Cristiano, Daniela, Filipa, Joanas, João, Lara, Lisete, Luís, Marta, Olívia, Ricardo, Sérgio, Sofia, Susana, Tania, Tânia, Teresa, Tiago, Vânia e Zé. Em especial às minhas “pérolas” que tanto amimaram os meus dias: Ana, Bernardo, Cláudia, Daniel, David, João e Micka, obrigado pela vossa amizade. Um mimo como deve de ser à Cláudia, de quem estive mais próxima ao longo deste tempo: amiga mais dedicada que tu não há, obrigado por todo o cuidar.
Aos meus pais e ao meu irmão pelo apoio incondicional que sempre me demonstraram, sem vocês nada disto seria possível, espero que vos orgulhe. Ao meu baby Paulo por tudo o que partilhámos desde que nos conhecemos, por seres o meu melhor ouvinte, por todos os conselhos e força e por o nosso futuro ser a minha motivação e inspiração. À minha grande e forte família, aos meus incontáveis amigos e também à candeia, todos vocês são a minha vida.
ABSTRACT
DIVERSITY OF AEROBIC ANOXYGENIC PHOTOTROPHIC BACTERIA IN
MICROPHYTOBENTHIC BIOFILMS FROM TAGUS ESTUARY
Maria Inês Cardoso
Center for Biodiversity, Functional and Integrative Genomics (BioFIG), Microbiology & Biotechnology Research Unit, Tec Labs, Faculdade de Ciências, Universidade de Lisboa, Campo Grande, 1749-016, Lisboa, Portugal
Master in Applied Microbiology
Aerobic anoxygenic phototrophic bacteria (AAnPB) are primarily heterotrophic organisms capable of harvesting light energy using photosynthetic reaction centres composed of bacteriochlorophyll a (BChl a), that in contrast to the related purple photosynthetic bacteria are unable to use the light for anaerobic growth and require oxygen to respire organic compounds, which are essential for growth. This functional group is present in many habitats and seems to be very abundant in estuarine waters. Although, the presence of AAnPB in estuarine water column is well established, there is little information regarding AAnPB presence in estuarine microphytobenthos (MPB) biofilms. In the current study the AAnPB abundance and diversity were investigated in MPB biofilms from Tagus estuarine intertidal sediments. Using a poliphasic approach with classical microbiology culture dependent techniques and molecular biology culture independent techniques (mainly polymerase chain reaction and temperature gradient gel electrophoresis) we evaluated AAnPB spatio-temporal patterns in three sediment types (sand, sandy mud and mud) throughout one year. AAnPB were present in all four seasons, with more abundance but less diversity in summer and fewer but more varied in cooler seasons. Higher AAnPB abundance and diversity was observed in the sandy sediment. All these observations are in accordance with the total of bacteria studied in the same way. However, contrary to total bacteria that had a pronounced seasonal effect in the formation of their communities, AAnPB could keep their community more or less stable throughout the year. Three new AAnPB isolates from Tagus intertidal sediments were placed in Roseobacter clade of phylogenetic trees using pufM gene sequence data and sequences from Gene Bank. This work shows that previously neglected AAnPB are relevant components of estuarine MPB biofilms forming in intertidal sediments.
Subject category: bacterial diversity and community ecology
Keywords: Aerobic anoxygenic phototrophic bacteria, Diversity, Estuary, Microphytobenthos biofilms, Photoheterotrophs, Seasonality, Sediments, Temperature gradient gel electrophoresis.
SUMÁRIO
DIVERSIDADE DE BACTÉRIAS AERÓBIAS ANOXIGÉNICAS FOTOTRÓFICAS
EM BIOFILMES MICROFITOBÊNTICOS DO ESTUÁRIO DO TEJO
Este trabalho foca-se num grupo funcional bacteriano específico, as bactérias aeróbias anoxigénicas fototróficas (AAnP). Estas bactérias são fotoheterotróficas, utilizando substratos orgânicos como fonte de carbono e energia e a luz como uma fonte adicional de energia. Ao contrário das bactérias púrpura não-sulfúreas (PNS), um dos grupos filogeneticamente mais próximo, que apenas realizam fotossíntese na ausência de oxigénio, as bactérias AAnP não conseguem utilizar a luz como fonte primária de energia, em condições anóxicas, necessitando de oxigénio para metabolizar os compostos orgânicos que são essenciais ao seu crescimento. Estas bactérias são, primariamente, organismos heterotróficos que têm a capacidade de captar energia luminosa por possuírem sistemas fotossintéticos com bacterioclorofila a nos seus centros de reação (Yurkov & Csotonyi 2009). Embora as bactérias AAnP e PNS realizem fotossíntese anoxigénica e possuam sistemas fotossintéticos semelhantes, a pressão seletiva conduziu a uma divergência evolutiva, conferindo às AAnP a capacidade de ocupação de novos nichos ecológicos, devido à obtenção de energia por fototrofia anoxigénica em ambientes óxicos. (Rathgeber et al. 2004). Estas bactérias desenvolveram também mecanismos de controlo da fototoxicidade resultante dos danos oxidativos nas células produzidos por espécies químicas reativas (tripletos de bacterioclorofila e singletos de oxigénio) que se formam quando a bacterioclorofila a é exposta à luz na presença de oxigénio (Beatty 2002).
As bactérias AAnP foram caracterizadas pela primeira vez em ambientes marinhos por Shiba e colaboradores (1979), e nos últimos anos têm sido isoladas em praticamente todo o tipo de ambientes: rios, solos, água ácida de minas, nascentes hipersalinas e ambientes marinhos abrangendo tanto as águas superficiais dos oceanos como também chaminés hidrotermais a grandes profundidades (Yurkov & Csotonyi 2009). Atendendo à ampla distribuição das bactérias AAnP nos oceanos pensou-se inicialmente (Yurkov & van Gemerden 1993; Suyama et al. 2002) que a fotoheterotrofia podia ser benéfica em ambientes pobres em nutrientes, tais como em zonas oligotróficas. Contudo, recentemente, demonstrou-se que estas bactérias são abundantes quer em ambientes eutróficos, quer em ambientes oligotróficos (Jiao et al. 2007; Yutin et al. 2007). Atualmente sabe-se que as bactérias AAnP constituem apenas no máximo 10% de todas as bactérias presentes em ambientes marinhos (Yurkov & Csotonyi 2009) sendo mais prósperas em ambientes de nível trófico mais elevado, que lhes conseguem fornecer os substratos suficientes para manter o seu metabolismo essencial, a heterotrofia, usando a fototrofia apenas como um suplemento de energia (Hojerová et al. 2011). Outros autores sugerem que a ligação a partículas (Cottrell et al. 2010; Waindner & Kirchman 2007) ou a intensidade da luz (Koblížek et al. 2010) podem influenciar a sua abundância.
As bactérias AAnP existem muito frequentemente em estuários como em: Long Island Sound (Schwalbach & Fuhrman 2005), Chesapeake Bay (Waidner & Kirchman 2007; Cottrell et
al. 2010) ou em Delaware Bay (Waidner & Kirchman 2007; Cottrell et al. 2010), constituindo pelo menos 10% de todos os procariotas aí existentes.
Os estuários representam zonas de transição entre os biomas de água doce e marinho apresentando vários gradientes de parâmetros que diferem nesses dois ambientes (Kaiser et al. 2005). Constituem um dos ecossistemas mais produtivos do planeta, tecnologicamente importantes e são também zonas tampão contra a subida do nível da água do mar (Underwood & Kromkamp 1999). Normalmente os estuários têm zonas intertidais que são colonizadas por biofilmes microfitobênticos (MFB) que se formam na superfície dos sedimentos intertidais (Underwood 2010). Estes biofilmes, apesar de terem a sua atividade no sedimento cingida a poucos milímetros, dependendo da penetração da luz, a sua produtividade é normalmente muito elevada (Underwood & Kromkamp 1999; Underwood 2010). Os biofilmes podem ser compostos por diferentes grupos de microalgas e por cianobactérias (MacIntyre et al. 1996), sendo também espectável que incluam espécies de Proteobacteria e Bacteroidetes (Stevens et al. 2005), porque estes organismos são importantes nos ciclos de carbono e energia nos estuários. No entanto, apesar da fração das microalgas e cianobactérias estar bem explorada a presença de bactérias fotoheterotróficas nos biofilmes MFB estuarinos tem sido negligenciada.
Recentemente, estudos publicados sugerem que as bactérias AAnP se encontram frequentemente associadas a partículas (Cottrell et al. 2010, Wainder & Kirchamn 2007, 2008), tendo esta associação maior relevância em ambientes estuarinos (Cottrell et al. 2010). Nestes ambientes as partículas absorvem a luz e constituem fontes de matéria orgânica permitindo que as bactérias associadas às partículas apresentam taxas de crescimento mais elevadas do que as que as vivem livremente (Kirchman & Mitchell 1982; Riemann et al. 2000; Cottrell et al. 2010).
Apesar da importância das bactérias AAnP, na ecologia microbiana, pela sua contribuição no fluxo do carbono e da energia, a abundância e diversidade destas bactérias, assim como os fatores ambientais que controlam o seu crescimento estão pouco estudados. O objetivo deste trabalho foi investigar os padrões de variação espacial e temporal das bactérias AAnP em biofilmes MPB no estuário do Tejo. Foram realizadas amostragens em quatro estações do ano (Inverno, Primavera, Verão e Outono), em três tipos diferentes de sedimentos (areia, misto e vasa). Com este objetivo, foram perspetivadas duas abordagens diferentes e complementares: (i) técnicas dependentes de cultivo, que englobaram o isolamento de potenciais bactérias AAnP, a subsequente caracterização fenotípica e molecular dos isolados e a sua afiliação numa árvore filogenética, baseada nas sequências de fragmentos do gene pufM; (ii) técnicas moleculares, independentes de cultivo, que consistiram fundamentalmente em amplificação por PCR e eletroforese em gel com gradiente de temperatura (TGGE) do gene fotossintético pufM e fragmentos do gene 16SrRNA, para monitorização espacial e temporal das comunidades microbianas.
Com a abordagem dependente de cultivo obtiveram-se 124 isolados, distribuídos, ao longo do tempo pelos diferentes sedimentos, correspondentes a, por 46 diferentes unidades operacionais de taxonomia (OTUs), que eram semelhantes a outras comunidades bacterianas
de estuários e agrupadas em Proteobacteria, Firmicutes, Actinobacteria, Bacteroidetes e a isolados não classificados de solos e sedimentos (Crump et al. 1999, 2004). As amostras recolhidas eram particularmente ricas em Alpha e Gammaproteobacteria, onde se incluem as bactérias AAnP (Waidner & Kirchman 2007, Lami et al. 2009) e que estão frequentemente associadas a partículas (Crump et al. 1999, 2004, Giorgio & Bouvier 2002, Waidner & Kirchman 2008). Foi efetuada a caracterização fenotípica dos isolados (observação macroscópica das colónias, morfologia celular, coloração de Gram).
Para a identificação de potenciais bactérias AAnP procedeu-se à amplificação do gene pufM no conjunto dos isolados. O gene pufM codifica para a subunidade M do centro de reação fotossintético, que está presente em todas as bactérias AAnP (Nagashima et al. 1997, Beja et al. 2002, Zheng et al. 2011). Do conjunto dos 124 isolados isolaram-se duas potenciais bactérias AAnP positivas para o gene pufM e com crescimento na presença de luz e oxigénio: SPS1025 (isolada na Primavera) e SPW1034 (isolada no Inverno). Estes dois isolados foram filiados respetivamente nos Géneros Rhodovulum e Shewanella, embora não sejam semelhantes a alguma das espécies descritas. Na continuidade deste trabalho foram aplicados outros critérios taxonómicos, permitindo num futuro breve propor a criação de duas novas espécies "Rhodovulum lusitanum sp. nov." e “Shewanella lusitana sp. nov.”.
A abordagem molecular independente de cultivo baseou-se fundamentalmente na amplificação por PCR do DNA genómico das comunidades bacterianas presentes nos sedimentos utilizando como alvos os genes 16S rRNA e pufM. Observou-se amplificação do gene 16S rRNA em todas as amostras e, foi possível detetar bactérias AAnP nos diferentes tipos de sedimentos e ao longo de todo o ano. Este resultado confirma que este grupo funcional bacteriano deve constituir um componente relevante nos biofilmes MFB intertidais estuarinos. Apesar das bactérias AAnP colonizarem todos os sedimentos, a sua abundância e diversidade nos sedimentos arenosos foi maior quando comparada com os de vasa, o que indicia que o tipo de sedimento é uma variável importante na estrutura destas comunidades bacterianas nos biofilmes MFB, o que é concordante com outros trabalhos sobre a fração eucariótica dos biofimes MFB (e.g. Jesus et al., 2009; Ribeiro et al., 2013).
Para avaliar a diversidade dos indivíduos da comunidade bacteriana total e de AAnP utilizou-se a técnica de TGGE, para cada um dos genes estudados. Esta técnica permite separar genes de iguais massas moleculares mas de diferente sequência nucleotídica (Muyser & Samlla 1998). De forma a analisar a diversidade das comunidades bacterianas totais e de bactérias AAnP foram calculados diferentes índices de diversidade, utilizando os perfis de TGGE. A análise da abundância e da diversidade das bactérias AAnP nos vários sedimentos durante um ano permitiu concluir que estes parâmetros apresentavam uma variação ao longo do ano, com uma maior abundância de bactérias AAnP mas menor diversidade no verão, e o inverso nas estações mais frias, resultados consistentes com os observados noutros ecossistemas (Jiao et al. 2007; Cottrell & Kircham 2009; Lehours et al. 2010 e Jeanthon et al. 2011).
Na sua globalidade as comunidades bacterianas do estuário do tejo variaram em função das estações do ano (como noutros estuários em Fortunato et al. 2012) e, pelo contrário, os sedimentos não eram fatores determinantes no estabelecimento destas comunidades. Ainda assim, as bactérias AAnP, ao contrário do que se observou com as comunidades bacterianas totais, evidenciaram uma maior estabilidade ao longo do ano (como em Yutin et al. 2008). Nos dois casos o verão foi sempre a estação que apresentou uma maior dispersão espacial.
DIVERSI TY OF AEROBIC ANOXYGENI C PHOTOTROP HIC BACTERIA IN MICROPHYTOBENTHI C BI OFIL MS F ROM TAGUS ES TUARY
Personal Acknowledgments ... I Abstract ... II Sumário ... III
1. Introduction ... 1
1.1 – Aerobic Anoxygenic Phototrophic Bacteria (AAnPB) ... 1
1.2 – Electron transfer system and photosynthesis ... 2
1.3 – Photosynthesis gene cluster ... 4
1.4 – Origin, evolution, phylogeny and taxonomy ... 4
1.5 – Habitat ... 5
1.6 – Thesis objective ... 7
2. Materials and methods ... 8
2.1 – Study area... 8
2.2 – Sampling ... 8
2.2.1 – Sampling for particle size analysis ... 8
2.2.2 – Sampling for culture-based approach ... 9
2.2.3 – Sampling for molecular approach culture independent ... 9
2.3 – Cultivation, isolation and maintenance ... 9
2.4 – Culture properties and morphology ... 10
2.5– Nucleic acid extraction ... 11
2.5.1 – Isolates DNA extraction ... 11
2.5.2 – Community DNA extraction ... 12
2.6 – Polymerase Chain Reaction (PCR) ... 12
2.7 – Cloning ... 14
2.8 – Sequencing... 15
2.9 – Phylogenetic tree of pufM isolates ... 15
2.10 – Temperature Gradient Gel Electrophoresis (TGGE) ... 15
2.11 – Diversity index ... 17
2.12 – Statistical analysis ... 17
3. Results and discussion ... 18
3.1 – Seasonal evolution of the sampling sites ... 18
3.2 – Cultivated bacteria diversity ... 18
3.2.1 – Phenotypic characterization ... 19 3.2.2 – 16S rRNA diversity ... 19 3.2.3 – pufM diversity ... 21 3.3 – Molecular approach ... 25 3.3.1 – Abundance ... 26 3.3.2 – Temporal diversity ... 27 3.3.3 – Spatial diversity ... 34 4. Conclusions ... 35
4.1 – AAnPB in estuarine sediments ... 35
4.2 – Seasonal variation of AAnPB ... 35
4.3 – The new AAnPB ... 35
4.5 - Future Prospects ... 36
1. INTRODUCTION
1.1 – Aerobic Anoxygenic Phototrophic Bacteria (AAnPB)
Photic environments are inhabited by different groups of photoautotrophs. In oxic environments the aerobic photosynthesis prevails due to the presence of eukaryotes and cyanobacteria whose main photosynthetic pigment is chlorophyll a (Chl a) or a derivative of it (Scheer 1991). On the other side, anoxic environments are abundant in anoxygenic photosynthetic bacteria, which mainly synthesize bacteriochlorophylls (BChl) a, b, c, d, e, and g. About 35 years ago, Shiba et al. (1979) isolated, from marine environments, sixteen strains of obligately aerobic bacteria, which contain BChl a, showing that anoxygenic photosynthesis could also occur in aerobic conditions. These strains were the first described aerobic anoxygenic phototrophic bacteria (AAnPB) capable of synthesizing BChl a, as primary photosynthetic pigment, and capable of carrying out photosynthesis aerobically without generation of oxygen (Yurkov & Beatty 1998). For many years was generally believed that anoxygenic photosynthesis was a type of anaerobic growth, performing for either obligate anaerobic or facultative anaerobic bacteria capable of switching between respiration under aerobic conditions and phototrophy under anaerobic conditions (Pfennig 1978). AAnPB with other photoheterotrophs as proteorhodopsin-containing bacteria, which instead of using the BChl in photosynthesis use proteorhodopsin (a light-driven proton pump) (Béja et al. 2000), come to change definitely this paradigm. Currently, AAnPB represent a bacterial functional group that has inspired an ever-increasing scientific interest (Yurkov & Csotonyi 2009).
AAnPB are considered mixotrophs, which are the organisms with a diverse metabolic strategy in where at least three modes (photo-, organo-, auto- and heterotrophy) are combined (Eiler 2006). They are typical photoheterotrophs, requiring 80% or more on organic substrates for respiration and growth, but able of producing a significant portion of their energy requirements from light (Koblížek et al. 2010). The investment in the synthesis and maintenance of both a light-harvesting apparatus and the machinery for uptake and degradation of organic compounds can only be balanced by the opportunity of double organic carbon assimilatory efficiency with sunlight, getting an advantage over strict heterotrophs (Yurkov & Csotonyi 2009) especially when the availability of organic matter is limiting their growth.
Most of the AAnPB isolates are capable of metabolized sugars, carboxylic acids, fatty acids, and amino acids and a great diversity of organic carbon sources (Eiler 2006). However, at present, the ability of AAnPB to fix CO2 photosynthetically has not been found in any member of this group: both enzymatic and molecular studies show the lack of key enzyme of cycle of Calvin, the ribulose-1,5-bisphosphate carboxylase/oxygenase (RubisCO) (Rathgeber et al. 2004). But, there are other ways of carbonincorporation into cellular material as by phosphoenol pyruvate (PEP) carboxylase, a respiratory enzyme that form oxaloacetate for tricarboxylic acid (TCA) cycle by binding CO2 to phosphoenol pyruvate (Yurkov & Csotonyi 2009). Therefore the AAnPB may have a role in the cycling of the low amounts of carbon (Rathgeber et al. 2004). Moreover, being
capable of production up to 20% of cellular energy through photoheterotrophy, the requirement for heterotrophic oxidation of organic carbon decrease and, so, AAnPB allow the preservation of that organic carbon in the environment (Kolber et al. 2001). Besides this, in some environments AAnPB can maintain high growth rate, becoming 2 to 3 times larger than other heterotrophic bacteria (Sieracki et al. 2006), making them more vulnerable to predator attack (Crumps et al. 1998; Pernthaler 2005, Ferrera et al. 2011), and contribute to a larger proportion of carbon to the upper trophic levels (Xiao et al. 2011). In this lyse by predators AAnPB release dissolved organic carbon (DOC), and some of bacterially-derived DOC is resistant to further biological degradation (Gruber et al. 2006, Ogawa et al. 2001) which contributes to carbon sequestration in the ocean (Jiao et al. 2010).
AAnPB are a morphologically diverse group of bacteria, the cells may have different forms including rods, ovoid, coccoid, with one or two pointed end and can even be pleomorphic; they can be found isolated and show appendices or structures like hooks, or in aggregates forming complex rosettes, or even in chains with bubble-like formations connecting the cells (Yurkov & Csotonyi 2009). All display characteristic bright colours from watermelon red to brown, through orange, yellow, pink and purple due to the rich presence of carotenoids (Eiler 2006). The majority of these pigments are also synthesised by anaerobic phototrophic bacteria, but AAnPB produce an increased amount of carotenoids relative to BChl comparing to them (Yurkov & Beatty 1998). These carotenoids are very varied (spheroidenone, erythroxanthin, bacteriorubixanthinal, β-carotene, nostoxanthin, spirilloxanthin or zeaxanthin) and species specific (Zheng et al. 2013).
Some species of AAnPB have internal vesicles of polyhydroxyalkanoates (PHAs), high molecular weight linear polyesters, which are synthesized and stored in the cell cytoplasm as water-insoluble inclusions (Xiao & Jiao 2011). Due to their thermal plasticity, PHA have gained great attention for the replacement of conventional petrolic plastics. But AAnPB may also play a role in the remediation of polluted sites, especially Roseobacter sp. (Gram et al. 2002; Buchan et al. 2000; Ruiz-Ponte et al. 1999) and Porphyrobacter sanguineus (Hiraishi et al. 2002). Some species of AAnPB have extremely high resistance to heavy metal and are capable of reducing these toxic compounds and accumulating them intracellularly in the elemental form. Some examples of AAnPB with these characteristics include the Genus Erythromicrobium and Erythrobacter litoralis (Yurkov & Beatty 1998, Yurkov 2006) and some species of Acidiphilium sp. (Hiraishi & Shimada 2001; Mahapatra et al. 2002).
1.2 – Electron transfer system and photosynthesis
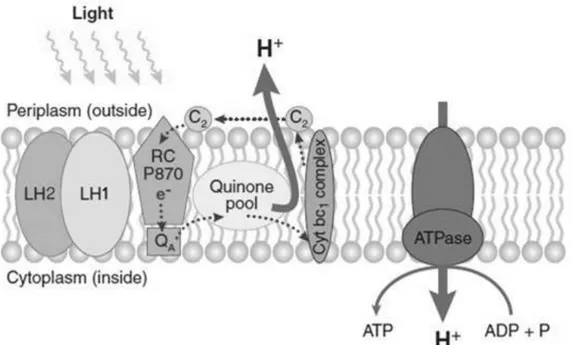
The AAnPB photosynthetic cyclic electron transport chain appears to be similar to anaerobic anoxygenic phototrophic bacteria (Figure 1) with small differences that makes the AAnPB chain only catalytically active under oxidizing aerobic conditions (Rathgeber et al. 2004): i) the primary quinone electron acceptor QA has a much higher midpoint potential than in anaerobic purple bacteria, becoming and remaining reduced anoxically and, so, incapable of accepting electrons (Rathgeber et al. 2004); ii) the absence of an alternative quinol oxidase
pathway, that in purple non-sulphur bacteria may be used to maintain the quinone pool at a proper redox state when oxygen is present (Candela et al. 2001); ii) and the failure of soluble cytochromes (cyts) to transfer electrons anoxically from the cyt bc1 complex to the reaction centre (RC)-bound cyt c (Schwarze et al. 2000).
Figure 1.1: Cyclic electron transport chain and photosynthesis. AAnPB has a cyclic
electron transport chain involving two large transmembrane protein complexes: the RC and the cyt bc1 complex, which are connected by quinones in the lipidic phase and cyts on the periplasmic side of the membrane. Surrounding the RC, AAnPB possess LH antenna complexes that sequester additional energy from light and are constituted by the core LH1 and an accessory and exterior LH2. Carotenoid-rich LH1 forms an intimate ring of ca. 30 BChls around the RC facilitating highly efficient transfer of electrons to the RC primary electron donor, BChl (P870). Electrons flow to auxiliary bacteriopheophytin (not shown), and then via the QA to quinone pool, to the cyt bc1 complex and are transported back to P870 by the soluble
cyt c2. In the process, a proton gradient is established across the cell membrane and so ATPase membrane complex could produce energy by the phosphorylation of ADP in ATP (Yurkov & Beatty 1998). Picture from Wagner-Döbler & Biebl 2006.
The occurrence of photosynthesis in an aerobic environment is quite a paradox as oxygen inhibits BChl synthesis in all tested anaerobic anoxygenic phototrophs (Yurkov & Hughes 2013). The exposure to light of BChl, in the presence of oxygen, can produce highly reactive chemical species (BChl triplet and oxygen singlet), which induce oxidative damage in cells (Beatty 2002). To prevent the oxidative damage the AAnPB present three strategies: i) a small number of photosystems units; ii) the photosynthetic complexes, including BChl, are only generated when it is safe to do, i.e., there is induction of BChl synthesis during the night and repression during the day when they used it to harvest light energy and iii) synthesis of light-harvesting carotenoids with more than nine conjugated double bonds that filter high-energy radiation helping to minimize photo damage during periods of exposure to intense solar radiation (Yurkov & Beatty 1998).
These non-photosynthetic carotenoids are also capable of quenching the destructive energy of BChl triplet and oxygen singlet, either by direct contact with BChl or by distribution throughout the cell, in case of singlet oxygen scavenging (Fraser et al. 2001).
1.3 – Photosynthesis gene cluster
The majority of photosynthesis genes in AAnPB are organized in a photosynthesis gene cluster (PGC), which accounts ca. 1% of the total genome (Yurkov & Hughes 2013). The PGC has a mosaic structure with five main sets of genes: bch genes encoding enzymes of BChl a biosynthetic pathways, puf operons encoding proteins forming the RC, puh operons encoding an RC protein and also involved in the RC assembly, crt genes responsible for biosynthesis of carotenoids and various regulatory genes. Despite PGC structure be highly conserved, the genes organization varies depending on bacterial lineage. If the composition of bch, puf and puh operons is relatively conserved in all AAnPB, the crt operon only exhibit two genes common for all AAnPB PGCs (Zheng et al. 2011). Such variability is mainly related with different the carotenoid biosynthetic pathways found separately in each clade.
Carotenoids can serve several functions: i) confer protection to the photosynthetic apparatus against reactive chemical species; ii) contribute structurally to antenna complexes increasing light-harvesting cross sectional area and iii) act as accessory LH pigments, broadening the range of captured wavelengths, which allow the use of light in the blue-green and yellow regions of the spectrum (Fraser et al. 2001) that is not absorbed by BChl a.
Among the puf genes, pufM, which encode the M (medium) subunit of photosynthetic RC complex (Nagashima et al. 1997; Béjá et al. 2002), has special relevance, because it is found in all AAnPB and purple bacteria. Since pufM shows both conserved and variable regions, is a good marker gene for evaluating the abundance and genetic diversity of these bacteria (Achenbach et al. 2001, Schwalbach & Fuhrman 2005).
1.4 – Origin, evolution, phylogeny and taxonomy
This group of Proteobacteria is becoming increasingly heterogeneous with species distributed through 37 genera: currently, 56 of the 59 described species of AAnPB are spread throughout the Alphaproteobacteria (Yurkov & Hughes 2013), only one specie, Roseateles depolymerans, is known from the Betaproteobacteria (Suyama et al. 1999), Congregibacter litoralis (Fuchs et al. 2007) and Chromocurvus halotolerans (Csotonyi et al. 2011) are the described Gammaproteobacteria species.
Within Alphaproteobacteria, phototrophs are present in four of the six orders but they do not form a monophyletic clade and in most genera the AAnPB are intermixed with both phototrophic and non-phototrophic bacteria (Gupta 2013). Woese (1987) argues that this happens because photosynthetic and non-photosynthetic species had the same ancestor. So AAnPB can represent the intermediate stage of evolution from anaerobic purple bacteria to non-photosynthetic aerobes (Woese et al. 1984), some organisms lost their PGC, while others
retained them. But this idea is not well supported yet (Yurkov & Hughes 2013). There is another theory that AAnPB arose due to the acquisition of PGC by lateral transfer from non-photosynthetic aerobic bacteria (Blankenship 1992; Nagashima et al. 1993; Nagashima et al.1997), and although there is still some speculation as to how this transfer of the entire PGC occurs, that would explain why AAnPB strains are often closely related to non-phototrophic bacteria (Cho et al. 2007; Igarashi et al. 2001). This theory is supported by sequencing of AAnPB genomes, which show the presence of phage DNA directly associated with the photosynthesis operon (Yurkov & Hughes 2013). Possibly the reality is in the association of both theories, i.e., the purple bacteria loss their phototrophy capacity during the evolution to non-photosynthetic aerobes and then there were gene exchanges between them and phototrophs, giving rise to AAnPB clades (Yurkov & Csotonyi, 2009).
Medová et al. (2011) states that anoxygenic phototrophic bacteria, one of the oldest life forms, evolved long before the oxidation of atmosphere generating metabolic energy from light, and for the past 3.5 billion years grew and photosynthesized only under anoxic conditions. With the presence of oxygenic atmosphere the purple, green and helio bacteria were restricted to few ecological niches, such as illuminated anoxic zones of the stratified lakes or sulphide springs (Pfennig 1978). Therefore, the competition for these habitats suitable for anaerobic anoxygenic photosynthesis became very fierce and facultative anaerobic bacteria were forced to evolve, developing heterotrophic metabolism that allowed them to became independent of light for growth and occupy new habitats. These were the AAnPB progenitors who lost their photosynthetic genes to save their energy costs. These newly evolved non-phototrophs then became AAnPB by regaining PGC latter, through lateral gene transfer from purple non-sulphur bacteria (Jiang et al. 2009; Marrs 1981; Yurkov & Csotonyi 2009)
1.5 – Habitat
Using photoheterotrophy, AAnPB have the possibility of exploring a wide variety of habit niches over a broad range of ecologically and geographically habitats. Rathgeber et al. (2004) groups AAnPB habitats in five ecosystems: (1) marine surface and deep-ocean waters; (2) saline meromictic lakes; (3) river waters; (4) freshwater hot springs and (5) soils. Apart from these habitats, AAnPB were also discovered in extreme environments of temperature, salinity, acidity and alkalinity, which illustrates the great capability to adapt to specific environments and survive almost anywhere.
AAnPB are an abundant component of bacterial communities in oceans. Oceanic waters are normally highly dilute in organic matter, which lead to a first speculation that phototrophic characteristics of AAnPB would be beneficial against purely heterotrophs (Yurkov & van Gemerden 1993; Suyama et al. 2002). In fact, Kolber (2000) reported that AAnPB comprise at least 11% of total bacterial in upper ocean. However, other studies (Yurkov & Csotonyi 2009) showed that the AAnPB- might constitute only 1 to 10% of all bacteria on these environments. In contrast to the original theory of Kolber (2000), a new hypothesis emerged when Hojerová et al.
(2011) observed that AAnPB grew better in rich trophic environments that provide sufficient substrates to maintain their growth. In this situation AAnPB used only light energy to supplement their primarily heterotrophic metabolism. Consequently was verified that AAnPB can constitute more than 10% of total prokaryotic abundance in estuaries such as Long Island Sound (Schwalbach & Fuhrman 2005), Chesapeake Bay (Waidner & Kirchman 2007; Cottrell et al. 2010) and Delaware Bay (Waidner & Kirchman 2007; Cottrell et al. 2010), all these ecosystems are rich trophic environments.
Estuaries are located in the transition from marine to river freshwater environments; therefore they have pronounced salinity gradient and high loads of suspended organic matter (Kaiser et al. 2005). Also estuaries are amongst the most productive ecosystems on earth, they are commercially important and act as buffer zones against current sea level rise (e.g. Underwood & Kromkamp 1999).
Estuarine ecosystems often exhibit extensive intertidal areas colonized by microphytobenthos (MPB) assemblages that form transient biofilms on the sediment surface during tidal emersion periods (Underwood 2010). Although MPB activity is normally restricted to a superficial biofilm a few millimetres thick, MPB primary productivity is high, often exceeding that of phytoplankton that cover the water column (Underwood & Kromkamp 1999; Underwood 2010). MPB biofilms are also sites of nitrogen cycling processes (Risgaard-Petersen, 2003; Cook et al. 2007) and because they are rich in extracellular polysaccharides, they can increase the physical stability of the underlying sediment (Orvain et al. 2003; Underwood & Paterson 2003). Typically, MBP assemblages occur wherever light reaches the sediments surface, being abundant on intertidal mudflats, sandflats and shallow subtidal regions (Cahoon 1999; Underwood & Kromkamp 1999; Stal 2003; Underwood & Paterson 2003).
MPB biofilms are taxonomically diverse including different microalgae groups (e.g. diatoms, euglenoids, green algae) and photosynthetic bacteria (e.g. cyanobacteria) (MacIntyre et al. 1996). Among these photosynthetic microorganisms it is expected that also are Proteobacteria and Bacteroidetes, markedly present in tidal flats (Stevens et al. 2005), because they are important in the microbial carbon and energy cycling in estuarine, coastal and oceanic waters (Cottrell et al. 2010). Although the microalgae and cyanobacterial MPB components are well studied, little is known about the presence of photoheterotrophic bacteria in estuarine MPB biofilms. Among these photoheterotrophic bacteria, the presence of AAnPB in estuarine water column is well established (Yurkov & Beatty 1998; Rathgeber et al. 2004).
Moreover, particle attachment seems to be a key adaptation for the prevalence of AAnPB (Cottrell et al. 2010). Concentrations of BChl a (Waidner & Kirchman 2007; Cottrell et al. 2010) or pufM (Waidner & Kirchman 2007, 2008) were higher in particle-associated than in free-living AAnPB communities. On Delaware Bay 30–90% of AAnPB are associated with particles, whereas usually 20% or less of total prokaryotes are particle associated (Waidner & Kirchman 2007). However, in the Atlantic Ocean and Mediterranean Sea, less AAnPB (10–40%) appeared to be associated with particles (Lami et al. 2009). Thus, high percentages of particle-associated AAnPB
may be associated with a specific feature of estuaries (Cottrell et al. 2010), so it is important to study the presence of AAnPB in sediments of these environments. The association with particles make AAnPB particularly competitive in estuaries and thus capable of faster growth than their free-living counterparts (Kirchman & Mitchell 1982; Riemann et al. 2000, Cottrell et al. 2010). Adaptations to the particle environment may involve responses to the availability of light controlled, in part by light scattering and absorption by particles and to the availability of substrates that may be associated with detrital particles.
1.6 – Thesis objective
Despite its potential importance in microbial ecology, the abundance and diversity of AAnPB, as well as the environmental variables that control their growth are still poorly understood. The objective of the current work was to address this knowledge gap and investigate the spatiotemporal patterns of AAnPB in estuarine MPB biofilms. While, to date, studies in estuaries examined the microbial diversity in water samples, this work was the first to analyse AAnPB diversity in samples of different types of estuarine sediments (sand, sandy mud and mud), while studying the seasonal variation of these communities.
With this main purpose, two different and complementary approaches were used: i) techniques dependent of culture i.e., the microbiological isolation of potential AAnPB, subsequent phenotypic and molecular characterization of the isolates and the affiliation of these AAnPB isolates in a phylogenetic tree with AAnPB culture representatives, based on PCR products of 16S rRNA gene fragments and sequence analysis and ii) molecular techniques independent of culture: polymerase chain reaction (PCR) and temperature gradient gel electrophoresis (TGGE) of photosynthetic pufM gene, for monitoring spatial and seasonal changes in AAnPB communities. In parallel the bacterial community composition was examined by TGGE with PCR products of 16S rRNA gene fragments.
2. MATERIALS AND METHODS
2.1 – Study area
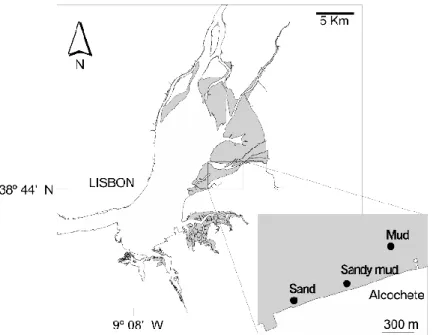
All sampling was carried out in the tidal flat on the eastern beach of the Tagus estuary, south of the town of Alcochete (Figure 2.1). The Tagus estuary is one of the largest wetlands in Western Europe with an area of 320 km2 and an intertidal area ranging from 20 to 40 % of the total estuary dominated by muddy sediments (Brotas & Catarino 1995). The Tagus River is the main source of freshwater into the estuary with flows ranging from 120 m3 s-1 in summer to 635 m3 s-1 during winter (Gameiro & Brotas 2010). This river water influx to Tagus estuary is small in comparison to the water already present in the estuary and the influx is concentrated in winter (Ribeiro 2010).
Figure 2.1: Study area. The Tagus estuary with the intertidal areas presented in grey. The
localization of sampling stations of the three different sediment types is presented in the inbox: Picture adapted from Jesus 2006
The samples were collected during spring low tides when the amplitude is maximal.
2.2 – Sampling
To capture a representative measurement of AAnPB diversity, three sampling sites, corresponding to three different types of sediments (sand, sandy mud and mud) were sampled four times over a year, sampling each season (winter – February, spring – May, summer – July, autumn – October) with a total of 60 samples (4 times x 3 sediment types x 5 replicates).
2.2.1 – Sampling for particle size analysis
To characterize the sampling sites ca. 0.5 cm of the top of each sediment was collected (five replicates) and brought back to the laboratory for grain size analysis. Water content was determined after drying fresh sediments at 60 ºC during 48h. The < 63 µm size fraction was removed by washing and manual sieving. The rest of sediments were again dried at 60 ºC and
weighted to determine the fraction of finer particles by the difference of dry weight after 63 µm sieve in relation to the initial dry weight. The remaining grain size composition was determined by sequential sediment-sieving, using an analytical sieve shaker (AS 200 basic, Retsch) to evaluate the relative abundance (% dry weight) of > 1000, 1000-500, 500-250, 250-125 and 125-63 µm size fractions. Sediments were classified into sediment type according to phi scale from Folk (1954).
2.2.2 – Sampling for culture-based approach
Microbiological cultures sampling was conducted in situ by directly inoculating the surface area (the aerobic portion) of sediments on 3 different culture media (five replicates): i) PPES-II medium described by Taga (1968) for the isolation of Erythrobacter sp. and Roseobacter sp. and other marine species (in Shiba et al. 1979), ii) Marine broth 2216 (MB, Difco) and iii) MB supplemented with 0.01% cycloheximide (Cyc). The Cyc used in commercial medium MB is an antifungal, which inhibits the protein synthesis in eukaryotic cells stopping growth and causing their death (Kominek 1975). These rich media fit the heterotrophic AAnPB needs of some organic carbon sources and replicates their native environment conditions with high concentration of sodium chloride and other salts.
The inoculation was done in liquid media (10 mL) and in media solidified with 1.5% agar. Samples were transported back to the laboratory in darkness at 4ºC and incubated in the laboratory at 30ºC with natural light.
2.2.3 – Sampling for molecular approach culture independent
Sediments for community DNA extraction were collected using the contact core technique that freezes in situ the top 2 mm of the sediment with liquid nitrogen, forming discs with 56 mm of diameter. This technique allows sampling quickly the sediment photic zone (Ford & Honeywill 2002). Five replicates were collected at each sediment type. All frozen samples where lyophilized and stored at -80ºC within few hours after the sampling.
2.3 – Cultivation, isolation and maintenance
Culture isolation followed a weekly inoculation schedule: the first in the sampling day and then once a week during four weeks. From dilutions of the initial liquid cultures (inoculated in situ), volumes of 100 µl were spread in the same media solidified with 1.5% agar. The inoculated plates were incubated under natural light at 30ºC during one week. The rich and non-selective media allowed the growth of a high diversity of microorganisms, including non-phototrophs. Thus, the selection of potential AAnPB was based on colonies pigmentation, with colours in the red gradation from brown to yellow, because this is the typical colour range of AAnPB carotenoids (Yurkov & Beatty 1998). Picked colonies were collected and suspended in 0.9% sodium chloride and re-streaked in the same solid media two or three times until they were pure. The isolates were stored on solid medium at 4ºC maintaining their viability for two months (Yurkov & Beatty 1998). For longer preservation times, dense cell suspensions of liquid cultures were supplemented with 20% glycerol or 5% DMSO as cryoprotective agents and stored at -80ºC.
The purified isolates were designated with the following code: SP (initials of SeaPhoB, the research project which funded the work), the initial letter of the season in which sampling was made (W, winter; S, spring; Sm, summer and A, autumn), the year of sampling (10, 2010) and the ordinal number of their isolation on each season. For example code SPS1025 corresponds to the isolate nº 25 of spring 2010 under SeaPhoB project work.
2.4 – Culture properties and morphology
The macroscopic observation of isolated colonies (form, consistency, opacity, pigmentation) was performed with the aid of a magnifying glass (Wild Heerbrugg M7A, Leitz). After Gram staining (Gram-colour staining kit, Merck, according to the protocol of manufacture) cell morphology was characterized by light microscopy (Laborlux K, Leica). In the same microscope the flagellum type was examined using cells from exponentially growing cultures with simplified silver staining (West et al. 1977) in 0.5% (v/v) formalin-treated distilled water.
For two of the isolates, the characterization was further complemented by Atomic Force Microscopy (AFM). AFM is an outstanding technique in all fields of surface science, including microbiological research constituting a reliable approach to observe morphological details of bacteria.
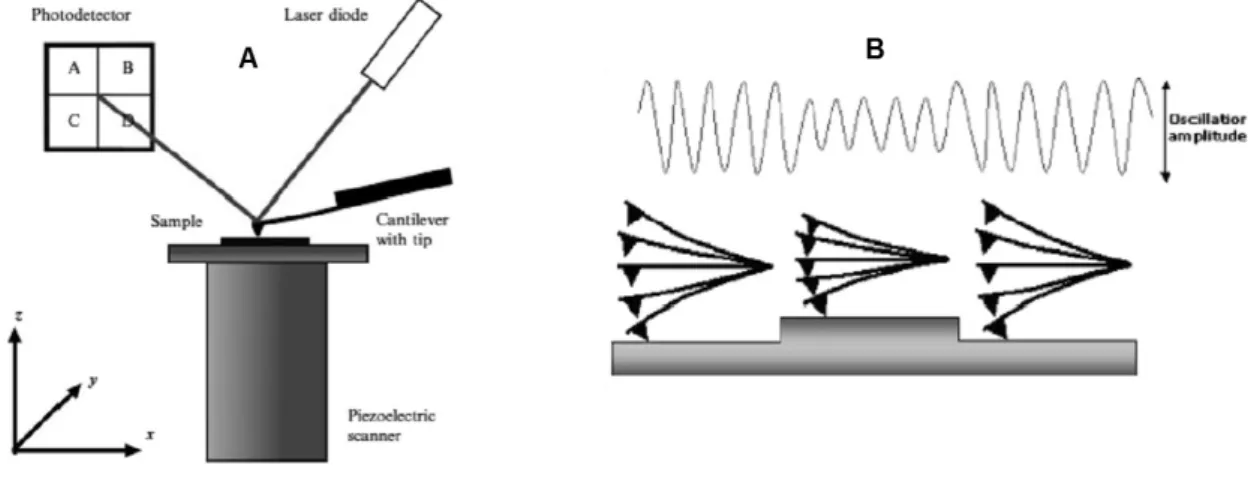
The AFM consists of three major components (Figure 2.2A): an AFM probing tip mounted at the end of a flexible cantilever; a piezoelectric scanner, the sample stage, which ensures three-dimensional positioning with high precision and accuracy; an optical deflection system consisting of a laser diode and a photo detector (Dorobantu et al. 2012).
Figure 2.2: Schematic illustration of: AFM. (A) AFM setup (Alsteens 2012); (B) AFM tip
operating in the intermittent contact mode (Alessandrini & Facci 2005)
The cantilever deflection, resulting from small forces of interaction between the sample and the tip, is detected by the optical system. A laser beam is reflected off the backside of the cantilever and collected into a photo detector, which records the position of the reflected beam. The magnitude of the deflected beam changes in response to the interaction force between the
tip and the sample. In almost all operating modes, a feedback circuit, connected to the cantilever deflection sensor, keeps tip-sample interaction at a fixed value controlling the tip-sample distance.
Different AFM imaging modes are available (contact mode, non-contact mode and tapping mode or intermittent contact), which differ mainly in the way the tip moves over the sample (Dorobantu et al. 2012). In this work, the AFM images were obtained in tapping mode. In this methodology, the cantilever is forced to oscillate with its resonance frequency. In the vicinity of the surface, the resonant frequency is shifted as a result of tip-surface interaction, resulting in amplitude reduction with respect to the free oscillations (Figure 2.2B). In this regime, the tip taps de surface in the lowest point of oscillation. During scanning the feedback system modulates the cantilever vertical position so that to maintain constant amplitude. The AFM image representation is similar to a geographical map, where the colour corresponds to the relief height.
The two isolates were cultivated in 10 mL of MB during 4 days at 30ºC with agitation (200 rpm) under natural light. The cultures were centrifuged at 4000 rpm for 10 minutes at 4°C, washed with 1x Phosphate Buffered Saline (PBS) buffer (Invitrogen) and diluted 1:100 in the same buffer. A droplet of the bacterial suspension (10 µl) was placed onto a freshly cleaved mica substrate, allowed to air dry and after washing with PBS, the sample was dried with a stream of nitrogen. AFM images were acquired in air at room temperature at a scan rate of 1.5–1.8 Hz, carried out on a Multimode Nanoscope IIIa Microscope (Digital Instruments, Veeco), using etched silicon cantilevers (TESP, Bruker), with spring constants between 20 and 80 Nm-1 and resonance frequency of ca. 320 kHz.
2.5– Nucleic acid extraction
DNA extraction was performed from the cultures of bacteria isolates and directly from sediment samples. DNA quality was determined with agarose gels agarose gel electrophoresis: 1% agarose in 0.5x Ultrapure tris(hydroxymethyl)amino methane (Tris)-Borate-EDTA (TBE) Buffer (Invitrogen) at 90 V for 1h30, with application of 5 µL sample (2 µL of Gel Loading Dye Orange 6x (BioLabs)) and 1 Kb Plus DNA Ladder (Invitrogen), and was used ethidium bromide (25 mg ml-1) for staining the gels which were photographed under ultraviolet light with an image acquisition system UVITEC. The concentration of DNA solutions was assessed with Qubit fluorometer (Invitrogen/ Life Technologies) using Qubit® dsDNA BR Assay Kit, following the manufacturer’s instructions.
Roseobacter denitrificans Och 114T (CIP 104266, Collection de I’Institut Pausteur), an AAnPB reference strain (Shiba 1991) was used in whole process, since DNA extraction, as a positive control.
2.5.1 – Isolates DNA extraction
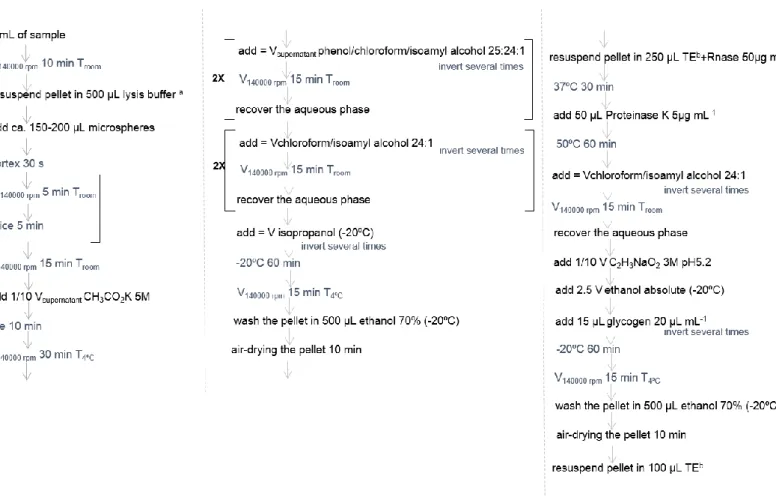
DNA extraction was performed by different protocols in accordance with the flowchart of Figure 2.3.
Figure 2.3: Schematic representation of the workflow used for DNA extraction. a Lysis
buffer: 50 mM etlylenediamine tetraacetic acid (EDTA),, 250 mM NaCl, 0.5% sodium dodecyl sulphate (SDS), pH 8; b TE: Tris 10 mM, pH 8-HCl with 1 mM EDTA
2.5.2 – Community DNA extraction
For extracting DNA from environmental samples, containing high amounts of humic substances, polyphenolics, polysaccharides and other inhibitors, was essentially resort to a DNA extraction commercial kit. Only in this way was possible to get high extraction yield and DNA with quality. Total genomic DNA was extracted from c.a. 0.25 g of lyophilized contact core sediment (4 seasons x 3 sediment types x 5 replicates), using the PowerSoil DNA Isolation Kit (MO-BIO) and following the manufacturer’s instructions.
2.6 – Polymerase Chain Reaction (PCR)
Amplification was carried out using a thermocycler T1 (Biometra). The primer sequences for 16S rRNA and pufM genes amplification are provided in table 2.1. The protocol for pufM amplification was optimized and validated using Roseobacter denitrificans Och 114T as reference strain.
Table 2.1: Primers used for amplification in PCR.
Primer Name Sequence Target Reference
104F 5’ GGCGVAYGGGTGAGTAA 3’ 16S rRNA Chaves 2005
1392R 5’ ACGGGCGGTGTGTRC 3’ 16S rRNA Muyzer et al. 1996
PufM uniF 5’ GGNAAYYTNTWYTAYAAYCCNTTYCA 3’ pufM Yutin et al. (2005)
PufM uniR 5’ YCCATNGTCCANCKCCARAA 3’ pufM Yutin et al. (2005)
M13 (-20) Forward 5’ GTAAAACGACGGCCAG 3’ 5’ terminus of lacZ TA cloning Kit (Invitrogen)
M13 Reverse 5’ CAGGAAACAGCTATGAC 3’ 5’ terminus of lacZ TA cloning Kit (Invitrogen)
341F 5’ CCTACGGAGGCAGCAG 3’ 16S rRNA Muyzer et al. 1996
534R 5’ ATTACCGCGGCTGCTGG 3’ 16S rRNA Muyzer et al. 1996
All primers used were produced and HPLC purified by Invitrogen. (S = G or C; W = A or T; N =A, C, G or T; Y = T or C; K = G or T)
The reaction mixtures used are described in table 2.2.
Table 2.2: Reaction mixtures used for amplification in PCR.
16S rRNA pufM 5’ terminus of lacZ
5-10 ng DNA template 5-10 ng DNA template 3 μL lysate
0.5 μL dNTPs (10 mM) 0.5 μL dNTPs (10 mM) 0.5 μL dNTPs (10 mM) 0.2 μL primer forward (50 μM) 0.5 μL primer forward (50 μM) 0.5 μL primer forward (50 μM) 0.2 μL primer reverse (50 μM) 1 μL primer reverse (50 μM) 0.5 μL primer reverse (50 μM) 2.5 μL PCR buffer (10X)a (Invitrogen) 2.5 μL PCR buffer (10X)a (Bioline) 2.5 μL PCR buffer (10X)a (Invitrogen)
0.75 μL MgCl2 (50 mM)a (Invitrogen) 1 μL MgCl2 (50 mM)a (Bioline) 1 μL MgCl2 (50 mM)a (Invitrogen)
0.2 μL Taq DNA Polymerase (5 U μL-1)
(Invitrogen)
0.4 μL Taq DNA Polymerase (5 U μL-1)
(Bioline)
0.2 μL Taq DNA Polymerase (5 U μL-1)
(Invitrogen)
1.25 μL BSA (0.1%) 1.25 μL BSA (0.1%) --- ddH2O up to 25 μL ddH2O up to 25 μL ddH2O up to 25 μL
a supplied by polymerase manufactures. dNTP-deoxynucleoside triphosphate (Invitrogen). BSA-bovine
serum albumin (Invitrogen)
Template DNA dilutions are performed with UltraPure DNsase/RNase-Free Distilled Water (Invitrogen).
The amplifications were executed applying the following program provide in table 2.3 and table 2.4.
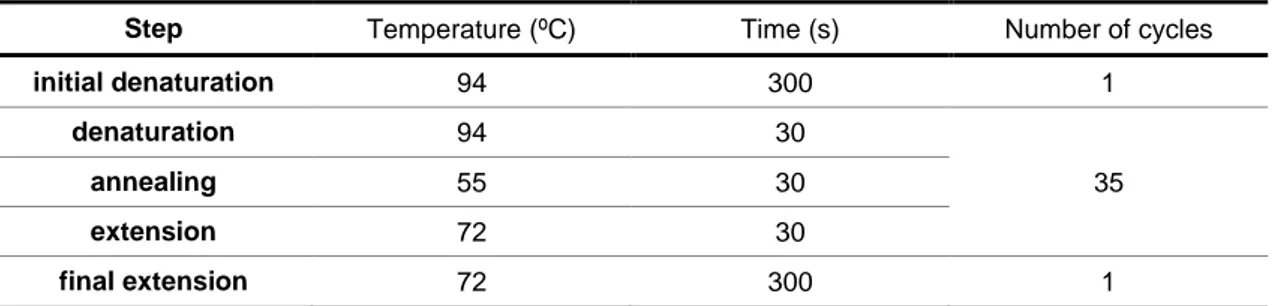
Table 2.3: PCR cycling conditions for 16S rRNA gene amplification.
Step Temperature (ºC) Time (s) Number of cycles
initial denaturation 94 300 1
denaturation 94 30
annealing 55 30 35
extension 72 30
The PCR product separation (1,300 bp) was performed by horizontal electrophoresis, using a 1.2% agarose gel prepared using 1x TBE buffer and a 100 bp DNA ladder (Invitrogen) as reference to confirm the amplification as a single PCR product.
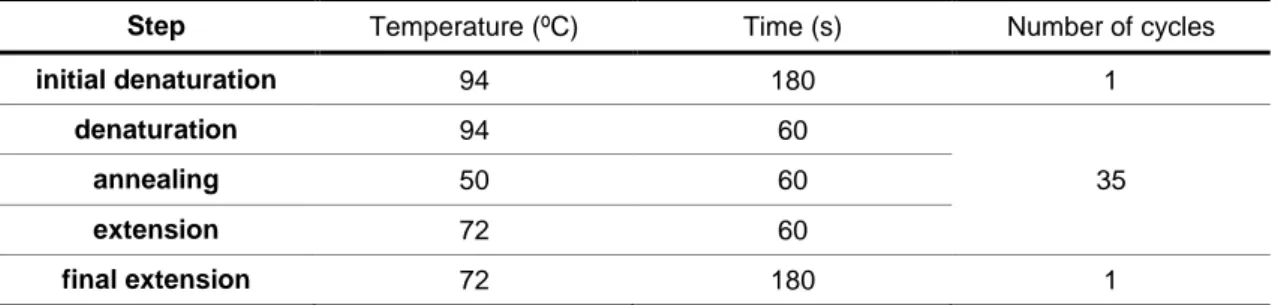
Table 2.4: PCR cycling conditions for pufM gene amplification.
Step Temperature (ºC) Time (s) Number of cycles
initial denaturation 94 180 1
denaturation 94 60
annealing 47.5 60 35
extension 72 60
final extension 72 180 1
The PCR product separation (200 bp) was performed by horizontal electrophoresis, using a 1.2% agarose gel prepared using 1x TBE buffer and a 100 bp DNA ladder (Invitrogen) as reference to confirm the amplification as a single PCR product.
2.7 – Cloning
The specific amplicons of pufM (200 bp) were gel-purified with the Wisard SV Gel and PCR Clean-Up System (Promega). To do so, high volumes of pufM gene PCR product (150 µL plus 5 µL of Gel Loading Dye Orange 6x (BioLabs) was separated by agarose gel electrophoresis (1.2% agarose, 3 hours at 100 V), using 100 bp DNA ladder (Invitrogen) as reference.
The purified products were ligated into pCRII according with the TA Cloning Kit Dual Promoter (Invitrogen) protocols. The transformation of the ligations occurred into chemically competent Escherichia coli XL1-BlueMRF’ (Stratagene).
Screening of putative recombinant clones (white colonies) was performed by PCR amplification using the vector primers M13 (-20) forward and M13 reverse primers (table 2.1) as indicated by the manufacture. The reaction mixtures are in table 2.2 and the PCR cycling conditions in table 2.5.
Table 2.5: PCR cycling conditions for clone amplification.
Step Temperature (ºC) Time (s) Number of cycles
initial denaturation 94 180 1
denaturation 94 60
annealing 50 60 35
extension 72 60
Clone lysates were obtained by the resuspending of a white colony in TE with Tween 20 (Sigma-Aldrich) (0.1%) and incubation for 10 min at 100ºC.
Three µL of PCR products (with 2 µL of Gel Loading Dye Orange 6x (BioLabs)) were visualised by electrophoresis on 1% agarose gel during 1h30 at 90V, using 100 bp DNA ladder (Invitrogen) as reference to confirm the expected molecular weight of the clones.
2.8 – Sequencing
PCR product (16S rRNA gene and the clones of pufM) purification was carried out with JetQuick PCR Product Purification Spin Kit (Genomed).
The sequences were obtained in a CEQ 2000-XL (Beckman DNA automated sequencer) following the standard protocols. The service was provided by the Sequencing Unit of BioFIG (Microbiology and Biotechnology Laboratory).
Sequences identification was obtained by comparison with GenBank database using the
Basic Local Alignment Search Tool (BLAST, Altschul et al. 1990)
(http://www.ncbi.nlm.nih.gov/genbank/).
2.9 – Phylogenetic tree of pufM isolates
All sequences were visually inspected and vector sequences were removed. Then, these sequences and the 58 most representative pufM sequences from GenBank database were used for phylogenetic analysis. To do that the sequences were aligned using the CLUSTAL X multiple alignment program (v 1.8) (Thompson et al. 1997). The automatic alignment of the sequences was corrected manually in BioEdit sequence editor software (v 7.1.3) (Hall 1999).
To localize phylogenetically the pufM isolates in relation to others isolates using this gene, the Bayesian inference was applied, using the software MrBayes (v. 3.0) (Ronquist & Huelsenbeck 2003). The evolutionary model of base substitutions tested was the General Time Reversible (GTR, Rodriguez et al. 1990) with gamma distribution of substitution rate (Yang 1993). Four parallel chains of 1 million generations were run (Metropolis-Coupled MCMC) and trees were sampled every 100 generations. From these trees that were sampled after the process had reached a stationary stage (burning = 2000), a consensus tree was computed to obtain a posteriori estimates for probabilities. At the end the final tree was visualized with TreeView software (v.1.6.6) (Page 2007). The tree was rooted using Chloroflexus aggregans (X07847) as the out-group specie.
The pufM sequences of cultured isolates obtained in this study were deposited in the GenBank database under the accession numbers JX896438, JX896439 and JX896440.
2.10 – Temperature Gradient Gel Electrophoresis (TGGE)
TGGE separates DNA fragments of the same molecular weight but with different nucleotide sequences (Muyser & Smalla, 1998). The separation by electrophoresis of these DNA fragments
in a mixture is obtained using polyacrylamide gels in the presence of a thermal gradient and it is based on the differential migration of the partially denatured DNA fragments. All fragments migrate over the thermal gradient, until the melting starts to occur and their migration become dependent of its denaturation kinetics. This migration depends on the location of melting domains (defined DNA regions that are partially denatured during the temperature gradient) which, ultimately, depends on the nucleotide sequence.
The PCR reaction for the 16S rRNA gene amplification was performed with primers 341F and 534R and for the pufM gene with PufM uniF and PufM uniR (table 2.1). The composition of reaction mixtures is indicated in table 2.2 and the conditions of PCR in tables 2.3 and 2.4 for 16S rRNA and pufM genes, respectively. 1 µL of PCR product was used as template in a second amplification, using the same primers but with the introduction of a GC clamp in the forward primers (5’ CGCCCGCCGCGCCCCGCGCCCGTCCCGCCGCCCCCGCCCG 3’). This GC clamp must be added to the primers to construct a domain of difficult denaturation, allowing a slow transition from native state to a semi-melted, thus increasing the TGGE resolution (Muyzer et al. 1996). The second PCR conditions were the same as the first except that was utilized only half of the Taq DNA polymerase and BSA was removed. PCR products were visualized with 1.2% agarose gel electrophoresis for 2h, using 100bp DNA ladder (Invitrogen) as reference to confirm the amplification of a single PCR product with the expected molecular height.
Five µL of reamplified PCR products were resolved by TGGE in a 6% acrylamide/bisacrylamide (60:1) gel, with 8 M urea, 2% glycerol and 20% formamide gel with 1x Tris-acetate-EDTA (TAE) buffer (40mM Tris, 20mM acetic acid, and 1mM EDTA, pH 8) at 120 V for 20 h with thermal gradient of 44-52ºC. Gel preparation and the assembly of the whole system to run were done according to the manufacturer’s instructions of the equipment used: TGGE Maxi System (v. 5.12) (Biometra). The gels were silver-stained (e.g. Benbouza et al. 2006) and were photographed with white light (UVITEC).
The electrophoresis parameters suitable for the separation of pufM fragments had to be optimized (Muyser & Samlla 1997). The thermal gradient appropriate to products separation was determined using a perpendicular gel and the running time using a travel gel, according to the manufacturer. The final conditions for the electrophoresis run were 120 V during 20h with a thermal gradient of 50-60ºC.
TGGE banding patterns were analysed with the software Bionumerics (v. 6.6) (Applied Maths). The similarity between each pair of samples was calculated with Dice similarity coefficient between the corresponding band profiles, using the software option “pairwise comparison”. The Dice coefficient is calculated by the formula:
𝑆𝐷 = 2𝑁𝑎𝑏
𝑁𝑎 + 𝑁𝑏
in which Na and Nb are the number of bands in the profile A and B, respectively, and Nab the number of common bands between the two profiles. Uncertain bands were not considered and 1% band position tolerance was used. Dendrograms were generated from the Dice similarity
matrixes using the unweighted pair group method with arithmetic averages (UPGMA). To evaluate the reliability of dendrograms the cophenetic correlation between the dendrogram-derived similarities and the matrix similarities was calculated for each cluster and for the whole dendrogram. The internal consistency of each cluster was evaluated by the calculation of standard deviations associated their average value of cophenetic correlation (Bionumerics v. 6.6 instruction manual). The consensus dendrogram was built using the convergence matrix, calculated as a nonlinear function of the similarity matrices corresponding to 16S rDNA and pufM, giving the same weight to the results obtained with each gene.
2.11 – Diversity index
The Shannon diversity index and evenness were determined for each sample, based on TGGE profiles obtained for both 16S rRNA gene and pufM gene fingerprints, using the following formulas:
𝐻′= − ∑ 𝑝𝑖 × ln(𝑝𝑖) 𝑠
𝑖=1
in which s is the total number of different operational taxonomic units (OTUs), or richness, and pi the proportion of individuals that constitute each OTU. The evenness index, which is derived from Shannon index results from the transformation:
𝐽′= 𝐻′ ln(𝑠)⁄
The number of OTUs was assumed as the number of bands in the TGGE profiles and the band intensity was used as an estimative for species abundance. Band intensity was obtained with Bionumerics software (v. 6.6) (Applied Maths).
The final goal was to investigate trends in diversity, which was achieved by plotting the diversity indices against time (seasons) and the type of sediment. All calculations and graphs were made in Microsoft Excel (v. Office 2007) and R (R Development Core Team 2010, http://www.r-project.org/).
2.12 – Statistical analysis
To evaluate if the sample of richness, evenness and Shannon diversity indices for different types of sediments and seasons have a normal distribution and homoscedasticity the Shapiro-Wilks test (Shapiro & Shapiro-Wilks 1965) and the Bartlett test (Bartlett 1973), respectively, were used. The Friedman nonparametric test (Friedman 1937) was applied to these data.
To investigate the relationship between AAnPB abundance and diversity throughout the year, the Spearaman non-parametric correlation rank coefficient of (pω) was calculated. Effects were considered significant at p-value < 0.05. All statistical analysis was carried out using R (R Development Core Team 2010, http://www.r-project.org/).
3. RESULTS AND DISCUSSION
3.1 – Seasonal evolution of the sampling sites
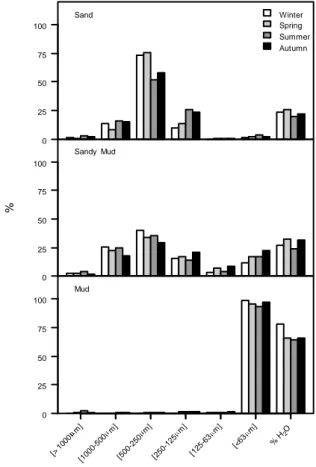
Granulometric analysis showed that the sediment from the three sampling sites remained relatively stable throughout the year (Figure 3.1). The sandy site was dominated by particles between 500 and 250 µm size; the sandy muddy site showed similar proportions of the different size fractions; and the muddy site was dominated by particles < 63 µm. Water content was higher in the muddy site and lower in the sandy site. The only variations to this pattern were verified in the sand during the summer and autumn when there was a reduction of the fraction 500-250 μm associated with an increase in 250-125 μm sediment fraction. There was also an increase of water in mud during the winter due to a higher precipitation and lower temperatures typical of this season (Figure 3.1).
The choice of places that represented the different type of sediments in estuary was correct: the sediment profile maintained the phi scale classification (Krumbein & Sloss 1963) of sand, sandy mud and mud in all seasons. This consistency during a year is very important to evaluate the effect of changing season without the influence of the sediment type.
Figure 3.1: Seasonal variation in the grain size fractions and water content of the studied sediments (sand, sandy mud and mud) of Tagus estuary.
3.2 – Cultivated bacteria diversity
0 25 50 75 100 Sand Winter Spring Summer Autumn Sandy Mud 0 25 50 75 100 Mud 0 25 50 75 100 [> 10 00 m] [10 00-50 0m] [50 0-2 50 m] [25 0-1 25 m] [12 5-6 3m] [<63 m] % H 2 O %
3.2.1 – Phenotypic characterization
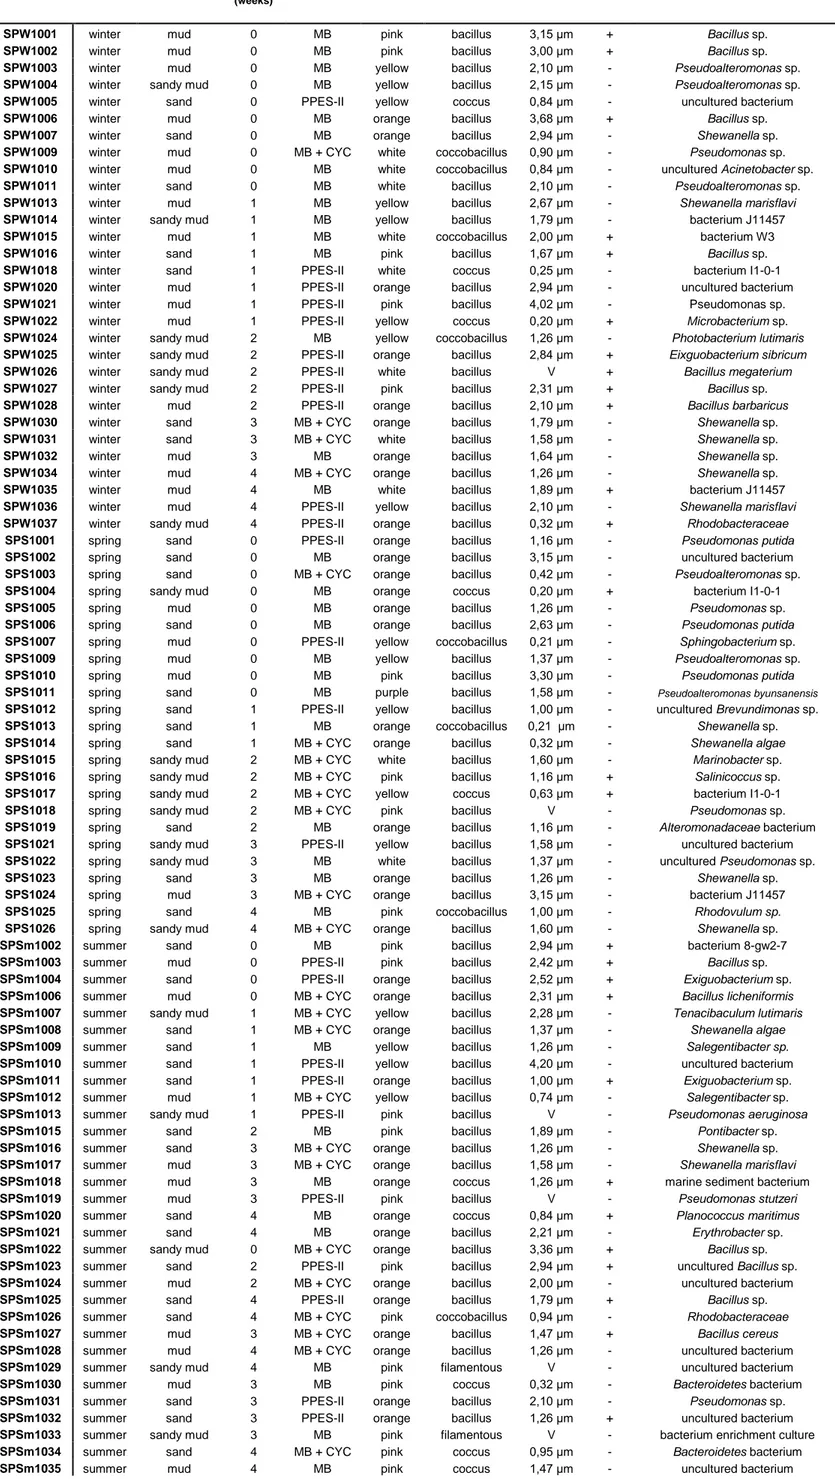
A total of 124 cultured isolates were obtained from the different types of sampled sediment during four seasons. The table 3.1 lists all the bacterial isolates and the season and sediment type from which they were isolated. In this table is referred to the culture medium used in the isolation and the incubation time. Some morphologic characteristics of isolates as the colour of colonies and the light microscope observation data (shape, size and Gram of bacterial cells) are also indicated. Finally, it is given its identification by sequencing the 16S rRNA gene.
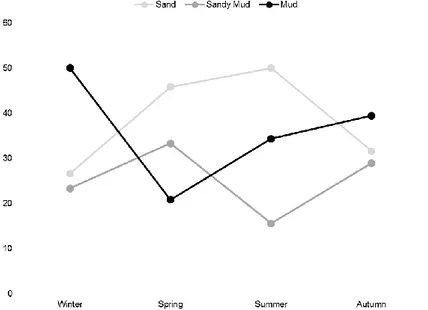
The evolution of isolates during the year in the different sediments is presented in the Figure 3.2.
Figure 3.2: Seasonal variation of bacterial isolates in different type of sediment. The
values are presented as a percentage by season.
In Figure 3.2 can be seen that bacteria were distributed over all type of sediments throughout the year. It is also interesting to verify that in the warm seasons (spring and summer) the sand was the sediment with more bacterial isolates, while in the cold seasons (winter and fall) were more cultivable bacteria in the mud. The sandy mud had a low distribution of bacteria throughout the year in relation to other sediments.
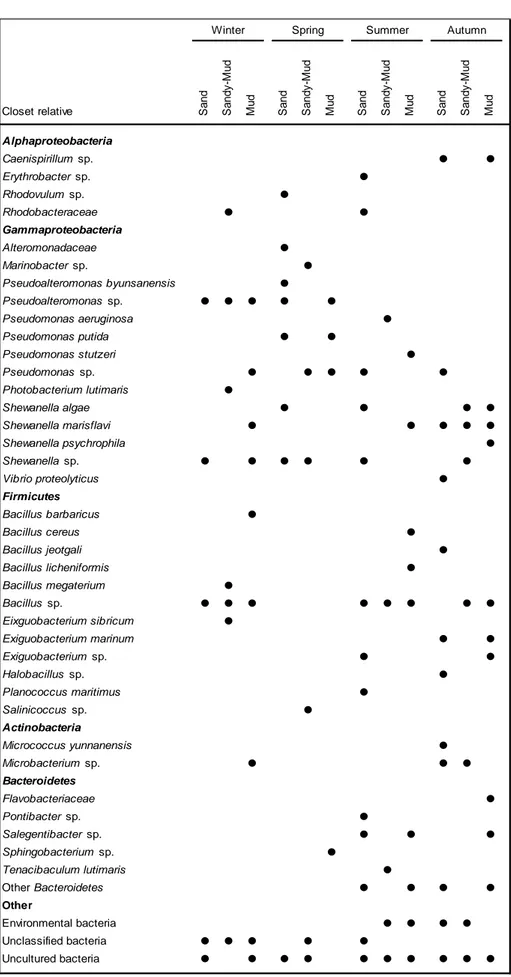
3.2.2 – 16S rRNA diversity
The bacterial diversity in estuarine environments is expected to be high due to the mixing of seawater and freshwater associated to the ressuspension of sediments and particles from many sources.
Culture-dependent and independent studies suggest that there are habitat-specific types of AAnPB, revealing differences in the composition of AAnPB communities between oceanic,