portuguese emigration
Portuguese Emigration
Factbook 2016
Rui Pena Pires*, Inês Vidigal**, Cláudia Pereira*, Joana Azevedo* e Carlota Moura Veiga*
* Instituto Universitário de Lisboa (ISCTE-IUL),
Centro de Investigação e Estudos de Sociologia (CIES-IUL), Lisboa, Portugal ** PORDATA, Base de Dados Portugal Contemporâneo Lisbon, Portugal;
Instituto Universitário de Lisboa (ISCTE-IUL),
Portuguese Emigration Factbook 2016 was co-ordinated by Rui Pena Pires
and compiled and prepared by a research team from the Observatório da Emigração at the Instituto Universitário de Lisboa (ISCTE-IUL), CIES-IUL, Lisboa, Portugal: Rui Pena Pires, Inês Vidigal, Cláudia Pereira, Joana Azevedo, and Carlota Moura Veiga.
Please cite this publication as: Observatório da Emigração (2017), Portuguese Emigration Factbook 2016, Lisbon, Observatório da Emigração, CIES-IUL, ISCTE-IUL. DOI: 10.15847/CIESOEMFB2016.
First published May 2017 by Observatório da Emigração.
ISBN:
DOI: 10.15847/CIESOEMFB2016 URI:
Tables and charts are provided in Excel format.
Just type the link at the beginning of each chapter to obtain the corresponding file.
The Emigration Observatory (OEm) is an independent technical and research structure within the Centre for Research and Studies in Sociology (CIES-IUL) of ISCTE – University Institute of Lisbon. The Observatory is based on a partnership between the CIES-IUL, the Institute of Sociology (IS-UP) of the University of Porto, and the Centre for Geographical Studies (CEG) and the Centre for Research in Economic and Organizational Sociology (SOCIUS/CSG), both of the University of Lisbon. The Observatory is supported by the Portuguese Ministry of Foreign Affairs under a cooperation agreement.
Observatório da Emigração
Av. das Forças Armadas, ISCTE-IUL, 1649-026 Lisbon, Portugal Tel. (CIES-IUL): + 351 210464018
E-mail: [email protected] www.observatoriodaemigracao.pt
Public disclosure authorized
The OEm encourages dissemination of its work. You can copy, download or print this content for your own use, and you can include excerpts from this publication in your own documents, presentations, blogs, websites and teaching materials, provided that suitable acknowledgement of OEm as source is given.
Contents
List of tables, charts and maps ... 4
Signs, abbreviations and acronyms ... 7
Acknowledgments ... 8
Foreword and highlights ... 9
1 | Total emigration ... 13
Country statistical profile ... 15
Estimates of total emigration ... 17
International comparison ... 27
2 | Emigration to top destination countries ... 33
Summary ... 35 Inflows ... 38 Stocks ... 42 Citizenship ... 46 Consular data ... 52 3 | Remittances ... 55
Volume and composition ... 57
Changes ... 62 Economic weight ... 64 International comparison ... 65 Methodological remarks ... 69 Glossary ... 71 Metadata ... 75 References ... 84 Webography ... 87
List of tables, charts and maps
Tables
Table 1.1 Main social indicators: international comparison ... 15
Table 1.2 Main migration indicators: international comparison ... 16
Table 1.3 Permanent outflows of Portuguese emigrants: the historical background ... 17
Table 1.4 Estimates of the outflows of Portuguese emigrants, 2001-2015 ... 20
Table 1.5 Eurostat estimates of Portuguese net migration, 2004-2015 ... 21
Table 1.6 UN estimates of the stock of Portuguese-born emigrants, 1990-2015 ... 22
Table 1.7 Stock of Portuguese-born emigrants in EU and EFTA countries, 2000/2001 and 2010/11 ... 23
Table 1.8 Stock of Portuguese-born emigrants in OECD countries by age group and educational attainment, 2000/2001 and 2010/11 ... 25
Table 1.9 Net migration in EU and EFTA countries, 2015 ... 27
Table 1.10 Emigrants by country of origin, 2015 ... 29
Table 1.11 Emigration and immigration rates in EU countries, 2013 ... 31
Table 2.1 Main indicators of Portuguese emigration to top destination countries, 2015 or last year available ... 35
Table 2.2 Portuguese permanent inflows in top destination countries, 2015 or last year available ... 38
Table 2.3 Change in Portuguese permanent inflows in top destination countries, 2014-2015 or last two years available ... 41
Table 2.4 Stock of migrants born in Portugal in top destination countries, 2015 or last year available ... 42
Table 2.5 Change in the stock of migrants born in Portugal in top destination countries, 2014-2015 or last two years available ... 45
Table 2.6 Population with Portuguese citizenship in top destination countries, 2015 or last year available ... 46
Table 2.7 Change in the population with Portuguese citizenship in top destination countries, 2014-2015 or last two years available... 48
Table 2.8 Acquisition of citizenship by Portuguese in top destination countries, 2015 or last year available ... 49
Table 2.9 Change in the acquisition of citizenship by Portuguese in top
destination countries, 2014-2015 or last two years available... 51
Table 2.10 Stock of consular registrations in top destination countries, 2015 or last year available ... 52
Table 2.11 Change in the stock of consular registrations in top destination countries, 2014-2015 or last two years available ... 54
Table 3.1 Inward and outward remittance flows in Portugal, 2015 ... 57
Table 3.2 Top inward remittance flows in Portugal, 2015 ... 60
Table 3.3 Changes in inward remittance flows in Portugal, 2014-2015 ... 62
Table 3.4 Changes in economic weight of remittances in Portugal, 2014-2015 ... 64
Table 3.5 Top remittance-receiving countries, thousand US dollars, 2015 ... 65
Table 3.6 Top remittance-receiving countries, economic weight, 2015 ... 67
Charts
Chart 1.1 Permanent outflows of Portuguese emigrants: the historical background ... 19Chart 1.2 OEm Estimates of the outflows of Portuguese emigrants, 2001-2015 ... 20
Chart 1.3 Eurostat estimates of Portuguese permanent outflows and inflows, 2004-2015 ... 21
Chart 1.4 UN estimates of the stock of Portuguese-born emigrants, 1990-2015 ... 22
Chart 1.5 Major changes in the stock of Portuguese-born emigrants in EU and EFTA countries, 2000/2001 to 2010/11 ... 24
Chart 1.6 Stock of Portuguese-born emigrants in OECD countries by age group and educational attainment, 2000/2001 and 2010/11 ... 26
Chart 1.7 Net migration rates in EU and EFTA countries, except return flows, 2015 ... 28
Chart 1.8 Emigrants by country of origin, 2015 ... 30
Chart 1.9 Emigration and immigration rates in EU countries, 2013 ... 32
Chart 2.1 Portuguese permanent inflows in top destination countries, 2015 or last year available ... 39
Chart 2.2 Portuguese permanent inflows as a percentage of all permanent inflows in top destination countries, 2015 or last year available ... 40
Chart 2.4 Stock of migrants born in Portugal as a percentage of all foreign-born
in top destination countries, 2015 or last year available ... 44
Chart 2.5 Population with Portuguese citizenship in top destination countries, 2015 or last year available ... 47
Chart 2.6 Acquisition of citizenship by Portuguese in top destination countries, 2015 or last year available ... 50
Chart 2.7 Stock of consular registrations in top destination countries, 2015 or last year available ... 53
Chart 3.1 Top inward remittance flows in Portugal, thousand euros, 2015 ... 61
Chart 3.2 Changes in top inward remittance flows in Portugal, nominal values, thousand euros, 2014-2015 ... 63
Chart 3.3 Changes in economic weight of remittances in Portugal, 2014-2015 ... 64
Chart 3.4 Top remittance-receiving countries, economic weight, 2015 ... 68
Maps
Map 1.1 Stock of Portuguese-born emigrants in EU and EFTA countries, 2010/11... 24Map 2.1 Portuguese permanent inflows in top destination countries, 2014 or last year available ... 36
Map 2.2 Stock of migrants born in Portugal in top destination countries, 2014 or last year available ... 37
Map 3.1 Inward remittance flows in Portugal, 2014 ... 59
Map 3.2 Outward remittance flows in Portugal, 2014 ... 59
Signs, abbreviations and acronyms
.. missing value, not applicable or not available
EFTA European Free Trade Association
EU European Union
OECD Organisation for Economic Co-operation and Development PALOP Países Africanos de Língua Oficial Portuguesa
(Portuguese-speaking African countries)
ISO codes for countries
AGO Angola BEL Belgium BRA Brazil CAN Canada CHE Switzerland DEU Germany ESP Spain FRA France GBR United Kingdom ITA Italy LUX Luxemburg MOZ Mozambique NLD Netherlands NOR Norway
USA United States of America
Acknowledgments
The authors would like to thank the Directorate-General of Consular Affairs and Portuguese Communities (DGACCP), from the Cabinet of the Secretary of State of Portuguese
Communities Abroad, for all the support provided. We wish to acknowledge the help provided by the national statistical institutes from the following countries: Brazil (Instituto Brasileiro de Geografia e Estatística, IBGE), France (Institut Nacional de la Statistique et des Études
Économiques, INSEE), Germany (Statistisches Bundesamt Deutschland, Destatis), Italy (Istituto Nazionale di Statistica, ISTAT), Luxemburg (Institut National de la Statistique et des Études Économiques du Grand-Duché du Luxembourg, STATEC), Mozambique (Instituto Nacional de Estatística, INE), Netherlands (Centraal Bureau voor de Statistiek, CBS), Spain (Instituto Nacional de Estadística, INE), Switzerland (Office Fédéral de la Statistique, OFS) and United Kingdom (Office for National Statistics, ONS).
We appreciate the data from the following institutions: Angolan Consulates in Portugal (Lisbon and Oporto), Federal Office for Migration and Refugees of Germany (Bundesamt für Migration und Flüchtlinge), Federal Office of Migrations of Switzerland (Office Fédéral des Migrations), Department for Work and Pensions of UK and the Brazilian International Migration Observatory (Observatório das Migrações Internacionais, OBMigra).
Foreword and highlights
General trends
01. Portuguese emigration ceased to grow. However, it maintains values that are clearly higher
than 100 thousand exits per year. In recent history, these values only paralleled those of the 1960s and 1970s. The existence of a large Portuguese emigrant population now constitutes a pole of attraction of new migrants, as it allows the dissemination of information on migratory alternatives and guarantees support in the first stages of the settlement processes (network effects). It is therefore unlikely in the coming years to reduce the volume of emigration to pre-crisis levels, despite the resumption of growth in the Portuguese economy.
02. In cumulative terms, Portugal continues to be the European Union country with more
emigrants in proportion to the resident population (considering only countries with more than one million inhabitants). According to the latest estimates by the United Nations, in 2015, the number of emigrants born in Portugal has surpassed two million and three hundred thousand, which means that about 22% of Portuguese live outside the country.
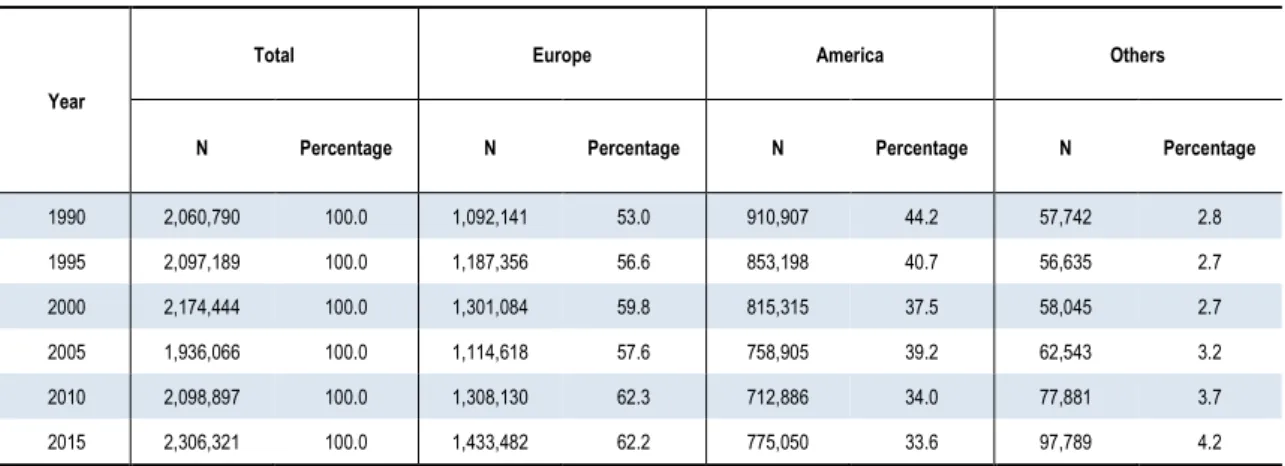
03. Since the 1960s, Portuguese emigration was directed mainly towards European
destinations. In recent decades, the percentage of Portuguese living in Europe has increased from 53%, in 1990, to 62%, in 2015, according to United Nations estimates.
04. The review of the statistical series estimated by the Observatory on total emigration points
to the existence of a peak of emigration in 2013, higher than the one estimated so far, of around 120,000 outflows, as well as a progressive slower descent, in 2014 and 2015, to values around 110 thousand exits.
Portuguese permanent inflows in main destination countries
05. The analysis of the evolution of Portuguese permanent inflows in the main countries of
with growth of more than 30% compared to 2014. In contrast, emigration to Germany and Switzerland decreased for the second consecutive year continued since 2013, although still at a high level of outflows. Data on the permanent inflows of Portuguese in France point to a stabilization of the flow at high values: on average, more than 18 thousand entries per year between 2010 and 2015.
06. The United Kingdom continues to be the country to where most Portuguese emigrate:
32,300 in 2015, 30,500 in 2014. The main destinations of outflows are France (18.4 thousand in 2013), Switzerland (12.3 thousand in 2015) and Germany (9.2 thousand in 2015). Outside of Europe, the main destinations for Portuguese emigration are all Portuguese-speaking
countries: Angola (6.7 thousand in 2015), Mozambique (4.0 thousand in 2014) and Brazil (1.3 thousand in 2015).
Migrants born in Portugal living in the main countries of destination (stock)
07. As a result of a long history of emigration in the past, and of the increase of Portugueseinflows in the current decade, France continues to be the country where more migrants born in Portugal live: more than 600 thousand in 2013, last year for which official information is available. In addition, more than 100,000 Portuguese emigrants live in Switzerland (217,000 in 2015), the United States (177,000 in 2014), Canada (140,000 in 2011), the United Kingdom (140 (138 thousand in 2010), Germany (110 thousand in 2015) and Spain (107 thousand in 2015).
08. Two facts to emphasize. First, the rise of the United Kingdom in the ranking of the
countries where most Portuguese emigrants live (5th place in 2015) and doubts about the sustainability of this trend in post-Brexit. Secondly, the fact that in Spain the resumption of emigration has not yet offset the annual number of outflows due to the return or
re-emigration that followed the 2008 crisis, which explains the 8% reduction between 2014 and 2015, of the number of Portuguese who lived there, despite the growth of Portuguese inflows in those same years.
Remittances received
Portuguese migrants, France and Switzerland, were also the countries of origin of more than half of the remittances received in Portugal in 2015 (31% and 26%, respectively).
10. Among developed countries with the highest number of remittances received, Portugal
continues to be the one with the largest share of remittances in GDP. In relative terms, Portugal is the 17th country in the world with the most remittances as a percentage of GDP (considering only countries that received more than $ 1 billion in remittances in 2015).
1 | Total emigration
Country statistical profile
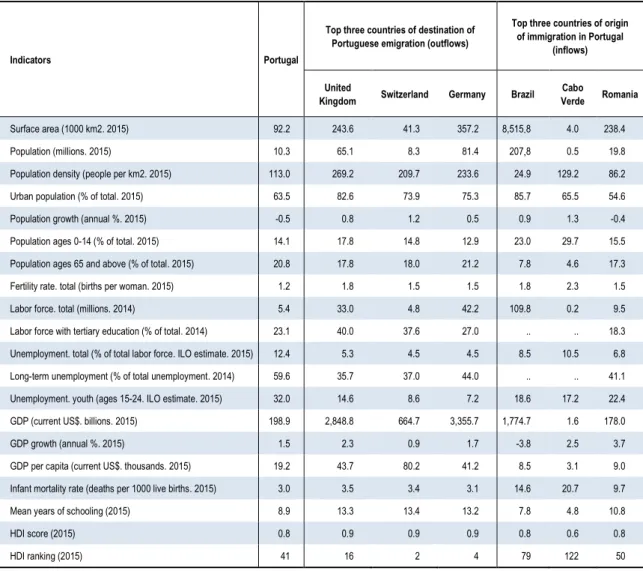
Table 1.1 Main social indicators: international comparison
Indicators Portugal
Top three countries of destination of Portuguese emigration (outflows)
Top three countries of origin of immigration in Portugal
(inflows) United
Kingdom Switzerland Germany Brazil Cabo
Verde Romania
Surface area (1000 km2. 2015) 92.2 243.6 41.3 357.2 8,515.8 4.0 238.4
Population (millions. 2015) 10.3 65.1 8.3 81.4 207,8 0.5 19.8
Population density (people per km2. 2015) 113.0 269.2 209.7 233.6 24.9 129.2 86.2
Urban population (% of total. 2015) 63.5 82.6 73.9 75.3 85.7 65.5 54.6
Population growth (annual %. 2015) -0.5 0.8 1.2 0.5 0.9 1.3 -0.4
Population ages 0-14 (% of total. 2015) 14.1 17.8 14.8 12.9 23.0 29.7 15.5
Population ages 65 and above (% of total. 2015) 20.8 17.8 18.0 21.2 7.8 4.6 17.3
Fertility rate. total (births per woman. 2015) 1.2 1.8 1.5 1.5 1.8 2.3 1.5
Labor force. total (millions. 2014) 5.4 33.0 4.8 42.2 109.8 0.2 9.5
Labor force with tertiary education (% of total. 2014) 23.1 40.0 37.6 27.0 .. .. 18.3
Unemployment. total (% of total labor force. ILO estimate. 2015) 12.4 5.3 4.5 4.5 8.5 10.5 6.8
Long-term unemployment (% of total unemployment. 2014) 59.6 35.7 37.0 44.0 .. .. 41.1
Unemployment. youth (ages 15-24. ILO estimate. 2015) 32.0 14.6 8.6 7.2 18.6 17.2 22.4
GDP (current US$. billions. 2015) 198.9 2,848.8 664.7 3,355.7 1,774.7 1.6 178.0
GDP growth (annual %. 2015) 1.5 2.3 0.9 1.7 -3.8 2.5 3.7
GDP per capita (current US$. thousands. 2015) 19.2 43.7 80.2 41.2 8.5 3.1 9.0
Infant mortality rate (deaths per 1000 live births. 2015) 3.0 3.5 3.4 3.1 14.6 20.7 9.7
Mean years of schooling (2015) 8.9 13.3 13.4 13.2 7.8 4.8 10.8
HDI score (2015) 0.8 0.9 0.9 0.9 0.8 0.6 0.8
HDI ranking (2015) 41 16 2 4 79 122 50
Note Top three countries of emigration and immigration with available data for, at least, the last three years.
Source Table by OEm, data from the World Bank, DataBank, World Development Indicators, updated 09/11/2015, and the
United Nations Development Programme (UNDP), 2016 Human Development Report (for mean years of schooling, HDI score and HDI ranking).
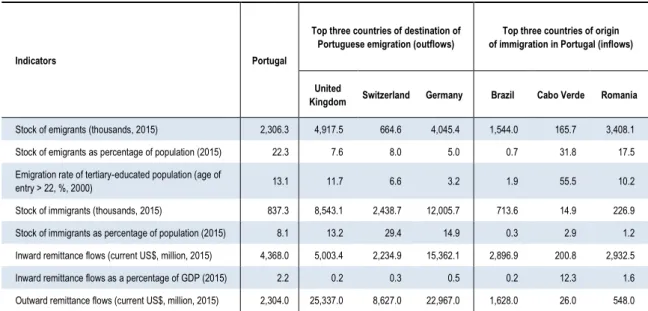
Table 1.2 Main migration indicators: international comparison
Indicators Portugal
Top three countries of destination of Portuguese emigration (outflows)
Top three countries of origin of immigration in Portugal (inflows)
United
Kingdom Switzerland Germany Brazil Cabo Verde Romania
Stock of emigrants (thousands, 2015) 2,306.3 4,917.5 664.6 4,045.4 1,544.0 165.7 3,408.1
Stock of emigrants as percentage of population (2015) 22.3 7.6 8.0 5.0 0.7 31.8 17.5
Emigration rate of tertiary-educated population (age of
entry > 22, %, 2000) 13.1 11.7 6.6 3.2 1.9 55.5 10.2
Stock of immigrants (thousands, 2015) 837.3 8,543.1 2,438.7 12,005.7 713.6 14.9 226.9
Stock of immigrants as percentage of population (2015) 8.1 13.2 29.4 14.9 0.3 2.9 1.2
Inward remittance flows (current US$, million, 2015) 4,368.0 5,003.4 2,234.9 15,362.1 2,896.9 200.8 2,932.5
Inward remittance flows as a percentage of GDP (2015) 2.2 0.2 0.3 0.5 0.2 12.3 1.6
Outward remittance flows (current US$, million, 2015) 2,304.0 25,337.0 8,627.0 22,967.0 1,628.0 26.0 548.0
Note Top three countries of emigration and immigration with available data for, at least, the last three years.
Source Table by OEm, data from the United Nations, Department of Economic and Social Affairs, Population Division (2015),
Trends in International Migrant Stock: Migrants by Destination and Origin (United Nations database,
POP/DB/MIG/Stock/Rev.2015) (stocks of emigrants and of immigrants); Migration Database with Age of Entry, 1900-2000 (emigration rate of tertiary-educated population); World Bank, World Bank, Bilateral Remittance Matrix 2015 (v. Oct 2016) (remittance flows).
Estimates of total emigration
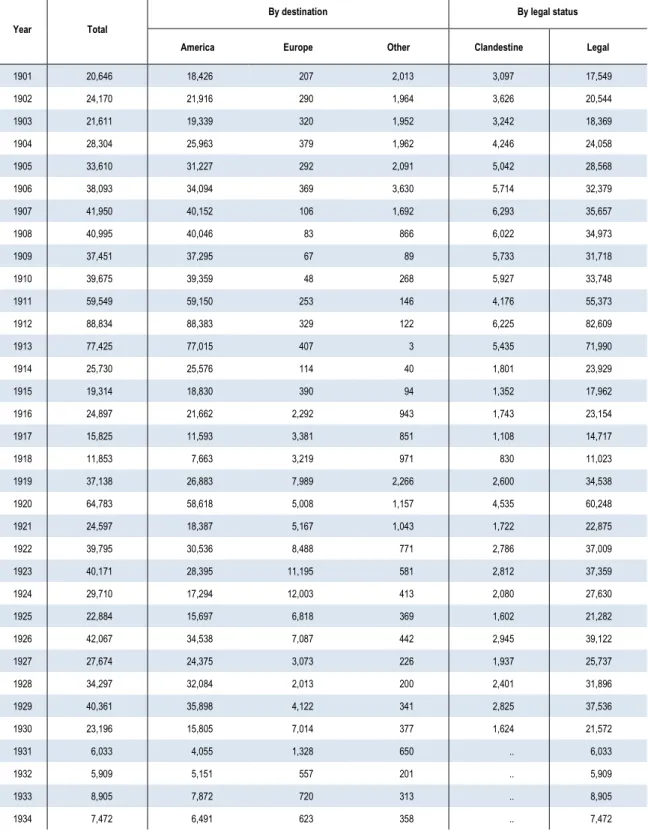
Table 1.3 Permanent outflows of Portuguese emigrants: the historical background
Year Total
By destination By legal status
America Europe Other Clandestine Legal
1901 20,646 18,426 207 2,013 3,097 17,549 1902 24,170 21,916 290 1,964 3,626 20,544 1903 21,611 19,339 320 1,952 3,242 18,369 1904 28,304 25,963 379 1,962 4,246 24,058 1905 33,610 31,227 292 2,091 5,042 28,568 1906 38,093 34,094 369 3,630 5,714 32,379 1907 41,950 40,152 106 1,692 6,293 35,657 1908 40,995 40,046 83 866 6,022 34,973 1909 37,451 37,295 67 89 5,733 31,718 1910 39,675 39,359 48 268 5,927 33,748 1911 59,549 59,150 253 146 4,176 55,373 1912 88,834 88,383 329 122 6,225 82,609 1913 77,425 77,015 407 3 5,435 71,990 1914 25,730 25,576 114 40 1,801 23,929 1915 19,314 18,830 390 94 1,352 17,962 1916 24,897 21,662 2,292 943 1,743 23,154 1917 15,825 11,593 3,381 851 1,108 14,717 1918 11,853 7,663 3,219 971 830 11,023 1919 37,138 26,883 7,989 2,266 2,600 34,538 1920 64,783 58,618 5,008 1,157 4,535 60,248 1921 24,597 18,387 5,167 1,043 1,722 22,875 1922 39,795 30,536 8,488 771 2,786 37,009 1923 40,171 28,395 11,195 581 2,812 37,359 1924 29,710 17,294 12,003 413 2,080 27,630 1925 22,884 15,697 6,818 369 1,602 21,282 1926 42,067 34,538 7,087 442 2,945 39,122 1927 27,674 24,375 3,073 226 1,937 25,737 1928 34,297 32,084 2,013 200 2,401 31,896 1929 40,361 35,898 4,122 341 2,825 37,536 1930 23,196 15,805 7,014 377 1,624 21,572 1931 6,033 4,055 1,328 650 .. 6,033
Year Total
By destination By legal status
America Europe Other Clandestine Legal
1935 9,140 8,228 434 478 .. 9,140 1936 12,484 12,024 .. 460 .. 12,484 1937 14,667 13,505 .. 1,162 .. 14,667 1938 13,609 11,290 .. 2,319 .. 13,609 1939 17,807 17,466 .. 341 .. 17,807 1940 13,226 13,013 .. 213 .. 13,226 1941 6,260 6,191 .. 69 .. 6,260 1942 2,214 2,108 .. 106 .. 2,214 1943 893 660 .. 233 .. 893 1944 2,424 2,168 .. 256 .. 2,424 1945 5,938 5,728 .. 210 .. 5,938 1946 8,275 8,123 .. 152 .. 8,275 1947 12,838 12,128 .. 710 .. 12,838 1948 12,343 11,474 .. 869 .. 12,343 1949 17,296 15,647 .. 1,649 .. 17,296 1950 21,892 21,491 401 .. .. 21,892 1951 34,015 33,341 674 .. 351 33,664 1952 47,407 46,544 863 .. 389 47,018 1953 39,962 39,026 936 .. 276 39,686 1954 41,190 40,234 956 .. 179 41,011 1955 30,147 28,690 1,457 .. 351 29,796 1956 28,096 26,072 2,024 .. 1,079 27,017 1957 33,894 32,150 1,744 .. 1,538 32,356 1958 35,600 29,207 6,393 .. 1,570 34,030 1959 34,754 29,780 4,974 .. 1,296 33,458 1960 35,159 28,513 6,646 .. 2,841 32,318 1961 38,572 27,499 11,073 .. 5,046 33,526 1962 43,002 24,376 18,626 .. 9,463 33,539 1963 55,218 22,420 32,798 .. 17,389 37,829 1964 75,576 17,232 58,344 .. 32,256 43,320 1965 91,488 17,557 73,931 .. 28,736 62,752 1966 111,995 33,266 78,729 .. 20,388 91,607 1967 94,712 28,584 66,128 .. 16,197 78,515 1968 96,227 27,014 69,213 .. 27,246 68,981 1969 155,672 27,383 128,289 .. 85,507 70,165 1970 183,205 22,659 160,546 .. 116,845 66,360 1971 158,473 21,962 136,511 .. 108,073 50,400 1972 115,545 20,122 95,423 .. 61,461 54,084 1973 129,732 22,091 107,641 .. 50,215 79,517
Chart 1.1 Permanent outflows of Portuguese emigrants: the historical background
Source Chart by OEm, data from Maria Ioannis Baganha and José Carlos Marques (2001), “População”, in Nuno Valério (ed.)
(2001), Estatísticas Históricas Portuguesas, vol. I, Lisbon, Instituto Nacional de Estatística, pp. 33-126. 0 20,000 40,000 60,000 80,000 100,000 120,000 140,000 160,000 180,000 200,000 19 01 19 03 19 05 19 07 19 09 19 11 19 13 19 15 19 17 19 19 19 21 19 23 19 25 19 27 19 29 19 31 19 33 19 35 19 37 19 39 19 41 19 43 19 45 19 47 19 49 19 51 19 53 19 55 19 57 19 59 19 61 19 63 19 65 19 67 19 69 19 71 19 73
Table 1.4 Estimates of the outflows of Portuguese emigrants, 2001-2015
Year
Source Instituto Nacional de Estatística (National Institute of Statistics)
[A]
Observatório da Emigração [B]
Total Permanent Temporary Current series New series
(in construction) 2001 20,223 5,396 14,827 40,000 .. 2002 27,358 8,813 18,545 50,000 .. 2003 27,008 6,687 20,321 60,000 .. 2004 .. 6,757 .. 70,000 .. 2005 .. 6,360 .. 75,000 .. 2006 .. 5,600 .. 80,000 .. 2007 .. 7,890 .. 90,000 .. 2008 .. 20,357 .. 85,000 .. 2009 .. 16,899 .. 75,000 .. 2010 .. 2,376 .. 70,000 .. 2011 100,978 43,998 56,980 80,000 85,000 (*) 2012 121,418 51,958 69,460 95,000 105,000 (*) 2013 128,108 53,786 74,322 110,000 120,000 (*) 2014 134,624 49,572 85,052 110,000 115,000 (*) 2015 101,203 40,377 60,826 110,000 (*) 110,000 (*)
Source Table by OEm, data from: [A] Instituto Nacional de Estatística (INE), Migratory Exit Movement Survey (1992 until 2007)
and Annual Estimates of Emigration (as from 2008), based on the Portuguese Labour Force Survey data, in Pordata, Contemporary Portugal Database; [B] OEm estimates based on destination countries permanent inflows data.
Chart 1.2 OEm Estimates of the outflows of Portuguese emigrants, 2001-2015
0 20,000 40,000 60,000 80,000 100,000 120,000 2001 2002 2003 2004 2005 2006 2007 2008 2009 2010 2011 2012 2013 2014 2015
Table 1.5 Eurostat estimates of Portuguese net migration, 2004-2015
Year Permanent outflows Permanent inflows Net migration
2004 6,757 21,093 14,336 2005 6,360 21,741 15,381 2006 5,600 22,741 17,141 2007 7,890 29,661 21,771 2008 20,357 29,718 9,361 2009 16,899 32,307 15,408 2010 23,760 27,575 3,815 2011 43,998 19,667 -24,331 2012 51,958 14,606 -37,352 2013 53,786 17,554 -36,232 2014 49,572 19,516 -30,056 2015 40,377 29,896 -10,481
Source Table by OEm, data from Eurostat, database on population and social conditions.
Chart 1.3 Eurostat estimates of Portuguese permanent outflows and inflows, 2004-2015
Source Chart by OEm, data from Eurostat, database on population and social conditions.
0 10,000 20,000 30,000 40,000 50,000 60,000 2004 2005 2006 2007 2008 2009 2010 2011 2012 2013 2014 2015
Table 1.6 UN estimates of the stock of Portuguese-born emigrants, 1990-2015
Year
Total Europe America Others
N Percentage N Percentage N Percentage N Percentage
1990 2,060,790 100.0 1,092,141 53.0 910,907 44.2 57,742 2.8 1995 2,097,189 100.0 1,187,356 56.6 853,198 40.7 56,635 2.7 2000 2,174,444 100.0 1,301,084 59.8 815,315 37.5 58,045 2.7 2005 1,936,066 100.0 1,114,618 57.6 758,905 39.2 62,543 3.2 2010 2,098,897 100.0 1,308,130 62.3 712,886 34.0 77,881 3.7 2015 2,306,321 100.0 1,433,482 62.2 775,050 33.6 97,789 4.2
Source Table by OEm, data from United Nations, Department of Economic and Social Affairs, Population Division (2015), Trends
in International Migrant Stock: Migrants by Destination and Origin (United Nations database, POP/DB/MIG/Stock/Rev.2015).
Chart 1.4 UN estimates of the stock of Portuguese-born emigrants, 1990-2015
Source Chart by OEm, data from United Nations, Department of Economic and Social Affairs, Population Division (2015), Trends
in International Migrant Stock: Migrants by Destination and Origin (United Nations database, POP/DB/MIG/Stock/Rev.2015). 0 500,000 1,000,000 1,500,000 2,000,000 2,500,000 1990 1995 2000 2005 2010 2015
Table 1.7 Stock of Portuguese-born emigrants in EU and EFTA countries, 2000/2001 and 2010/11
Country 2000/2001 2010/2011 Absolute change Percentage change
Total 859,013 1,160,425 301,412 35 Austria 950 1,634 684 72 Belgium 21,370 28,310 6,940 32 Bulgaria 13 99 86 n.s. Croatia .. 51 .. .. Cyprus 33 166 133 n.s, Czech Republic 39 368 329 n.s. Denmark 683 1,221 538 79 Estonia 0 39 39 .. Finland 141 355 214 152 France 581,062 617,235 36,173 6 Germany .. 75,110 .. .. Greece 292 336 44 15 Hungary 28 290 262 n.s. Iceland 104 416 312 300 Ireland 590 2,246 1,656 281 Italy 4,158 5,241 1,083 26 Latvia 1 32 31 n.s. Liechtenstein 331 .. .. .. Lithuania 3 .. .. .. Luxembourg 41,690 60,897 19,207 46 Malta .. 57 .. .. Netherlands 10,218 .. .. .. Norway 713 1,540 827 116 Poland 60 222 162 n.s. Romania 116 1,016 900 776 Slovakia 4 33 29 n.s. Slovenia 10 39 29 n.s. Spain 56,359 98,975 42,616 76 Sweden 2,514 2,974 460 18 Switzerland 100,975 169,458 68,483 68 United Kingdom 36,556 92,065 55,509 152
Note [n.s.] not significant; low reliability of data on Poland for 2010.
Map 1.1 Stock of Portuguese-born emigrants in EU and EFTA countries, 2010/11
Source Map by OEm, data from Eurostat, based on member states census data, 2010/2011.
Chart 1.5 Major changes in the stock of Portuguese-born emigrants in EU and EFTA countries, 2000/2001 to 2010/11
Note Low reliability of data on France for 2011. Missing data for Belgium, Germany and the Netherlands. Source Chart by OEm, data from Eurostat, based on member states census data, 2000-2001 and 2010/2011.
0 10,000 20,000 30,000 40,000 50,000 60,000 70,000 80,000 Switzerland United Kingdom Spain France Luxembourg
Table 1.8 Stock of Portuguese-born emigrants in OECD countries by age group and educational attainment, 2000/2001 and 2010/11
Indicator 2000/2001 2010/2011 Thousands % Thousands % Total 1,260 100.0 1,436 100.0 Age group 15-24 82 6.5 77 5.4 25-64 1,058 84.0 1,154 80.4 65+ 120 9.5 205 14.3 Educational attainment Low 847 69.4 876 62.1 Medium 295 23.4 384 26.8 High 78 6.2 151 10.5 Unknown 40 .. 24 ..
Note Data for ages groups in 2010/2011 includes partial estimations for Germany and Switzerland.
Source Table by OEm, data from OECD, Database on Immigrants in OECD Countries, DIOC 2000-2001 and DIOC 2010-2011
Chart 1.6 Stock of Portuguese-born emigrants in OECD countries by age group and
educational attainment, 2000/2001 and 2010/11
Source Chart by OEm, data from OECD, Database on Immigrants in OECD Countries, DIOC 2000-2001 and DIOC 2010-2011.
0% 20% 40% 60% 80% 100% 2001 2011 Age group 65+ 25-64 15-24 0% 20% 40% 60% 80% 100% 2001 2011 Educational attainment High Medium Low
International comparison
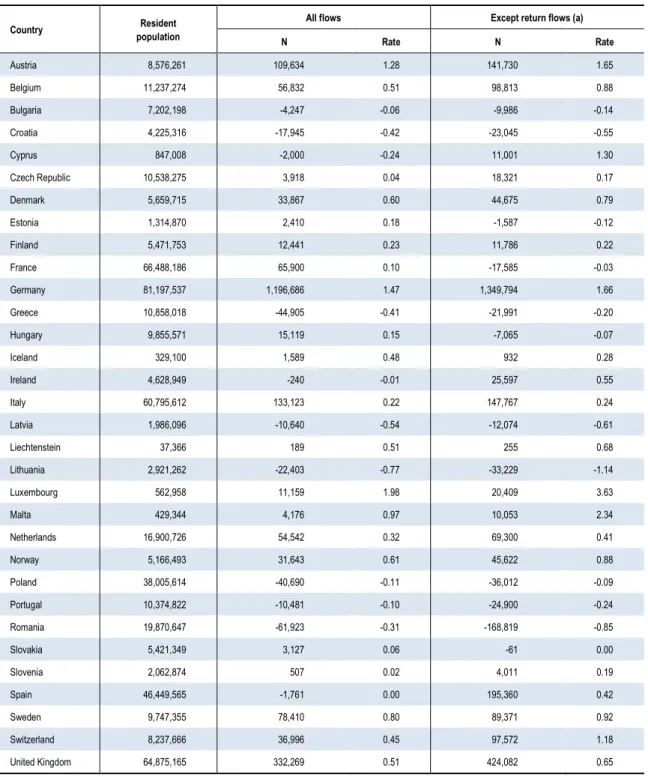
Table 1.9 Net migration in EU and EFTA countries, 2015
Country population Resident All flows Except return flows (a)
N Rate N Rate Austria 8,576,261 109,634 1.28 141,730 1.65 Belgium 11,237,274 56,832 0.51 98,813 0.88 Bulgaria 7,202,198 -4,247 -0.06 -9,986 -0.14 Croatia 4,225,316 -17,945 -0.42 -23,045 -0.55 Cyprus 847,008 -2,000 -0.24 11,001 1.30 Czech Republic 10,538,275 3,918 0.04 18,321 0.17 Denmark 5,659,715 33,867 0.60 44,675 0.79 Estonia 1,314,870 2,410 0.18 -1,587 -0.12 Finland 5,471,753 12,441 0.23 11,786 0.22 France 66,488,186 65,900 0.10 -17,585 -0.03 Germany 81,197,537 1,196,686 1.47 1,349,794 1.66 Greece 10,858,018 -44,905 -0.41 -21,991 -0.20 Hungary 9,855,571 15,119 0.15 -7,065 -0.07 Iceland 329,100 1,589 0.48 932 0.28 Ireland 4,628,949 -240 -0.01 25,597 0.55 Italy 60,795,612 133,123 0.22 147,767 0.24 Latvia 1,986,096 -10,640 -0.54 -12,074 -0.61 Liechtenstein 37,366 189 0.51 255 0.68 Lithuania 2,921,262 -22,403 -0.77 -33,229 -1.14 Luxembourg 562,958 11,159 1.98 20,409 3.63 Malta 429,344 4,176 0.97 10,053 2.34 Netherlands 16,900,726 54,542 0.32 69,300 0.41 Norway 5,166,493 31,643 0.61 45,622 0.88 Poland 38,005,614 -40,690 -0.11 -36,012 -0.09 Portugal 10,374,822 -10,481 -0.10 -24,900 -0.24 Romania 19,870,647 -61,923 -0.31 -168,819 -0.85 Slovakia 5,421,349 3,127 0.06 -61 0.00 Slovenia 2,062,874 507 0.02 4,011 0.19 Spain 46,449,565 -1,761 0.00 195,360 0.42 Sweden 9,747,355 78,410 0.80 89,371 0.92 Switzerland 8,237,666 36,996 0.45 97,572 1.18 United Kingdom 64,875,165 332,269 0.51 424,082 0.65
Chart 1.7 Net migration rates in EU and EFTA countries, except return flows, 2015
Note Except return flows: only outflows of nationals and inflows of foreigners. Source Chart by OEm, data from Eurostat, database on population and social conditions.
-2.00 -1.00 0.00 1.00 2.00 3.00 4.00 Luxembourg Malta Germany Austria Cyprus Switzerland Sweden Belgium Norway Denmark Liechtenstein United Kingdom Ireland Spain Netherlands Iceland Italy Finland Slovenia Czech Republic Slovakia France Hungary Poland Estonia Bulgaria Greece Portugal Croatia Latvia Romania Lithuania Percentage
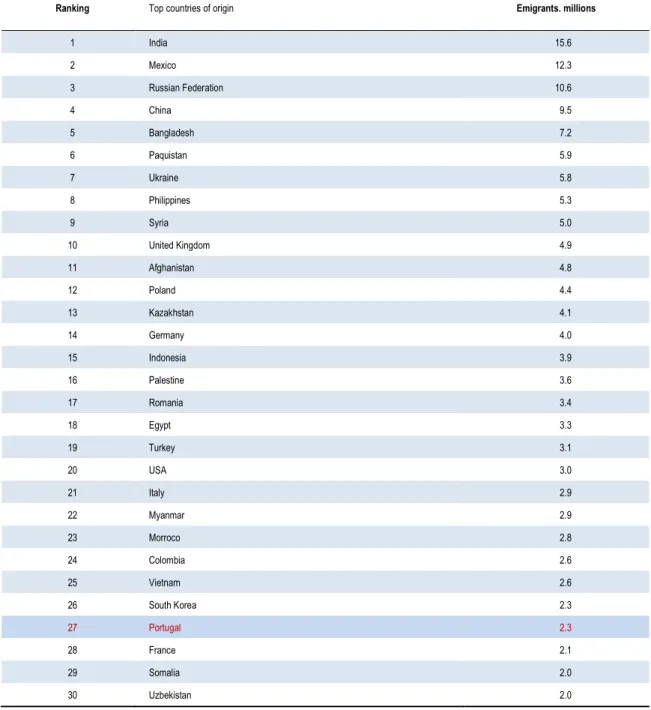
Table 1.10 Emigrants by country of origin, 2015
Ranking Top countries of origin Emigrants. millions
1 India 15.6 2 Mexico 12.3 3 Russian Federation 10.6 4 China 9.5 5 Bangladesh 7.2 6 Paquistan 5.9 7 Ukraine 5.8 8 Philippines 5.3 9 Syria 5.0 10 United Kingdom 4.9 11 Afghanistan 4.8 12 Poland 4.4 13 Kazakhstan 4.1 14 Germany 4.0 15 Indonesia 3.9 16 Palestine 3.6 17 Romania 3.4 18 Egypt 3.3 19 Turkey 3.1 20 USA 3.0 21 Italy 2.9 22 Myanmar 2.9 23 Morroco 2.8 24 Colombia 2.6 25 Vietnam 2.6 26 South Korea 2.3 27 Portugal 2.3 28 France 2.1 29 Somalia 2.0 30 Uzbekistan 2.0
Source Table by OEm, data from the United Nations, Department of Economic and Social Affairs, Population Division (2015),
Trends in International Migrant Stock: Migrants by Destination and Origin (United Nations database, POP/DB/MIG/Stock/Rev.2015).
Chart 1.8 Emigrants by country of origin, 2015
Source Chart by OEm, data from the World Bank, Migration and Remittances Factbook 2011, second edition.
0.0 2.0 4.0 6.0 8.0 10.0 12.0 India Mexico Russian Federation China Bangladesh Paquistan Ukraine Philippines Syria United Kingdom Afghanistan Poland Kazakhstan Germany Indonesia Palestine Romania Egypt Turkey USA Italy Myanmar Morroco Colombia Vietnam South Korea Portugal France Somalia Uzbekistan Emigrants, millions
Table 1.11 Emigration and immigration rates in EU countries, 2013
Country Emigration rate Immigration rate
Austria 6.7 17.5 Belgium 4.7 12.3 Bulgaria 16.5 1.4 Cyprus 15.2 16.8 Croatia 20.4 13.6 Czech Republic 8.8 3.8 Denmark 4.4 10.1 Estonia 15.1 15.4 Finland 5.4 5.7 France 3.3 12.1 Germany 5.0 14.9 Greece 8.0 11.3 Hungary 6.0 4.6 Ireland 18.8 15.9 Italy 4.9 9.7 Latvia 17.1 13.4 Lithuania 18.9 4.7 Luxembourg 10.8 44.0 Malta 24.7 9.9 Netherlands 5.8 11.7 Poland 11.5 1.6 Portugal 22.3 8.1 Romania 17.5 1.2 Slovakia 6.3 3.3 Slovenia 6.8 11.4 Spain 2.7 12.7 Sweden 3.4 16.8 United Kingdom 7.6 13.2
Chart 1.9 Emigration and immigration rates in EU countries, 2013
Note Only countries with more than one million inhabitants.
Source Chart by OEm, data from the World Bank, Migration and Remittances Factbook 2011, second edition.
Austria Belgium Bulgaria Croatia Czech Republic Denmark Estonia Finland France Germany Greece Hungary Ireland Italy Latvia Lithuania Netherlands Poland Portugal Romania Slovakia Slovenia Spain Sweden United Kingdom 0.0 5.0 10.0 15.0 20.0 0.0 5.0 10.0 15.0 20.0 25.0 Im m igr ation r ate in pe rc enta ge
2 | Emigration to top destination
countries
Summary
Table 2.1 Main indicators of Portuguese emigration to top destination countries, 2015
or last year available
Country Portuguese permanent inflows
Stock of migrants born in Portugal Population with Portuguese citizenship Acquisition of citizenship by Portuguese Stock of registrations in Portuguese consulates Angola 6,715 .. .. .. 134,473 Austria 663 .. .. .. .. Belgium 3,594 34,455 42,794 112 61,376 Brazil 1,294 137,973 .. .. 670,760 Canada 822 140,310 23,765 1,484 238,369 Denmark 947 .. .. .. .. France 18,480 606,897 519,500 3,109 1,346,472 Germany 9,195 110,384 133,929 698 182,762 Italy 354 7,023 5,815 36 11,673 Luxemburg 3,525 60,897 92,100 1,168 126,602 Mozambique 3,971 3,767 4,279 .. 29,360 Netherlands 1,860 16,456 18,704 42 23,409 Norway 488 2,925 3,731 7 5,775 Spain 6,638 107,226 98,751 341 56,104 Switzerland 12,325 216,714 267,474 3,537 314,081 United Kingdom 32,301 140,000 219,000 422 202,072 United States 857 177,431 54,669 1,690 194,728 Venezuela 532 37,326 .. .. 172,266
Note [AGO] Permanente inflows: data from visas concerning permanent emigration. [BEL] Permanent inflows: 2014. Acquisition of citizenship
by Portuguese: 2014. [BRA] Migrants born in Portugal: 2010. [CAN] Migrants born in Portugal and population with Portuguese citizenship: 2011. [FRA] Permanent inflows: 2013. Migrants born in Portugal: 2013. Population with Portuguese citizenship: 2013. [ITA] Migrants born in Portugal: 2012. [LUX] Migrants born in Portugal: 2011. [MOZ] Permanent inflows: 2014. Migrants born in Portugal and population with Portuguese citizenship: 2007. [CHE] Migrants born in Portugal: 2013. [USA] Migrants born in Portugal: 2014. Population with Portuguese citizenship: 2012. [VEN] Migrants born in Portugal: 2011.
Source Table by OEm, source data detailed in following pages. Entities: Consulado-Geral da República de Angola em Lisboa and
Consulado-Geral da República de Angola no Porto, Portugal; Direção-Geral dos Assuntos Consulares e das Comunidades Portuguesas, Portugal (DGACCP); OCDE; Eurostat; Statistics Austria; Ministério do Trabalho e Emprego, Brazil; IMILA, Investigación Migración Internacional de Latinoamérica; Instituto Brasileiro de Geografia e Estatística; Citizenship and Immigration Canada; Denmark Statistik; Institut Nacional de la Statistique et des Études Économiques, France; Ministère de L’intérieure, France; Instituto Nacional de Estatística, Mozambique; Statistisches Bundesamt Deutschland; Istituto Nazionale di Statistica, Italia; Le Portail des Statistiques du Luxembourg; Ministère de la Justice, Luxembourg; Centraal Bureau voor de Statistiek, Netherlands; Statistics Norway; INE España; Observatorio Permanente de la Immigración, España; Office Fédéral de la Statistique, Switzerland;
Map 2.1 Portuguese permanent inflows in top destination countries, 2014 or last year available
Note [AGO] Data from visas concerning permanent emigration. [BEL] 2012. [FRA] 2012. [ITA] 2013.
Source Map by OEm, data from: [AGO] Consulates of Angola in Portugal (Lisbon and Oporto); [BEL] Eurostat, Statistics Database,
Population and Social Conditions; [BRA] Ministério do Trabalho e Emprego; [CAN] Citizenship and Immigration Canada; [DEU] Statistisches Bundesamt Deutschland; [FRA] Institut Nacional de la Statistique et des Études Économiques; [ITA] Eurostat, Statistics Database, Population and Social Conditions; [LUX] Le Portail des Statistiques du Luxembourg; [MOZ] Direção Geral dos Assuntos Consulares e Comunidades Portuguesas based on data from Mozambique Ministry of Labor; [NLD] Centraal Bureau voor de Statistiek; [NOR] Statistics Norway; [ESP] Instituto Nacional de Estadística; [CHE] Office Fédéral de la Statistique; [GBR] Department for Work and Pensions; [USA] US Department of Homeland Security.
Map 2.2 Stock of migrants born in Portugal in top destination countries, 2014 or last year available
Note [BRA] 2010. [CAN] 2011. [FRA] 2011. [LUX] 2011. [MOZ] 2007. [VEN] 2011.
Source Map by OEm, data from: [BEL] Eurostat, Statistics Database, Population and Social Conditions; [BRA] Instituto Brasileiro
de Geografia e Estatística, Censos 2010; [CAN] Statistics Canada; [FRA] Institut Nacional de la Statistique et des Études Économiques; [DEU] Statistisches Bundesamt Deutschland; [LUX] Le Portail des Statistiques du Luxembourg; [MOZ] Instituto Nacional de Estatística; [NLD] Centraal Bureau voor de Statistiek; [NOR] Statistics Norway; [ESP] Instituto Nacional de Estadística; [CHE] Office Fédéral de la Statistique; [GBR] UK National Statistics; [USA] US Census Bureau, Current Population Survey; [VEN] Instituto Nacional de Estadística, Censos de Población e Vivienda.
Inflows
Table 2.2 Portuguese permanent inflows in top destination countries, 2015 or last year available
Country Total inflows
Portuguese inflows N As a percentage of total
inflows Ranking in total inflows
Angola .. 6,715 .. .. Austria 198,658 663 0.3 Belgium 123,569 3,594 2.9 .. Brazil 36,868 1,294 3.5 7th Canada 271,847 822 0.3 .. Denmark 76,323 947 1.2 France 235,000 18,480 7.9 1st Germany 1,654,092 9,195 0.6 .. Italy 280,078 354 0.1 .. Luxemburg 23,803 3,525 14.8 2nd Mozambique .. 3,971 .. .. Netherlands 174,733 1,860 1.1 .. Norway 59,067 488 0.8 .. Spain 455,679 6,638 1.5 .. Switzerland 162,563 12,325 7.6 2nd United Kingdom 828,198 32,301 3.9 6th United States 1,051,031 857 0.1 .. Venezuela 287,499 532 0.2 ..
Note [AGO] Data from visas concerning permanent emigration. [BEL] 2014. [FRA] 2013. [MOZ] 2014. [VEN] 2011.
Source Table by OEm, data from: [AGO] Consulates of Angola in Portugal (Lisbon and Oporto); [AUT] Statistics Austria; [BEL]
Eurostat, Statistics Database, Population and Social Conditions; [BRA] Ministério do Trabalho e Emprego; [CAN] Citizenship and Immigration Canada; [DEU] Statistisches Bundesamt Deutschland; [DNK] Denmark Statistik; [FRA] Institut Nacional de la Statistique et des Études Économiques; [ITA] Eurostat, Statistics Database, Population and Social Conditions; [LUX] Le Portail des Statistiques du Luxembourg; [MOZ] Direção Geral dos Assuntos Consulares e Comunidades Portuguesas (DGACCP) based on data from Mozambique Ministry of Labor; [NLD] Centraal Bureau voor de Statistiek; [NOR] Statistics Norway; [ESP] Instituto Nacional de Estadística; [CHE] Office Fédéral de la Statistique; [GBR] Department for Work and Pensions; [USA] US Department of Homeland Security; [VEN] Instituto Nacional de Estadística.
Chart 2.1 Portuguese permanent inflows in top destination countries, 2015 or last year available
Note [AGO] Data from visas concerning permanent emigration. [BEL] 2014. [FRA] 2013. [MOZ] 2014. [VEN] 2011.
Source Chart by OEm, data from: [AGO] Consulates of Angola in Portugal (Lisbon and Oporto); [BEL] Eurostat, Statistics Database,
Population and Social Conditions; [BRA] Ministério do Trabalho e Emprego; [CAN] Citizenship and Immigration Canada; [DEU] Statistisches Bundesamt Deutschland; [FRA] Institut Nacional de la Statistique et des Études Économiques; [ITA] Eurostat, Statistics Database, Population and Social Conditions; [LUX] Le Portail des Statistiques du Luxembourg; [MOZ] Direção Geral dos Assuntos Consulares e Comunidades Portuguesas (DGACCP) based on data from Mozambique Ministry of Labor; [NLD] Centraal Bureau voor de Statistiek; [NOR] Statistics Norway; [ESP] Instituto Nacional de Estadística; [CHE] Office Fédéral de la Statistique; [GBR] Department for Work and Pensions; [USA] US Department of Homeland Security.
0 5,000 10,000 15,000 20,000 25,000 30,000 35,000 Italy Norway Venezuela Austria Canada United States Denmark Brazil Netherlands Luxemburg Belgium Mozambique Spain Angola Germany Switzerland France United Kingdom
Chart 2.2 Portuguese permanent inflows as a percentage of all permanent inflows in top destination countries, 2015 or last year available
Note [BEL] 2014. [FRA] 2013. [ITA] 2014. [MOZ] 2014. [VEN] 2011.
Source Chart by OEm, data from: [BEL] Eurostat, Statistics Database, Population and Social Conditions; [BRA] Ministério do
Trabalho e Emprego; [CAN] Citizenship and Immigration Canada; [DEU] Statistisches Bundesamt Deutschland; [FRA] Institut Nacional de la Statistique et des Études Économiques; [ITA] Eurostat, Statistics Database, Population and Social Conditions; [LUX] Le Portail des Statistiques du Luxembourg; [NLD] Centraal Bureau voor de Statistiek; [NOR] Statistics Norway; [ESP] Instituto Nacional de Estadística; [CHE] Office Fédéral de la Statistique; [GBR] Department for Work and Pensions; [USA] US Department of Homeland Security. 0.0 2.0 4.0 6.0 8.0 10.0 12.0 14.0 16.0 United States Italy Venezuela Canada Austria Germany Norway Netherlands Denmark Spain Belgium Brazil United Kingdom Switzerland France Luxemburg
Table 2.3 Change in Portuguese permanent inflows in top destination countries,
2014-2015 or last two years available
Country
Total inflows Portuguese inflows
2014 2015 Change in percentage 2014 2015 Change in percentage Angola .. .. .. 5,098 6,715 31.7 Austria 154,260 198,658 28.8 581 663 14.1 Belgium 117,595 123,569 5.1 4,332 3,594 -17.0 Brazil 46,740 36,868 -21.1 1,921 1,294 -32.6 Canada 260,282 271,847 4.4 637 822 29.0 Denmark 65,547 76,323 16.4 638 947 48.4 France 229,600 235,000 2.4 18,370 18,480 .. Germany 1,145,953 1,654,092 44.3 10,121 9,195 -9.1 Italy 277,631 280,078 0.9 376 354 -5.9 Luxemburg 22,332 23,803 6.6 3,832 3,525 -8.0 Mozambique .. .. .. 3,759 3,971 5.6 Netherlands 154,193 174,733 13.3 1,887 1,860 -1.4 Norway 61,429 59,067 -3.8 653 488 -25.3 Spain 399,947 455,679 13.9 5,923 6,638 12.1 Switzerland 161,149 162,563 0.9 15,221 12,325 -19.0 United Kingdom 767,765 828,198 7.9 30,546 32,301 5.7 United States 1,016,518 1,051,031 3.4 892 857 -3.9 Venezuela .. .. .. .. .. ..
Note [AGO] Data from visas concerning permanent emigration. [BEL] 2012 and 2013. [FRA] 2011 and 2012. [MOZ] 2013 and
2014.
Source Table by OEm, data from: [AGO] Consulates of Angola in Portugal (Lisbon and Oporto); [AUT] Statistics Austria; [BEL]
Eurostat, Statistics Database, Population and Social Conditions; [BRA] Ministério do Trabalho e Emprego; [CAN] Citizenship and Immigration Canada; [DEU] Statistisches Bundesamt Deutschland; [DNK] Denmark Statistik; [FRA] Institut Nacional de la Statistique et des Études Économiques; [ITA] Eurostat, Statistics Database, Population and Social Conditions; [LUX] Le Portail des Statistiques du Luxembourg; [MOZ] Direção Geral dos Assuntos Consulares e Comunidades Portuguesas (DGACCP) based on data from Mozambique Ministry of Labor; [NLD] Centraal Bureau voor de Statistiek; [NOR] Statistics Norway; [ESP] Instituto Nacional de Estadística; [CHE] Office Fédéral de la Statistique; [GBR] Department for Work and Pensions; [USA] US Department of Homeland Security; [VEN] Instituto Nacional de Estadística.
Stocks
Table 2.4 Stock of migrants born in Portugal in top destination countries, 2015 or last year
available
Country Total population
All foreign-born migrants Migrants born in Portugal
N As a percentage of total population N As a percentage of total population As a percentage of all foreign-born Ranking in foreign-born population Angola .. .. .. .. .. .. .. Belgium 11,209,044 1,808,993 16.1 34,455 0.3 1.9 .. Brazil 190,755,799 592,570 0.3 137,973 0.1 23.3 1st Canada 32,852,325 7,217,295 22.0 140,310 0.4 1.9 .. France 65,564,756 5,835,344 8.9 606,897 0.9 10.4 3rd Germany 81,458,978 7,862,038 9.7 110,384 0.1 1.4 .. Italy 59,394,207 5,695,883 9.6 7,023 0.0 0.1 .. Luxemburg 512,400 205,162 40.0 60,897 11.9 29.7 1st Mozambique 20,252,223 342,117 1.7 3,767 0.0 1.1 .. Netherlands 16,900,726 1,860,977 11.0 16,456 0.1 0.9 .. Norway 5,165,802 741,813 14.4 2,925 0.1 0.4 .. Spain 46,624,382 6,162,932 13.2 107,226 0.2 1.7 .. Switzerland 8,327,126 2,416,394 29.0 216,714 2.6 9.0 2nd United Kingdom 64,265,000 8,569,000 13.3 140,000 0.2 1.6 .. United States 313,094,549 44,708,963 14.3 177,431 0.1 0.4 .. Venezuela 27,150,095 1,156,578 4.3 37,326 0.1 3.2 ..
Note [BRA] 2010. [CAN] 2011. [FRA] 2013. [ITA] 2012. [LUX] 2011. [MOZ] 2007. [USA] 2014. [VEN] 2011.
Source Table by OEm, data from: [BEL] Eurostat, Statistics Database, Population and Social Conditions; [BRA] Instituto Brasileiro
de Geografia e Estatística, Censos 2010; [CAN] Statistics Canada; [FRA] Institut Nacional de la Statistique et des Études Économiques; [DEU] Statistisches Bundesamt Deutschland; [ITA] OECD, International Migration Database; [LUX] Le Portail des Statistiques du Luxembourg; [MOZ] Instituto Nacional de Estatística; [NLD] Centraal Bureau voor de Statistiek; [NOR] Statistics Norway; [ESP] Instituto Nacional de Estadística; [CHE] Office Fédéral de la Statistique; [GBR] UK National Statistics; [USA] US Census Bureau, Current Population Survey; [VEN] Instituto Nacional de Estadística, Censos de Población e Vivienda.
Chart 2.3 Stock of migrants born in Portugal in top destination countries, 2015 or last year available
Note [BRA] 2010. [CAN] 2011. [FRA] 2013. [ITA] 2012. [LUX] 2011. [MOZ] 2007. [USA] 2014. [VEN] 2011.
Source Chart by OEm, data from: [BEL] Eurostat, Statistics Database, Population and Social Conditions; [BRA] Instituto Brasileiro
de Geografia e Estatística, Censos 2010; [CAN] Statistics Canada; [FRA] Institut Nacional de la Statistique et des Études Économiques; [DEU] Statistisches Bundesamt Deutschland; [ITA] OECD, International Migration Database; [LUX] Le Portail des Statistiques du Luxembourg; [MOZ] Instituto Nacional de Estatística; [NLD] Centraal Bureau voor de Statistiek; [NOR] Statistics Norway; [ESP] Instituto Nacional de Estadística; [CHE] Office Fédéral de la Statistique; [GBR] UK National Statistics; [USA] US Census Bureau, Current Population Survey; [VEN] Instituto Nacional de Estadística, Censos de Población e Vivienda.
0 100,000 200,000 300,000 400,000 500,000 600,000 Norway Mozambique Italy Netherlands Belgium Venezuela Luxemburg Spain Germany Brazil United Kingdom Canada United States Switzerland France
Chart 2.4 Stock of migrants born in Portugal as a percentage of all foreign-born in top destination countries, 2015 or last year available
Note [BRA] 2010. [CAN] 2011. [FRA] 2013. [ITA] 2012. [LUX] 2011. [MOZ] 2007. [USA] 2014. [VEN] 201.
Source Chart by OEm, data from: [BEL] Eurostat, Statistics Database, Population and Social Conditions; [BRA] Instituto Brasileiro
de Geografia e Estatística, Censos 2010; [CAN] Statistics Canada; [FRA] Institut Nacional de la Statistique et des Études Économiques; [DEU] Statistisches Bundesamt Deutschland; [ITA] OECD, International Migration Database; [LUX] Le Portail des Statistiques du Luxembourg; [MOZ] Instituto Nacional de Estatística; [NLD] Centraal Bureau voor de Statistiek; [NOR] Statistics Norway; [ESP] Instituto Nacional de Estadística; [CHE] Office Fédéral de la Statistique; [GBR] UK National Statistics; [USA] US Census Bureau, Current Population Survey; [VEN] Instituto Nacional de Estadística, Censos de Población e Vivienda.
0.0 5.0 10.0 15.0 20.0 25.0 30.0 Italy Norway United States Netherlands Mozambique Germany United Kingdom Spain Belgium Canada Venezuela Switzerland France Brazil Luxemburg
Table 2.5 Change in the stock of migrants born in Portugal in top destination countries,
2014-2015 or last two years available
Country
All foreign-born migrants Migrants born in Portugal
2014 2015 Change in percentage 2014 2015 Change in percentage Angola .. .. .. .. .. .. Belgium 1,773,148 1,808,993 2.0 33,388 34,455 3.2 Brazil .. .. .. .. .. .. Canada .. .. .. .. .. .. France 5,714,045 5,835,344 2.1 599,333 606,897 1.3 Germany 6,920,193 7,862,038 13.6 107,470 110,384 2.7 Italy 5,715,065 5,695,883 -0.3 7,013 7,023 0.1 Luxemburg .. .. .. .. .. .. Mozambique .. .. .. .. .. .. Netherlands 1,818,497 1,860,977 2.3 16,054 16,456 2.5 Norway 704,511 741,813 5.3 2,523 2,925 15.9 Spain 6,283,712 6,162,932 -1.9 116,710 107,226 -8.1 Switzerland 2,354,837 2,416,394 2.6 214,079 216,714 1.2 United Kingdom 8,277,000 8,569,000 3.5 127,000 140,000 10.2 United States 43,960,023 44,708,963 1.7 158,002 177,431 12.3 Venezuela .. .. .. .. .. ..
Note [FRA] 2012 and 2013. [ITA] 2011 and 2012. [USA] 2013 and 2014.
Source Table by OEm, data from: [BEL] Eurostat, Statistics Database, Population and Social Conditions; [FRA] Institut Nacional de
la Statistique et des Études Économiques; [DEU] Statistisches Bundesamt Deutschland; [ITA] OECD, International Migration Database; [NLD] Centraal Bureau voor de Statistiek; [NOR] Statistics Norway; [ESP] Instituto Nacional de Estadística; [CHE] Office Fédéral de la Statistique; [GBR] UK National Statistics; [USA] US Census Bureau, Current Population Survey.
Citizenship
Table 2.6 Population with Portuguese citizenship in top destination countries, 2015 or last year available
Country Total population
All foreigners Foreigners with Portuguese citizenship N As a percentage of total population N As a percentage of total population As a percentage of all foreigners Angola .. .. .. .. .. .. Belgium 11,209,044 1,300,493 11.6 42,794 0.4 3.3 Brazil .. .. .. .. .. .. Canada 32,852,325 1,957,015 6.0 23,765 0.1 1.2 France 65,564,756 4,083,857 6.2 519,500 0.8 12.7 Germany 81,458,978 9,107,893 11.2 133,929 0.2 1.5 Italy 60,795,612 5,014,437 8.2 5,815 0.0 0.1 Luxemburg 563,000 258,700 46.0 92,100 16.4 35.6 Mozambique 20,252,223 205,906 1.0 4,279 0.0 2.1 Netherlands 16,900,726 847,269 5.0 18,704 0.1 2.2 Norway 5,165,802 512,154 9.9 3,731 0.1 0.7 Spain 46,624,382 4,729,644 10.1 98,751 0.2 2.1 Switzerland 8,327,126 2,048,667 24.6 267,474 3.2 13.1 United Kingdom 64,265,000 5,567,000 8.7 219,000 0.3 3.9 United States 308,827,259 22,041,983 7.1 54,669 0.0 0.2 Venezuela .. .. .. .. .. ..
Note [CAN] 2011. [FRA] 2013. [MOZ] 2007. [USA] 2012.
Source Table by OEm, data from: [BEL] Eurostat, Statistics Database, Population and Social Conditions; [CAN] Statistics Canada;
[FRA] Institut Nacional de la Statistique et des Études Économiques; [DEU] Statistisches Bundesamt Deutschland; [ITA] Istituto Nazionale di Statistica; [LUX] Le Portail des Statistiques du Luxembourg; [MOZ] Instituto Nacional de Estatística; [NLD] Centraal Bureau voor de Statistiek; [NOR] Statistics Norway; [ESP] Instituto Nacional de Estadística; [CHE] Office Fédéral de la Statistique; [GBR] UK National Statistics; [USA] US Census Bureau, American Community Survey.
Chart 2.5 Population with Portuguese citizenship in top destination countries, 2015 or last year available
Note [CAN] 2011. [FRA] 2013. [MOZ] 2007. [USA] 2012.
Source Chart by OEm, data from: [BEL] Eurostat, Statistics Database, Population and Social Conditions; [CAN] Statistics Canada;
[FRA] Institut Nacional de la Statistique et des Études Économiques; [DEU] Statistisches Bundesamt Deutschland; [ITA] Istituto Nazionale di Statistica; [LUX] Le Portail des Statistiques du Luxembourg; [MOZ] Instituto Nacional de Estatística; [NLD] Centraal Bureau voor de Statistiek; [NOR] Statistics Norway; [ESP] Instituto Nacional de Estadística; [CHE] Office Fédéral de la Statistique; [GBR] UK National Statistics; [USA] US Census Bureau, American Community Survey.
0 100,000 200,000 300,000 400,000 500,000 Norway Mozambique Italy Netherlands Canada Belgium United States Luxemburg Spain Germany United Kingdom Switzerland France
Table 2.7 Change in the population with Portuguese citizenship in top destination
countries, 2014-2015 or last two years available
Country
All foreigners Foreigners with Portuguese citizenship
2014 2015 Change in percentage 2014 2015 Change in percentage Angola .. .. .. .. .. .. Belgium 1.264.427 1.300.493 2,9 41.200 42.794 3,9 Brazil .. .. .. .. .. .. Canada .. .. .. .. .. .. France 3.980.635 4.083.857 2,6 509.254 519.500 2,0 Germany 8.152.968 9.107.893 6,8 130.882 133.929 2,8 Italy 4.922.085 5.014.437 1,9 5.614 5.815 3,6 Luxemburg 248.900 258.700 3,9 90.800 92.100 1,4 Mozambique .. .. .. .. .. .. Netherlands 816.031 847.269 3,8 18.060 18.704 3,6 Norway 483.177 512.154 6,0 3.162 3.731 18,0 Spain 5.023.487 4.729.644 -5,8 109.708 98.751 -10,0 Switzerland 1.998.459 2.048.667 2,5 262.748 267.474 1,8 United Kingdom 5.344.000 5.567.000 4,2 175.000 219.000 25,1 United States 22.041.983 21.906.231 -0,6 54.669 .. .. Venezuela .. .. .. .. .. ..
Note [FRA] 2012 and 2013. [USA] 2012 and 2013.
Source Table by OEm, data from: [BEL] Eurostat, Statistics Database, Population and Social Conditions; [FRA] Institut Nacional de la
Statistique et des Études Économiques; [DEU] Statistisches Bundesamt Deutschland; [ITA] Istituto Nazionale di Statistica; [LUX] Le Portail des Statistiques du Luxembourg; [NLD] Centraal Bureau voor de Statistiek; [NOR] Statistics Norway; [ESP] Instituto Nacional de Estadística; [CHE] Office Fédéral de la Statistique; [GBR] UK National Statistics; [USA] US Census Bureau, American Community Survey.
Table 2.8 Acquisition of citizenship by Portuguese in top destination countries, 2015 or last year available
Country Acquisition of citizenship by all foreigners
Acquisition of citizenship by Portuguese
N As a percentage of acquisition of citizenship by all foreigners
Angola .. .. .. Belgium 18,726 112 0.6 Brazil .. .. .. Canada 268,359 1,484 0.6 France 113,608 3,109 2.7 Germany 107,181 698 0.7 Italy 178,035 36 0.0 Luxemburg 5,306 1,168 22.0 Mozambique .. .. .. Netherlands 27,877 42 0.2 Norway 12,432 7 0.1 Spain 78,000 341 0.4 Switzerland 40,689 3,537 8.7 United Kingdom 118,053 422 0.4 United States 730,259 1,690 0.2 Venezuela .. .. ..
Note [BEL] 2014. [CAN] 2014.
Source Table by OEm, data from: [BEL] Eurostat, Statistics Database, Population and Social Conditions; [CAN] OECD, International
Migration Database; [FRA] Ministère de L’intérieure; [DEU] Statistisches Bundesamt Deutschland; [ITA] Istituto Nazionale di Statistica; [LUX] Ministère de la Justice; [NLD] Centraal Bureau voor de Statistiek; [NOR] Statistics Norway; [ESP] Ministerio de Justicia; [CHE] Office Fédéral de la Statistique; [GBR] Government UK; [USA] US Department of Homeland Security.
Chart 2.6 Acquisition of citizenship by Portuguese in top destination countries, 2015 or last year available
Note [BEL] 2014. [CAN] 2014. [ITA] 2014. [NLD] 2014.
Source Chart by OEm, data from: [BEL] Eurostat, Statistics Database, Population and Social Conditions; [CAN] OECD, International
Migration Database; [FRA] Ministère de L’intérieure; [DEU] Statistisches Bundesamt Deutschland; [ITA] Istituto Nazionale di Statistica; [LUX] Ministère de la Justice; [NLD] Centraal Bureau voor de Statistiek; [NOR] Statistics Norway; [ESP] Ministerio de Justicia; [CHE] Office Fédéral de la Statistique; [GBR] Government UK; [USA] US Department of Homeland Security.
0 500 1,000 1,500 2,000 2,500 3,000 3,500 4,000 Norway Italy Netherlands Belgium Spain United Kingdom Germany Luxemburg Canada United States France Switzerland
Table 2.9 Change in the acquisition of citizenship by Portuguese in top destination countries, 2014-2015 or last two years available
Country
Acquisition of citizenship by all foreigners Acquisition of citizenship by Portuguese
2014 2015 Change in percentage 2014 2015 Change in percentage Angola .. .. .. .. .. .. Belgium 34,801 18,726 -46.2 185 112 -39.5 Brazil .. .. .. .. .. .. Canada 131,093 268,359 104.7 865 1,484 71.6 France 105,613 113,608 7.6 3,345 3,109 -7.1 Germany 108,422 107,181 -1.1 578 698 20.8 Italy 129,887 178,035 37.1 33 36 9.1 Luxemburg 4,991 5,306 6.3 1,211 1,168 -3.6 Mozambique .. .. .. .. .. .. Netherlands 32,675 27,877 -14.7 59 42 -28.8 Norway 15,336 12,432 -18.9 23 7 -69.6 Spain 93,714 78,000 -16.8 496 341 -31.3 Switzerland 32,836 40,689 23.9 2,447 3,537 44.5 United Kingdom 125,653 118,053 -6.0 318 422 32.7 United States 653,416 730,259 11.8 1,587 1,690 6.5 Venezuela .. .. .. .. .. ..
Note [BEL] 2013 and 2014. [CAN] 2011 and 2012.
Source Table by OEm, data from: [BEL] OECD, International Migration Database (2011); Eurostat, Statistics Database, Population
and Social Conditions (2012); [CAN] OECD, International Migration Database; [FRA] Ministère de l'Intérieur (2010); [DEU] Statistisches Bundesamt Deutschland; [ITA] Istituto Nazionale di Statistica; [LUX] Ministère de la Justice; [NLD] Centraal Bureau voor de Statistiek; [NOR] Statistics Norway; [ESP] Ministerio de Justicia; [CHE] Office Fédéral de la Statistique; [GBR] Government UK; [USA] US Department of Homeland Security.
Consular data
Table 2.10 Stock of consular registrations in top destination countries, 2015 or last year
available
Country All registrations in Portuguese consulates
Registrations by migrants born in Portugal (2012)
N As a percentage of all registrations
Angola 134,473 38,994 29.0 Belgium 61,376 33,039 53.8 Brazil 670,760 425,396 63.4 Canada 238,369 103,653 43.5 France 1,346,472 817,138 60.7 Germany 182,762 117,327 64.2 Italy 11,673 1,434 12.3 Luxemburg 126,602 60,502 47.8 Mozambique 29,360 10,631 36.2 Netherlands 23,409 11,936 51.0 Norway 5,775 .. .. Spain 56,104 47,959 85.5 Switzerland 314,081 210,327 67.0 United Kingdom 202,072 100,542 49.8 United States 194,728 168,484 86.5 Venezuela 172,266 96,509 56.0
Chart 2.7 Stock of consular registrations in top destination countries, 2015 or last year
available
Source Chart by OEm, data from Direcção-Geral dos Assuntos Consulares e das Comunidades Portuguesas (DGACCP).
0 200,000 400,000 600,000 800,000 1,000,000 1,200,000 Norway Italy Netherlands Mozambique Spain Belgium Luxemburg Angola Venezuela Germany United States United Kingdom Canada Switzerland Brazil France
Table 2.11 Change in the stock of consular registrations in top destination countries,
2014-2015 or last two years available
Country
All registrations in Portuguese consulates Registrations by migrants born in Portugal (2011-2012)
2014 2015 Change in percentage 2011 2012 Change in percentage Angola 126,356 134,473 6.4 .. 38,994 .. Belgium 58,020 61,376 5.8 31,698 33,039 4.2 Brazil 644,903 670,760 4.0 425,449 425,396 0.0 Canada 246,432 238,369 -3.3 101,519 103,653 2.1 France 1,122,564 1,346,472 19.9 801,180 817,138 2.0 Germany 164,799 182,762 10.9 115,605 117,327 1.5 Italy 11,258 11,673 3.7 1,133 1,434 26.6 Luxemburg 121,127 126,602 4.5 58,860 60,502 2.8 Mozambique 24,779 29,360 9.7 9,224 10,631 15.3 Netherlands 22,621 23,409 3.5 10,809 11,936 10.4 Norway 5,001 5,775 15.5 .. .. .. Spain 53,600 56,104 4.7 44,586 47,959 7.6 Switzerland 305,128 314,081 2.9 204,989 210,327 2.6 United Kingdom 181,244 202,072 11.5 96,327 100,542 4.4 United States 200,070 194,728 -2.7 167,173 168,484 0.8 Venezuela 170,267 172,266 1.2 80,029 96,509 20.6
3 | Remittances
Volume and composition
Table 3.1 Inward and outward remittance flows in Portugal, 2015
Country Inward flows
(thousand euros)
Outward flows
(thousand euros) Balance
Total 3,303,650 522,610 2,781,040 Algeria 30 260 -230 Angola 213,120 19,540 193,580 Argentina 890 1,030 -140 Australia 3,420 880 2,540 Austria 8,630 190 8,440 Belgium 66,600 1,970 64,630 Brazil 19,950 231,380 -211,430 Bulgaria 140 6,080 -5,940 Canada 32,490 2,180 30,310 Cape Verde 1,640 16,950 -15,310 China 2,040 70,770 -68,730 Croatia 40 140 -100 Cyprus 120 40 80 Czech Republic 360 860 -500 Denmark 3,680 300 3,380
Egypt, Arab Rep. 140 630 -490
Estonia 80 230 -150 Finland 1,420 440 980 France 1,033,120 19,030 1,014,090 Germany 255,470 4,640 250,830 Greece 100 180 -80 Guinea-Bissau 2,640 3,110 -470 Hungary 650 560 90 Iceland 430 90 340 India 360 4,860 -4,500 Ireland 4,820 340 4,480 Italy 4,070 1,640 2,430 Japan 1,940 520 1,420 Korea, Rep. 240 330 -90 Latvia 10 840 -830
Malta 114,470 410 114,060 Mexico 140 320 -180 Morocco 10 4,720 -4,710 Mozambique 6,200 9,830 -3,630 Netherlands 42,760 1,620 41,140 New Zealand 150 50 100 Nigeria 40 890 -850 Norway 3,070 1,260 1,810 Poland 170 6,240 -6,070 Romania 1,280 19,770 -18,490
São Tomé and Principe 570 1,600 -1,030
Saudi Arabia 200 90 110 Slovak Republic 150 410 -260 Slovenia 10 360 -350 South Africa 8,570 1,500 7,070 Spain 127,220 13,370 113,850 Sweden 11,470 1,160 10,310 Switzerland 842,290 5,260 837,030 Turkey 330 230 100 Ukraine 350 160 190
United Arab Emirates 690 10 680
United Kingdom 254,960 5,940 249,020 United States 210,220 9,280 200,940 Venezuela, RB 6,490 2,220 4,270 OECD 3,027,710 81,080 2,946,630 PALOP 224,160 51,030 173,130 EU28 1,931,900 87,530 1,844,370 Euro Zone (15) 1,659,150 46,510 1,612,640
Map 3.1 Inward remittance flows in Portugal, 2014
Source Map by OEm, data from Banco de Portugal, Statistics Online (BPstat), Balance of Payment Statistics.
Table 3.2 Top inward remittance flows in Portugal, 2015
Country Thousand
euros
As a percentage
of total inward flows Cumulative percentage
Total inward flows 3,303,650 100.0 ..
Top inward flows
France 1,033,120 31.3 31.3 Switzerland 842,290 25.5 56.8 Germany 255,470 7.7 64.5 United Kingdom 254,960 7.7 72.2 Angola 213,120 6.5 78.7 United States 210,220 6.4 85.0 Spain 127,220 3.9 88.9 Luxembourg 114,470 3.5 92.3 Belgium 66,600 2.0 94.4 Netherlands 42,760 1.3 95.7 Canada 32,490 1.0 96.6 Brazil 19,950 0.6 97.2 Sweden 11,470 0.3 97.6 Austria 8,630 0.3 97.9
Chart 3.1 Top inward remittance flows in Portugal, thousand euros, 2015
Source Chart by OEm, data from Banco de Portugal, Statistics Online (BPstat), Balance of Payment Statistics.
0 100,000 200,000 300,000 400,000 500,000 600,000 700,000 800,000 900,000 France Switzerland Germany United Kingdom Angola United States Spain Luxembourg Belgium Netherlands Canada Brazil Sweden Austria
Changes
Table 3.3 Changes in inward remittance flows in Portugal, 2014-2015
Country 2014 thousand euros, nominal values 2015 thousand euros, nominal values
Change in nominal values,
thousand euros Change in percentage
Total inward flows 3,060,710 3,303,650 242,940 7.9
Top inward flows
France 882,180 1,033,120 150,940 17.1 Switzerland 812,810 842,290 29,480 3.6 Germany 196,190 255,470 59,280 30.2 United Kingdom 202,220 254,960 52,740 26.1 Angola 247,960 213,120 -34,840 -14.1 United States 163,450 210,220 46,770 28.6 Spain 166,930 127,220 -39,710 -23.8 Luxembourg 95,150 114,470 19,320 20.3 Belgium 77,900 66,600 -11,300 -14.5 Netherlands 37,160 42,760 5,600 15.1 Canada 62,890 32,490 -30,400 -48.3 Brazil 26,830 19,950 -6,880 -25.6 Sweden 9,340 11,470 2,130 22.8 Austria 7,250 8,630 1,380 19.0