Repositório ISCTE-IUL
Deposited in Repositório ISCTE-IUL:
2019-05-09
Deposited version:
Post-print
Peer-review status of attached file:
Peer-reviewed
Citation for published item:
Dos-Santos, M. J. P. L. (2018). Nowcasting and forecasting aquaponics by Google Trends in European countries. Technological Forecasting and Social Change. 134, 178-185
Further information on publisher's website:
10.1016/j.techfore.2018.06.002
Publisher's copyright statement:
This is the peer reviewed version of the following article: Dos-Santos, M. J. P. L. (2018). Nowcasting and forecasting aquaponics by Google Trends in European countries. Technological Forecasting and Social Change. 134, 178-185, which has been published in final form at
https://dx.doi.org/10.1016/j.techfore.2018.06.002. This article may be used for non-commercial purposes in accordance with the Publisher's Terms and Conditions for self-archiving.
Use policy
Creative Commons CC BY 4.0
The full-text may be used and/or reproduced, and given to third parties in any format or medium, without prior permission or charge, for personal research or study, educational, or not-for-profit purposes provided that:
• a full bibliographic reference is made to the original source • a link is made to the metadata record in the Repository • the full-text is not changed in any way
The full-text must not be sold in any format or medium without the formal permission of the copyright holders.
Serviços de Informação e Documentação, Instituto Universitário de Lisboa (ISCTE-IUL) Av. das Forças Armadas, Edifício II, 1649-026 Lisboa Portugal
Phone: +(351) 217 903 024 | e-mail: administrador.repositorio@iscte-iul.pt https://repositorio.iscte-iul.pt
Nowcasting and forecasting aquaponics by Google Trends in
European countries
Abstract
Aquaponics, an innovation in agricultural systems of production and food supply which combines aquaculture fish production with hydroponic production of vegetables, represents a valuable option to overcome the food needs of a constantly increasing world population, it can do so by improving production and supply with less inputs and in a sustainable way. Despite recent developments in this scientific area, there are still not enough commercial firms at an European level that allow for a consistent view of how this activity is evolving in society, as well as, to understand the impact of Aquaponics Hub in promoting the development of this activity in Europe - aquaponics is still at an early age and, despite innovative, it needs time to grow and evolve.
Thus, we used Google Trends data and a quantitative methodology, multivariate analysis and econometric models, in order to both nowcast and forecast insights about the importance, the role and the new trends in aquaponics. The results show an interesting trend of increasing popularity in aquaponics search terms as a proxi of aquaponics development in Europe, mainly in all the European countries belonging to the Aquaponics Hub. However, we conclude that there is still a long way to go for aquaponics before it becomes a commercial activity at economic level. Hence, European and public decision-makers are urged to be more concerned about legislation and the allocation of funds for research and for the commercial investment of companies and for their promotion and development in aquaponics. This paper reviews these discussions, maps scientific and technological progress over the aquaponics in Europe and presents new ideas on how to foster and accelerate scientific and technological advancement in aquaponics in Europe and across the world.
Keywords: aquaponics; innovation food production; Google Trends; European Aquaponics HUB
1. Introduction
Aquaponics is nowadays the latest innovation in food production systems allowing reduced
inputs use and short supply chains, with direct impacts on the sustainability of the entire sector.
Due its great innovation your development at the commercial firms’ level beginning now to take the first steps. But for research purpose this represents a constraint to obtain data for research at the microeconomic level, namely, at the firm level. Yet, innovation system on food production and short supply chain plays an important role to make agriculture and sector-wide changes more sustainable (Hoes et al., 2016) and cannot be neglected.
But nowadays the increasing volumes of ‘big data’ reflecting various aspects of our present scientific professional activities and represent a crucial new opportunity for scientists and experts to study the fundamental questions about the complex world we inhabit in different areas (Preis et al., 2013; Axtell and Zipf, 2001; King 2011; Vespignani, 2009; Perc, 2012; Petersen et al., 2012; Christakis et al., 2009; Frizzo-Barker et al., 2016; Klievink et al., 2017), namely, in management and business (Frizzo-Barker et al., 2016; Dittert et al., 2018) information and communication (Yu et al., 2018, Lu et al., 2018).
In today’s world, information gathering often consists of searching online sources (Preis et al., 2013; Amankwah-Amoah, 2015; Blazquez, 2017). Recently, the search engine Google Trends (Google Trends, 2016) has begun to provide access to aggregated information on the volume of queries for different search terms and how these volumes change over time, via the publicly available service Google Trends with historic searches available since January 2004. This recent non-traditional source of social and economic data GT provides up-to-date reports on the volume of search queries on a specific keyword or text, with historic searches from 2004 and was used to nowcast and to forecast social and economic variables with application in various empirical fields (Blazquez, 2017).
Despite GT captures how the demand of information under certain topics varies over time, providing useful data to detect emerging trends and underlying interests and concerns of society, namely, using GT data to nowcast social and economic variables (Blazquez, 2017), the use of GT in agricultural field still remain restricted in and with just only one contribution from Troumbis, (2017) who analyses the GT and cycles of public interest in biodiversity, and remains without any contribution in nowcast aquaponics what is recognized as a sustainable food production technology.
So, the present paper tries to fill this gap on the literature and examines the intriguing possibility of analyzing search query data from Google Trends to nowcast, forecast and provide new insights about the importance, the role and the new trends about aquaponics in general and about the role of European Aquaponics Hub from COST FA 1305 in this process, in particular in promoting the international scientific debate in this field in order to promote the sustainable development of aquaponics in Europe and in the world.
a) To analyze the current development of aquaponics and aquaponics related activities, namely, the aquaculture, hydroponics and commercial aquaponics in Europe and if that development presents nowadays a trend of growth;
b) To confirm if that trend of development of aquaponics is similar in all the participants countries of COST Action FA 1305 and Aquaponics Hub and in all other the remaining European countries outside of this Hub in order to delineate aquaponics development to promote innovation and social change among all the European countries;
c) To analyze the contribution of that Hub and this COST Action to promote the development of Aquaponics and forecast new insights about the importance, the role and the new trends about aquaponics to be analyzed and developed;
d) To understand the actual commercial development of aquaponics in Europe in order to promote their sustainable development in order to contribute for technological and social change in food production systems and short supply chains.
1.1. Significance of the paper for the literature, limitations and suggestions
This paper making a threefold contribution in the literature:
1) Although there are many studies in the scientific field of aquaponics none of them so far analyzes your situation in the European countries nor brings to the scientific debate and forecast new insights about the importance, the role and the new trends about aquaponics;
2) For the first time, this paper uses Google Trends information due the shortage of data available in aquaponics in Europe. This could bring a new way to get information not only in aquaponics but also to study innovation systems in agriculture;
3) This paper gives insights to stakeholders and to public decision-makers about the way forward in the promotion and development of aquaponics as well as the importance of HUB in this process, in order to foster research in innovative areas.
Despite the fact of GT are in constant improvement as a consequence of the development of artificial intelligence there are, however, some limitations in general, and, on this paper in particular. The first one can occur because we do not know which agents are conduct the research (searching in GT). We don’t know if the search on google trends it done by the general public, or consumers, or producers or even
researchers. On the other hand, we also don’t have any information about the purpose/motivation, and therefore, the present results obtained should be analyzed carefully.
Another limitation is related about geographical and linguistic restrictions, because when the search on GT involve a continent (for example Europe), or even the world, these have various different languages. Therefore, research in only in English language can be a limitation, because the majority of the research is still done in English by researchers, not invalidating that other agents do as well.
Therefore, we recommended in future works in this field the use of GT research combining different languages from different countries among Europe or even in the world. That allows at the same time more degrees of freedom and consequently, more accurate models and adjusted results.
1.2. The contribution of aquaponics as a sustainable food production system for innovation, technological and social change
Aquaponics is very recent and innovative agricultural practice of production vegetable and fish recognized as sustainable by the Food and Agriculture Organization (FAO) of the United Nations (UN, 2016; Somerville et al., 2014; Dos Santos, 2016 and Miličić et al., 2017). Aquaponics integrating aquaculture with hydroponic crops production wherein the water from the fish tanks that is enriched in nutrients is used for plant growth in a closed and environmental system.Which implies that a large volume of production of fish and vegetables can be produced locally in a sustainable food production way (Bosma et al., 207; Van Ginkel et al., 2017) including in urban agriculture (Dos-Santos, 2016; Lal, 2016) with smaller quantities of use inputs such as soil (Betz, 2017), nutrients and water and with low carbon charges to the atmosphere, allowing the production of fresh and healthy food in short supply chains from producers to consumers. (Goddek et al., 2015; Dos Santos, 2016; Miličić et al., 2017). Aquaponics, as both an innovative agricultural practice and business, is experiencing a period of rapid growth, being practiced nowadays in at least 43 countries around the world and on every continent (Love et al., 2014). Besides that, the development at European level of aquaponics commercial production is taking the first steps with the new startups (Miličić et al., 2017).
According to the sectorial trends, aquaponic technology might evolve in at least two directions (Junge et al., 2017): the first relates to low-tech solutions, probably mostly in developing countries and for hobbyists, and the second, highly efficient hi-tech installations, predominantly in developed countries and with professional/commercial partners (Junge et al., 2017). However, in both situations aquaponics will be always a technology for sustainable food production that will contribute to a more sustainable world.
Technological change in agriculture plays a decisive role for meeting future demands for agricultural goods (Dietrich et al., 2014) and currently, green growth is the only strategy of mainstream economists and policy makers to address climate change (Antal & Van Den Bergh, 2016). On the other hand, research on innovative and topics, whose technology is still in constant progress, development and improvement of efficiency on the use of inputs and the production of outputs as occurs in aquaponics in Europe, sometimes results in difficulties in obtaining data. These difficulties arise, or because there is no data available from private companies or formal institutions, or because either there are data from other continents, or countries whose production systems do not allow comparability, or because the soil-climatic conditions, or technical-institutional-economic conditions (Goddek, et al. 2015; Dos Santos. 2016). Because they use different production techniques due to the difference in quality and quantity of inputs available in loco (Dalsgaard et al., 2013, Goddek et al., 2015).
In order to promote innovation and capacity building by a network of researchers and commercial aquaponics companies was formed EU Aquaponics HUB from the COST Action 1305(EU Aquaponics Hub, 2017).
1.3. COST Action and The EU Aquaponics Hub
The COST FA 1305 - The EU Aquaponics Hub - Realising Sustainable Integrated Fish and
Vegetable Production for the EU is supported for Horizon 2020 (The EU Framework
Programme for Research and Innovation, 2017). This Action is aimed at studying aquaponics in an integrated way and promoting its development in all European countries, and commercial aquaponics companies (EU being nowadays a reference in the promotion and development of aquaponics and aggregates presently twenty-eight countries in Europe), including all the researchers and professionals of the agricultural/fisheries and aquaponics and aquaponics related sciences in that strategic sector, and, as well as, other related sciences (e.g., fisheries, aquaculture, hydroponic, etc.), such as, economists, communication and marketing specialists,
farmers, and supplier companies, among others, from all the European countries (either as members and national delegates or as external observers). All the network work joint with the public decision-makers and other stakeholders at national, European and world level.
The EU Aquaponics Hub is currently trying to overcome the technical, institutional, social, and economic difficulties that the sector is facing in Europe. As a result, there has been huge efforts in scientific work in the field with a proliferation of conferences and debates with public decision-makers at national and community level.
This Action also created “The EU Aquaponics Hub” (https://euaquaponicshub.com/, 2017) who is funded by COST (European Cooperation in Science and Technology) in order to promote innovation and capacity building by a network of researchers and commercial aquaponics companies (EU Aquaponics Hub, 2017). This Hub is currently trying to overcome the technical, institutional, social, and economic difficulties that the sector is facing in Europe. As a result, there has been huge efforts in scientific work in the field with a proliferation of conferences and debates with public decision-makers at national and community level.
2. Literature Review
Aquaponics is a very recent area that only started in 2008 in terms of scientific publications due the strong innovation presented on this sustainable agricultural practice. Since then, according to SCOPUS bibliographic database (2017), the scientific publications have been increasing, presenting a growth rate of 125% in the last year (2016-2015). The recent years were fruitful mainly in terms of scientific production on aquaponics technologies, which presented an exponential development (Pollard et al., 2017). In a recent search, it was found about 297 indexed documents in the SCOPUS database (2017), including 126 scientific and revision papers, and several books, book chapters, proceedings of conferences, etc. Most of these works are related to the fields of Agricultural and Biological Sciences (114); Environmental Science (70); Biochemistry, Genetics and Molecular Biology (23); Social Sciences (23); Engineering (19); Energy (13); Computer Science (9); Business, Management and Accounting (6); Chemical Engineering and Immunology and Microbiology (10).
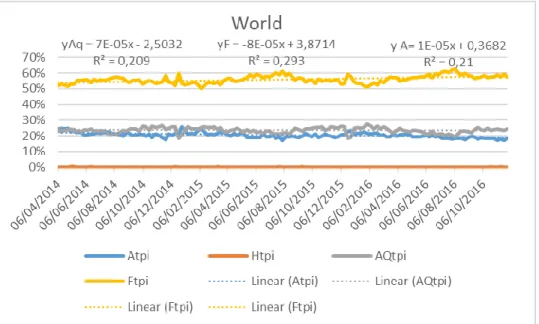
At the same time, according to the Google Trends search (2017) the world and the European countries are paying increasing attention to aquaponics and aquaponics associated terms based on the figures 1 and 2.
Fig.1 – World Percentilized Google trends searching from 2014 until 2016. Where: Atpi – Aquaponics; Htpi: hydroponics; AQtpi – Aquaculture; Fpti- Fish farming and respective linear trends. (Note: The small adjustment of the model to the data is due the small number of observations from the “world” because appears just the average of all the countries on Google Trends data).
Fig. 2 – Europe Percentilized Google trends searching from 2014 until 2016. Where: Aitp – Aquaponics; Htpi: hydroponics; Aqtpi – Aquaculture; Fpti- Fish farming.
From the beginning of the year 2004 Google Inc. created Google Trends (GT). Through this has been possible collecting data by categories or by free search based on the number of search queries that it receives for various search terms, namely, in aquaponics and aquaponics related terms. From this raw data GT can then compile a weekly, monthly and annual GT query index
for the number of searches completed for any particular search term which can then be viewed online or downloaded into a spreadsheet in excel file (Hand, & Judge, 2012). Query results are scaled to the maximum over the selected period (Fondeur & Karamé, 2013). The index can be restricted by geographical area, namely, at country or world level. Is possible at the same time to compare results from different terms of search and periods. The data search from GT comes from the Web of google, Google news, Google shopping, and now YouTube search too.
Data provided by Google Trends are already normalized over each selected period (Mavragani and Tsagarakis, 2016). The normalization process is reported as follows: each data point is divided by the total searches of the geography and time range it represents, to compare relative popularity. The resulting numbers are then scaled to a range of 0 to 100 (Google Trends, 2017, Mavragani and Tsagarakis, 2016).
Due this, different regions that show the same number of searches for a term will not always have the same total search volumes (Google Trends, 2017). Other limitation to this query data includes the fact that Google index is not fully representative because not everyone uses the Internet (Fondeur & Karamé, 2013). In aquaponics, being a new area, previous studies indicate that both producers and consumers often use this tool (Love et al., 2015; Miličić et al., 2017).
Since the seminal work of Choi and Varian (2009a) a considerable number of papers have used these big data in various fields with different goals (Fondeur & Karamé, 2013). The main several papers use GT for forecasting in different areas such as macroeconomic and microeconomics: i) finance in financial markets, (Perlin et al., 2017); ii) economics in private consumption (Vosen & Schmidt, 2011) or, iii) employment/unemployment (Vicente et al., 2015); in iv) tourism management (Yang et al., 2015; Bangwayo-Skeete, & Skeete, 2015). At the same time, big data (GT) was used to understand the dark side of the world around us, as occurs with Makin & Morczek (2015) in criminology studies or to leveraging trends in market response modeling in marketing (Du et al., 2015), as well as, for health sciences surveillance and systematic review health care research and control diseases (Doornik, 2009; Nuti et al., 2014; Won et al., 2017), or in environmental sciences where the works are scarce and only quantify the online interest for water monitoring in substances (Mavragani et al., 2016) and do not exist in sustainable agriculture/aquaponics.
The choice of keywords and terms to search in GT is, of course, crucial for any study. It thus requires some discussion (Fondeur & Karamé, 2013). Some of the studies mainly in economic and finance areas use a large set of Google queries. To retain pertinent and tractable information, their dimensionality is reduced by extracting their principal components, which enter as exogenous variables in some econometric models (Fondeur & Karamé, 2013; Brown, 2014; Dos Santos, 2016).
Kholodilin et al., (2010) apply a factor model (multivariate analysis - Principal Component Analysis (PCA) on a large set of Google queries to extract main components that improve nowcasts of US private consumption.
2.2. The reduction of data and shaping typologies of countries in aquaponics for path of technological change
The majority of the last studies developed with big data were mainly used for quantify financial or other information by calculating the frequency of each search term in the online (Preis et al., 2013), but not the construction of homogeneous groups (clusters) with high internal homogeneity and high external homogeneity, which implies the construction of typologies (Dos-Santos, 2016; Silva et al., 2015; Silva and Marote, 2013), except Brabham et al., (2014) who proposed an typology of vaccine critical websites when studying applications for public health, but without the use of multivariate methods, namely, cluster analysis.
In the present case in order to investigate shaping typologies of countries in aquaponics for path of technological change could be interesting separate the countries among their aquaponics development.
3. Methodology
3.1. Information and data
Data includes: 1) Google Trends (GT) data was collected online (Google Trends, 2016) from April 2014 to November 2016 at a weekly baseline and was used to analyze the online interest in the terms Aquaponics (A), Aquaponics Systems (AS), Hydroponics (H), Fish Farming (F), Aquaculture (AQ) and Commercial Aquaponics (CA) in the European countries (Appendix A) participants, and Observer Members COST Action FA 1305, in all the European countries
(not participant in these COST Action), and, as well as all the European countries and a World (W) level data.
2) At the same time, we collect from the COST FA 1305 Members (2017), the number and dimension of commercial firms/research in aquaponics, per country, as well as, the public investment from Europe 2020 and at national level per country from OECD (2016).
The main goal was to find not only the public and private interest about aquaponics, but also to understand the evolution and importance of aquaponics over time, as well as, the production techniques that were in the origin of that sustainable way of production food by the search of Hydroponics (H) and Aquaculture (AQ), and, still forecasting the interest of aquaponics as a commercial activity for forecasting innovation and social change. To obtain the last one information we did a complex and integrated GT search queries combining much more terms of search (ex: innovation aquaponics; sustainable aquaponics; etc.). Unfortunately, about the commercial trends the GT information obtained was restricted or null along the countries, Europe and quite the World.
The methodology includes multivariate techniques, namely, Principal Component Analysis (PCA) and Cluster analysis and time series techniques. Prior we percentized weekly hits of the downloaded Google Trends data for aquaponics and aquaponics related terms in order to do their respective normalized Google searches.
The PCA consists in identifying, based on a set of variables, a few factors that can synthesize most of the total information contained in the original variables. These factors are those common elements, latent, which is the basis of the variables intercollinearity (Miličić et al., 2017). The PCA is classified among the descriptive methods analyzing interdependencies between variables. Therefore, there are no dependent variables and independent variables, the simultaneous combination of analyzed variables (interdependences) is important (Buehler and Junge, 2016; Miličić et al., 2017). We initially intent to use PCA on a large set of Google queries to extract main components that improve nowcasts of aquaponics and aquaponics related terms on google trends search.
Cluster analysis is used here to form homogeneous groups of countries. Cluster analysis is a multivariate analysis technique that present a great homogeneity intra-group and a large inter-group heterogeneity (Dos Santos, 2013). Previous procedures in the cluster analysis includes usually the exclusion of the correlated variables, namely, by correlation analysis, by the Pearson (p) correlation coefficient.
Cluster analysis includes in the present study the Squared Euclidean distance (Eij) as a
measure of proximity. This measure calculates the distance between two points as the sum of the squares of the differences between i and j values for all variables (y = 1, 2, ..., n). Ward’s aggregation criterion was used and includes, namely, (a) calculating the averages of the variables in each group; (b) calculating the squared Euclidean distance between the means and the values of variables for each individual; (c) summing of the distances for all individuals, and
(d) optimizing the minimum variance between groups (Dos-Santos, 2013).
In the present case in order to investigate shaping typologies of countries in aquaponics for path of technological change could be interesting separate the countries among their aquaponics development.
3.2. Methods
be the weekly hits of the downloaded Google Trends data for the Aquaponics (A), Hydroponics (H), Fish Farming (F) and Aquaculture (Aq) searches of the i-th region and time, with representative data along time and countries, where:
define, respectively, the percentized weekly hits of their respective normalized Google searches, using Equations (1) to (4).
Aq and F H A Let ti ti ti ti ; ; Aq and F H A tpi tpi tpi tpi ; ; ) 1 ...( ... ... ... ... F H Aq A A A ti ti ti ti ti tpi= + + + ) 2 ...( ... ... ... ... F H Aq A Aq Aq ti ti ti ti ti tpi= + + + ) 3 ...( ... ... ... ... F H Aq A H H ti ti ti ti ti tpi + + + = ) 4 ...( ... ... ... ... F H Aq A F F ti ti ti ti ti tpi= + + + 2 1 ) _ ( jY n y iY X X Eij = =
Due the restricted number of percentized variables it was not necessary to reduce its number by Principal Component Analysis. These results also indicate difficulty to form clusters of countries due the restricted number of variables.
In order to forecast the general trend of aquaponics growth/decline in Europe and in the European Countries participating in COST we used the general simple autoregressive models augmented by the Google Trends according to Choi and Varian (2012) but modify by Hand and Judge (2012) and adjusted to our goals and taking the following form:
where yt is the value of the series under investigation in month t; yt–1 is the value of that series
in the previous month; yt–12 is the value of the series 12 months earlier; and xt is the value of
the Google Trends query index for the term associated with the series that included a secular time trend (TREND) and the value of the relevant search term (labelled x in general) (Hand, and Judge, 2012):
In particular, to forecast the evolution of aquaponics and aquaponics related terms at individual level on European countries participating in the COST, a linear trend was used because it was the one that best adjustment.
4. Results
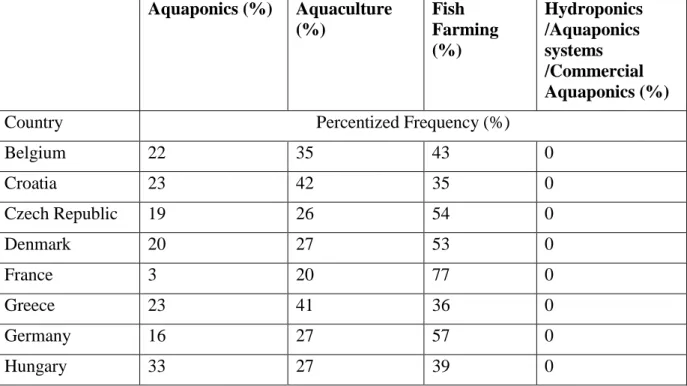
Table 1 presents the percentized weekly hits of their respective normalized Google searches terms on Aquaponics (A), Aquaponics Systems (AS), Aquaculture (AQ), Commercial aquaponics (CA), Fish Farming (F) and Hydroponics (H) and from 2014 to 2016 per respective European country referred participant in COST FA 1305 (please see Appendix A), European countries leftovers from that COST Action (Appendix C), and as well as the total world search in that terms. Appendix B refer the missing data from the European countries that belongs to the COST Action FA 1305.
Aq and F H A ti ti ti ti ; ; ) 5 ...( ... ... ... 12 12 1 0 yt yt Xt TREND t Y = + − + − + + ) 6 ....( ... ... ... .it t t X Y = + +
The main results (Table 1 and Appendix C) highline confirm that at World and European level the most demand in percentized GT search terms belongs to Fish Farming (F) search, respectively, with 56% and 47%. The only difference at World and European level is that at the first this GT search in F represents the majority of the research in F (>50%) while in Europe that does not happen (>50%). That can be explained by the oldest importance across the time about F with proved commercial results across countries and continents (Besson et al., 2016). On the other hand, F is a precursor technology of aquaponics, as well as occurs with AQ and H.
Regard to the GT search and percentized terms surveyed Aquaponics (A) and Aquaculture (AQ) the results show that worldwide they represent respectively of 1/5 and about ¼ of the total. At European level, these results are quite similar with respect to A and about 1/3 with respect to AQ. These results prove the increasing importance of aquaponics in Europe in queries search terms. Besides according to Miličić et al., (2017) and Rakocy et al., (2006) "in the United States of America, the history of aquaponics goes further back and a few medium scale commercial systems operate. Backyard aquaponics farming has also been quite popular in many regions. " This will certainly have been related to COST FA 1305 results in which some twenty-seven countries with around four researchers/professionals per country participate with scientific evidences proved and disseminated.
This evidence is still confirmed at the individual country level. Thus, aquaponics and aquaponics related percentized terms and GT searching appears with relevant results at the level of all COST participating countries (Annex A), except for a small minority of countries referred to in Annex B. However, we find that there are no results or data for aquaponics and aquaponics related percentized terms and no GT searches (whose values do not exist and are null) in countries that do not belong to COST Action FA 1305. (Appendix C).
Regarding to the search GT and percentilized terms of Hydroponics (H)/Aquaponics systems (AS)/commercial aquaponics (CA) results show there are generally no data available either worldwide or at European level. Aquaponics systems (AS) and CA are interpreted as a proxy that commercial aquaponics still has one long path to become an economically sustainable activity, although it is unanimously accepted by the scientific community as socio-economic and environmental sustainable. This evidence was also presented by Miličić et al., (2017) who, at European level, present the main political, administrative and institutional constraints (difficulties or lack of adequate legislation for the commercial development of aquaponics and at European level. Other EU level restrictions includes, according to these authors, the actual
non-certification of the production from aquaponics, namely, fish and vegetables, as organic production. Besides that, sometimes the organic phytopharmaceutical products used in aquaponics, namely, in fish production being more restricted than those used in organic farming due to the danger of killing the fish aquaponics production.
Another constraint to the development of these sustainable way of aquaponics production at the worldwide level, is the lack of vision of entrepreneurship from farmers in that activity, due the fact that it is still recent, and, therefore, to raise doubts of the producers as commercial activity. These results were confirmed by Love et al., (2015) who carries out a questionnaire to aquaponics farmers and commercials in the USA, where aquaponics has been more widespread. The results show that aquaponics was the primary source of income only for 30% of the respondents, while the others are hobbyists, research centers, etc. On the other hand, Miličić et al., (2017), in their study on commercial aquaponics development in Europe, showed that more than 45% of the European respondents actively looked-for ways to buy food from local farmers either at open markets or directly from their farms. That means in an economic way, nowadays, the demand for aquaponics food production can overcomes the respective supply. The yet high prices of aquaponics production (Miličić et al., 2017), could be symptomatic of that situation.
Table 1. Averages of the Percentized Hits in the Aquaponics and Aquaponics Related Terms in European Countries and in the World from 2014 to 2016 in a weekly base.
Aquaponics (%) Aquaculture (%) Fish Farming (%) Hydroponics /Aquaponics systems /Commercial Aquaponics (%)
Country Percentized Frequency (%)
Belgium 22 35 43 0 Croatia 23 42 35 0 Czech Republic 19 26 54 0 Denmark 20 27 53 0 France 3 20 77 0 Greece 23 41 36 0 Germany 16 27 57 0 Hungary 33 27 39 0
Iceland 0 51 49 0 Israel 0 51 49 0 Italy 16 31 52 0 Malta 12 46 42 0 (**) Netherlands 32 32 36 0 Norway 16 30 54 0 Poland 21 39 40 0 Portugal 23 43 34 0 Serbia 46 18 35 0 Slovenia 33 0 67 0 Spain 16 37 36 10 Sweden 26 25 49 0 Switzerland 26 27 47 0 Turkey 26 44 30 0 United Kingdom 16 27 57 0 European countries 20 32 47 0 (*) World 20 24 51 5 (*)
Source: The author results, 2017.
(*) The GT and percentilized search term of comercial aquponics just apppears about 5% at the last entire year (2016/2017) at World and EU countries from Appendix A.
(**) The country don’t belongs to the Aquaponics Hub.
Clusters of countries
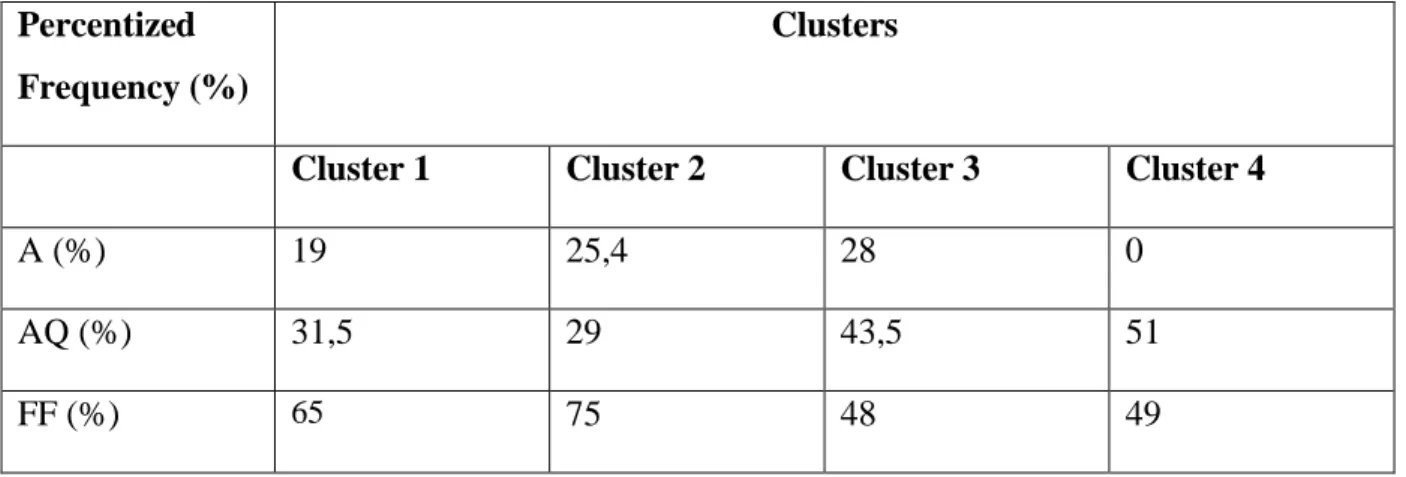
Table 2 presents the four clusters of countries based on percentized frequency of the respective normalized Google searches terms on Aquaponics (A), Aquaponics Systems (AS), Aquaculture (AQ), Commercial aquaponics (CA), Fish Farming (F) and Hydroponics (H) and from 2014 to 2016 as well as, the dummy variable for R&D (Research and Development) expenses per employer at agricultural sector according to Dos-Santos and Diz (2016), and data from OECD ANBERD STAN 3 and STAN 4 (Database for Structural Analysis (ISIC Rev. 4) –-The database from Organization for Economic Co-operation and Development (OECD, 2017) for R&D expenditures in low technology industries.We use the dummy variable because some countries are not data available. So, we correct by information ceded from our COST members participants.
Table 2. Clusters of countries based on averages of the Percentized Hits in the Aquaponics and Aquaponics Related Terms and R&D of each country
Cluster 1 Cluster 2 Cluster 3 Cluster 4
Czech Republic; France; Germany; Italy; Norway.
Denmark; Slovenia. Belgium; Croatia; Greece; Hungary; Netherlands; Poland; Portugal.
Serbia;
Slovenia.
Source: The author results, 2017.
Table 3. Clusters based on averages of the Percentized Frequency (%) Hits in the Aquaponics and Aquaponics Related Terms and R&D of each country
Percentized Frequency (%)
Clusters
Cluster 1 Cluster 2 Cluster 3 Cluster 4
A (%) 19 25,4 28 0
AQ (%) 31,5 29 43,5 51
FF (%) 65 75 48 49
Source: The author results, 2017.
The results from table 2 and table 3 highline confirm the same trend as occur at the European countries, the participant in Aquaponics Hub, there are significative differences among the clusters and the respective countries. Spain appears as an outlier, probably because some data are missing on the STAN database.
Represent the group of countries where percentized frequency on Fish Farming (F) is greater than half (65%); Aquaponics (A) is near than 1/4 (19%) and AQ is less than 1/3 (31,5%), respectively. Represent the cluster where A nowadays has the least importance among the countries at European Hub, representing only four countries.
Cluster II
Represent a small group of two countries (Denmark; Slovenia) where percentized frequency on Fish Farming (F) is greater than 75% in terms of percentilezed frequency, but A and AQ is greater than 20%, respectevely, 25,4% and 29%. This group presents quite the same percentilezed frequency of search terms in A and AQ, besides AQ have a long development before aquaponics. That reveals an increasing development in aquaponics nowadays, namely, in the development of the fish aquaponics systems.
Cluster III
Represent the highest group of countries where percentized frequency on Fish Farming (F) is less than half (48%), A is greater than ¼, (28%) and AQ is greater than 1/3%, respectively 43.5%. Like the cluster II this group clearly shows, on the one hand the increasing importance of aquaponics in these countries and on the other, the increasing importance of F associated with aquaponics and the practically absence of hydroponics.
Cluster IV
Serbia and Slovenia represent a small and unique countries where A are not yet representative in terms of frequency and F and AQ presents values quite similar, near half of the search, respectively, 51% per AQ and 49% per F. These two countries clearly show the need of more R&D in A to go further the aquaponics development.
4.1. Forecasting the potential development of aquaponics and aquaponics related terms
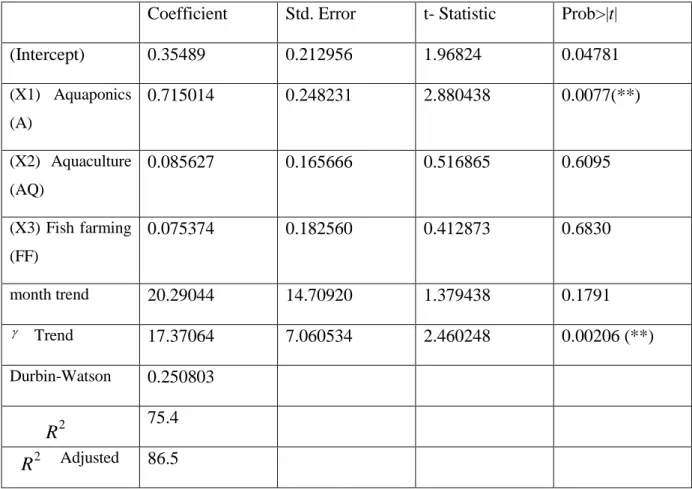
Table 4 presents the results of the econometric model 5 for forecasting the aquaponics and aquaponics related terms in conjoint format at European countries. The results highline confirm a positive trend of increasing of aquaponics at the general level, but cannot confirm the others trends referred to AQ of FF.
These results show that aquaponics is increasing and present a trend to grow in the future. Hence that is a sustainable and innovative practice of food production, the public decision-makers and the stakeholders should increase attention and importance to both European and national funds for R&D and improve the legislation as well as investment and support to entrepreneurs and research at public and private level.
Table 4. Forecasting model results
Coefficient Std. Error t- Statistic Prob>|t|
(Intercept) 0.35489 0.212956 1.96824 0.04781 (X1) Aquaponics (A) 0.715014 0.248231 2.880438 0.0077(**) (X2) Aquaculture (AQ) 0.085627 0.165666 0.516865 0.6095 (X3) Fish farming (FF) 0.075374 0.182560 0.412873 0.6830 month trend 20.29044 14.70920 1.379438 0.1791 Trend 17.37064 7.060534 2.460248 0.00206 (**) Durbin-Watson 0.250803 75.4 Adjusted 86.5
Source: The author results from EViews 9.5, 2017. Note: (**) indicate significance at the 10% level.
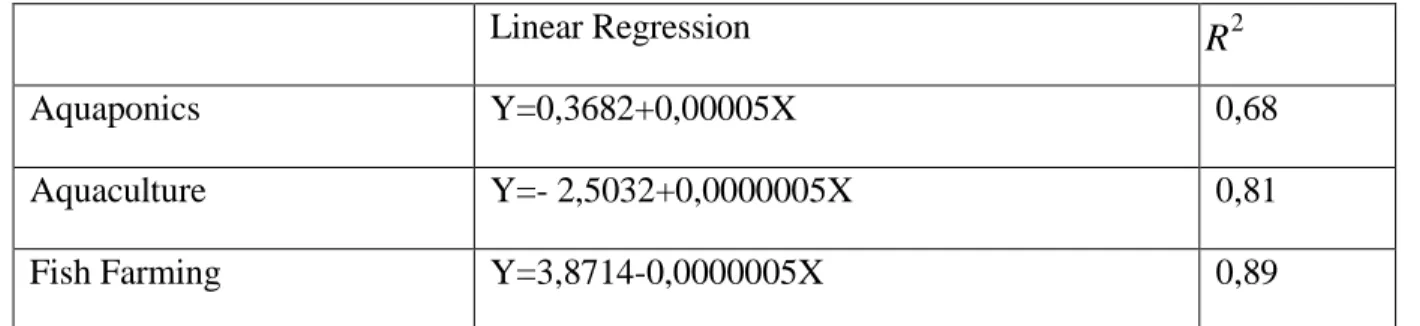
Table 5 presents the results of the linear regression model 6 for forecasting the aquaponics and aquaponics related terms at European countries. The results intents to present the separate about trend development of A; AQ; and FF but at individual level. The individual results highline confirm that aquaponics and aquaculture present a trend of grow for the future. But, on the opposite way, fish farming (FF) presents a trend of decreasing in a general way. These results are consistent with the aquaculture development (exponential according FAO, 2016) where fish farming has been not widespread due the beginning of aquaponics commercial development. So, FF is the fish production of aquaponics while aquaculture could be developed in cages at ocean on offshore.
R2
R2
Table 5. Forecasting model results from linear regression for Aquaponics and aquaponics related terms´trends in European Countries and in the World
Linear Regression
Aquaponics Y=0,3682+0,00005X 0,68
Aquaculture Y=- 2,5032+0,0000005X 0,81
Fish Farming Y=3,8714-0,0000005X 0,89
Source: The author results from Excell regression, 2017.
The forecasting results from linear regression for Aquaponics and aquaponics and related terms´trends in European Countries and in the World presented in Table 5 show, in general, a good adjustment to the data with the higth value of . .The results also confirm a increasing trend from aquaponics along the European and the World. The same trend occurs with aquaculture. But, on the opposite way, fish farming presents a negative trend.
5. Discussion
All the results from the previous methods used in this work confirm an increasing of importance of aquaponics in European countries and a respective trend of growing in the future, mainly in the COST participants countries. That reveals the importance of the scientific and professional results of the Aquaponics Hub cannot be neglected no more and should be replicated as an integral way of research and diffusion of innovations, between the scientific community and the respective stakeholders, mainly in innovative areas where knowledge is still dispersed but requires add value for innovation that can contribute to technological and social change.
Nevertheless, the present and increasing development of aquaponics, commercial aquaponics still has one long path to become an economically sustainable activity according to the low searching the percentilezed terms such as “Aquaponics systems” or “commercial aquaponics” who it is according to the previous authors. Besides that, the demand for aquaponics food production can overcomes the respective supply nowadays (according to the results of the previous works), but this subject requires a more detailed research.
R2
Whatever the result finds, the research in aquaponics must continuing to be done and in addition to privileging the improvement of technology, must also continue to involving multidisciplinary teams that deepen this COST Action and HUB that has now been initiated and which promote entrepreneurship and good management of aquaponics firms, as well as, the communication and dissemination of aquaponics as an environmentally sustainable and innovative practice among consumers, producers, public decision makers and stakeholders.
The results highline confirm that European countries have not the same development and interest about aquaponics, so, the research management must give more tools for the less development countries in this matter, in order they could achieve more fast the next stage of aquaponics development and multiply this innovation system of food production among others countries in other continents.
Conclusion
This study investigated the intriguing possibility to study the current development of aquaponics in Europe using quantitative analysis on “Big Data” for the first time, namely, by analyzing search query data from Google Trends to nowcast, forecast and provide new insights on the importance, the role and the new trends in aquaponics, and about the role of European Aquaponics Hub from COST FA 1305 in the process. Particularly, we aimed at promoting the international scientific debate in this field to achieve a sustainable development of aquaponics in Europe and the world. The main results confirm a growing trend in aquaponics nowadays, in Europe and mainly in COST and Aquaponics HUB country members. We demoted that the commercial development of aquaponics firms still has countless development opportunities to explore. For this process to be possible, the scientific community and public decision-makers will have to endure the longevity of this HUB and its extension to countries of other continents, so that a global effort can be made by joining research and improving communication efforts, so that aquaponics can, in the future, become a practice of production food and food supply chain, that brings significant environmental improvements to the society in general, allowing the consumption of fresh food by the population with greater economic, environmental and social efficiency, leading to a positive social and technological change in the world we live in.
Van der Geer, J., Hanraads, J.A.J., Lupton, R.A., 2010. The art of writing a scientific article. J. Sci. Commun. 163, 51–59.
Antal, M., & Van Den Bergh, J. C., 2016. Green growth and climate change: conceptual and empirical considerations. Climate Policy, 16(2), 165-177.
Amankwah-Amoah, J., 2015. Emerging economies, emerging challenges: Mobilising and capturing value from big data. Technological Forecasting and Social Change.
Axtell, R. L. Zip (2001). Distribution of US firm sizes. Science, 293, 1818–1820 (2001
Bangwayo-Skeete, P. F., & Skeete, R. W., 2015. Can Google data improve the forecasting performance of tourist arrivals? Mixed-data sampling approach. Tourism Management, 46, 454-464.
Betz, U. A., 2017. Is the force awakening?. Technological Forecasting and Social Change.
Besson, M., Aubin, J., Komen, H., Poelman, M., Quillet, E., Vandeputte, M., De Boer, I. J. M., 2016. Environmental impacts of genetic improvement of growth rate and feed conversion ratio in fish farming under rearing density and nitrogen output limitations. Journal of Cleaner Production, 116, 100-109.
Blazquez, D., Technological Forecasting & Social Change, 2017.
http://dx.doi.org/10.1016/j.techfore.2017.07.027 (accessed 10 September 2017).
Brabham et al., (2014)
Bosma, R. H., Lacambra, L., Landstra, Y., Perini, C., Poulie, J., Schwaner, M. J., Yin, Y., 2017. The financial feasibility of producing fish and vegetables through aquaponics. Aquacultural Engineering.
Buehler, D.; Junge, R., 2016. Global Trends and Current Status of Commercial Urban Rooftop Farming. Sustainability, 8, 1–16.
Brabham, D. C., Ribisl, K. M., Kirchner, T. R., & Bernhardt, J. M., 2014. Crowdsourcing applications for public health. American Journal of Preventive Medicine, 46(2), 179-187.
Brown, T. A., 2014. Confirmatory factor analysis for applied research. Guilford Publications.
COST FA1305., 2014. Memorandum of Understanding, Retrieved October 22.06.17, from:
Christakis, N. A. Fowler, J. H. Connected, 2009. The surprising power of our social networks and how they shape our lives, Little, Brown and Company.
Choi, H., & Varian, H., 2012. Predicting the present with Google Trends. Economic Record, 88(s1), pp. 2-9.
Dalsgaard, J., Lund, I., Thorarinsdottir, R., Drengstig, A., Arvonen, K., Pedersen, P. B., 2013. Farming different species in RAS in Nordic countries: Current status and future perspectives. Aquacultural engineering, 53, 2-13.
Dietrich, J. P., Schmitz, C., Lotze-Campen, H., Popp, A., & Müller, C., 2014. Forecasting technological change in agriculture—an endogenous implementation in a global land use model. Technological Forecasting and Social Change, 81, 236-249.
Dos-Santos, M.J.P.L., 2016. Smart cities and urban areas—Aquaponics as innovative urban agriculture. Urban Forestry & Urban Greening, 20, 402-406.
Dos-Santos, M. J. P. L., Diz, H., 2016. IMPACT OF CORPORATE R&D ON EFFICIENCY IN OECD INDUSTRIES. In 9th Annual Conference of the EuroMed Academy of Business.
Dos-Santos, M.J.P.L., 2013. Segmenting farms in the European Union. Agricultural Economics/Zemedelska Ekonomika, 59(2).
Du, R. Y., Hu, Y., & Damangir, S., 2015. Leveraging trends in online searches for product features in market response modeling. Journal of Marketing, 79(1), 29-43.
EU Aquaponics Hub., 2017. Realising Sustainable Integrated Fish and Vegetable Production for the EU https://euaquaponicshub.com/ (accessed 10 July 2017).
Fehr, E., 2014. Behavioural science –The economics of impatience. Nature, 415, 269–272.
Dittert, M., Härting, R. C., Reichstein, C., Bayer, C., 2018. A Data Analytics Framework for Business in Small and Medium-Sized Organizations. Smart Innovation, Systems and Technologies, 73, 169-181.
Junge, R., König, B., Villarroel, M., Komives, T., Jijakli, M. H., 2017. Strategic Points in Aquaponics. Water, 9(3), 182.
Fondeur, Y., & Karamé, F., 2013. Can Google data help predict French youth unemployment?. Economic Modelling, 30, 117-125.
Frizzo-Barker, J., Chow-White, P. A., Mozafari, M., Ha, D., 2016. An empirical study of the rise of big data in business scholarship. International Journal of Information Management, 36(3), 403-413.
Goddek, S., Delaide, B., Mankasingh, U., Ragnarsdottir, K. V., Jijakli, H., Thorarinsdottir, R., 2015. Challenges of sustainable and commercial aquaponics. Sustainability, Vol. 7 No 4, pp. 4199-4224.
Google Trends. 2017. Data normalization. https://support.google.com/trends/answer/4365533 (accessed 21 June 2017)
Hand, C., & Judge, G., 2012. Searching for the picture: forecasting UK cinema admissions using Google Trends data. Applied Economics Letters, 19(11), 1051-1055.
Hoes, A. C., Beers, P. J., Van Mierlo, B., 2016. Communicating tensions among incumbents about system innovation in the Dutch dairy sector. Environmental Innovation and Societal Transitions, 21, 113-122.
Horizon 2020. 2017. The EU Framework Programme for Research and Innovation.
https://ec.europa.eu/programmes/horizon2020/ (accessed 13 June 2017).
Kholodilin, K. A., Podstawski, M., & Siliverstovs, B. (2010). Do Google searches help in nowcasting private consumption? A real-time evidence for the US. KOF Working Papers n°256, April, Zurich.
Lal, R., 2016. Feeding 11 billion on 0.5 billion hectare of area under cereal crops. Food and Energy Security, 5(4), 239-251.
Love, D.C., Fry, J.P., Genello, L., Hill, E.S., Frederick, J.A., Li, X., Semmens, K., 2014. An international survey of aquaponics practitioners. PLoS One 9 (7), e102662.
Love, D.C., Fry, J.P., Li, X., Hill, E.S., Genello, L., Semmens, K., Thompson, R.E., 2015. Commercial aquaponics production and profitability: findings from an international survey. Aquaculture 435, 67–74.
Lu, T. C., Yu, T., & Chen, S. H., 2018. Information Manipulation and Web Credibility. Advances in Intelligent Systems and Computing, 618, pp. 86-95
Mavragani, A., Sypsa, K., Sampri, A., Tsagarakis, K. P., 2016. Quantifying the UK online interest in substances of the EU watchlist for water monitoring: Diclofenac, estradiol, and the macrolide antibiotics. Water, 8(11), 542.
Miličić, V., Thorarinsdottir, R., Santos, M. D., & Hančič, M. T., 2017. Commercial aquaponics approaching the european market: To consumers’ perceptions of aquaponics products in Europe. Water, 9(2), 80.
Nuti, S. V., Wayda, B., Ranasinghe, I., Wang, S., Dreyer, R. P., Chen, S. I., Murugiah, K., 2014. The use of google trends in health care research: a systematic review. PloS one, 9(10), e109583.
OECD. 2016. ANBERD for R&D expenditures in OECE Industries.
https://www.google.pt/url?sa=t&rct=j&q=&esrc=s&source=web&cd=1&ved=0ahUKEwiM7v 3JlL7WAhUFvBoKHVPbAtMQFggoMAA&url=https%3A%2F%2Fstats.oecd.org%2FIndex. aspx%3FDataSetCode%3DANBERD_REV4&usg=AFQjCNFdB3hF4Ah8qNuSV6Y2kr7yEB 6eBg . (accessed 17 March 2017).
Preis, T., Moat, H. S., Stanley, H. E., 2013. Quantifying trading behavior in financial markets using Google Trends. Scientific reports, Vol.3.
King, G., 2011. Ensuring the Data-Rich Future of the Social Sciences Science, 331, 719–721.
Klievink, B., Romijn, B. J., Cunningham, S., de Bruijn, H., 2017. Big data in the public sector: Uncertainties and readiness. Information Systems Frontiers, 19(2), 267-283.
Papadopoulos, T., Gunasekaran, A., Dubey, R., Altay, N., Childe, S. J., Fosso-Wamba, S., 2017. The role of Big Data in explaining disaster resilience in supply chains for sustainability. Journal of Cleaner Production, 142, 1108-1118.
Perc, M., 2012. Evolution of the most common English words and phrases over the centuries. J. R. Soc. Interface 9, 3323–3328.
Perlin, M. S., Caldeira, J. F., Santos, A. A., Pontuschka, M., 2017. Can we predict the financial markets based on Google's search queries?. Journal of Forecasting, 36(4), 454-467.
Petersen, A.M., Tenenbaum, J. N., Havlin, S., Stanley, H. E. Perc, M., 2012. Languages cool as they expand: Allometric scaling and the decreasing need for new words. Scientific Reports Vol. 2, pp. 943.
Kholodilin, K. A., Podstawski, M., Siliverstovs, B., 2010. Do Google searches help in nowcasting private consumption? A real-time evidence for the US.
Rakocy, J.E.; Masser, M.P.; Losordo, T.M., 2006. Recirculating Aquaculture Tank Production Systems: Aquaponics—Integrating Fish and Plant Culture, SRAC Publication No. 454. 2006.
Available online: http://www2.ca.uky.edu/wkrec/454fs.PDF (accessed on 05 September 2017).
Silva, E., & Marote, E., 2013. The importance of subsidies in Azorean dairy farms’ efficiency. In Efficiency Measures in the Agricultural Sector (pp. 157-166). Springer Netherlands.
Silva, E., Marta-Costa, A. A., Berbel, J. (2015). The Objectives and Priorities for the Azorean Dairy Farmers’ Decisions. In The Agricultural Economics of the 21st Century, 137-156. Springer International Publishing.
SCOPUS Database., 2017. Document search
(https://www.scopus.com/search/form.uri?display=basic&clear=t&origin=searchauthorlookup &txGid=33ff54ca7f5876f7bc12cdc40745372b Retrieved at 22/08/2017).
Smith, S., & Cameron, A., 2017. Horticulture: Outlook to 2021-22. Agricultural Commodities, 7(1), 73.
Somerville, C., Cohen, M., Pantanella, E., Stankus, A., & Lovatelli, A. (2014). Small-scale aquaponic food production: integrated fish and plant farming. FAO Fisheries and Aquaculture
Technical Paper, (589), I.
Troumbis, A. Y., 2017. Google Trends and cycles of public interest in biodiversity: the animal spirits effect. Biodiversity and Conservation, 1-23.
Van Ginkel, S. W., Igou, T., Chen, Y., 2017. Energy, water and nutrient impacts of California-grown vegetables compared to controlled environmental agriculture systems in Atlanta, GA. Resources, Conservation and Recycling, 122, 319-325.
Vespignani, A., 2009. Predicting the Behavior of Techno-Social Systems. Science Vol. 325, pp. 425–428.
Vicente, M. R., López-Menéndez, A. J., & Pérez, R., 2015. Forecasting unemployment with internet search data: Does it help to improve predictions when job destruction is skyrocketing?. Technological Forecasting and Social Change, 92, 132-139.
Vosen, S., & Schmidt, T., 2011. Forecasting private consumption: survey‐based indicators vs. Google trends. Journal of Forecasting, 30(6), 565-578.
Won, M., Marques-Pita, M., Louro, C., Gonçalves-Sá, J., 2017. Early and Real-Time Detection of Seasonal Influenza Onset. PLoS computational biology, 13(2), e1005330.
Yang, X., Pan, B., Evans, J. A., Lv, B., 2015. Forecasting Chinese tourist volume with search engine data. Tourism Management, 46, 386-397.
Yu, T., Chen, S. H., Wang, C. H., 2018. Information Aggregation in Big Data: Wisdom of Crowds or Stupidity of Herds. Advances in Intelligent Systems and Computing, 618, 16-27.
Appendix A- European countries participants in COST Action FA 1305:
Belgium (BE); Croatia (CR); Czech Republic CZ); Denmark (DE); France (FR); Germany (GE); Greece (GR); Hungary (HU); Iceland (IC); Israel (IS); Italy (IT); Malta (MA); Netherlands (NE); Norway (NO); Poland (PD); Portugal (PT); Serbia (SE); Slovenia (SL); Spain (SP); Sweden (SW); Switzerland (SW); Turkey (TK); United Kingdon (UK) and World (W).
Appendix B - Missing Google Trends data from the following countries participants in COST Action FA 1305: Austria; Bosnia and Herzegovina; Finland; fYR Macedonia and
Sweden
Appendix C- European countries not participants in COST Action FA 1305: Cyprus,
Latvia, Lithuania, Luxembourg, Romania and Estonia.
Acknowledgments
Whatever the result finds, the research in aquaponics must continuing to be done and in addition to privileging the improvement We acknowledge financial support from the Action COST FA 1305 funded through the Horizon 2020, as well as, the ISCTE-IUL and the help and suggestions in GT data from Christopher Williams and Ragnheiður Þórarinsdóttir.