SATISFACTION AND LOYALTY OF CUSTOMERS OF A
FINANCIAL INSTITUTION
:
A CASE STUDY
Abstract
The present study aims to observe and evaluate the customer satisfaction and customer loyalty of Caixa de Crédito Agrícola Mútuo da Região de Bragança e Alto Douro. With this analysis is intended that the administration of the institution identify and assess strengths and weakness that may be able to improve.
Thus, applying the European Customer Satisfaction Index model a survey was carried out by questionnaire to customers of financial institution object of study , where the size of the sample was 1705 customers.
From the results obtained based on descriptive and inferential analyses as well as logistic regression models, was possible to verify the existence of statistically significant relationships between latent variables of the model in study.
Keywords
1.
INTRODUCTION
This study was designed to evaluate the satisfaction and loyalty of Caixa de Crédito Agrícola Mútuo da Região de Bragança e Alto Douro (CCAMRBAD), as well as to verify its evolution and progress throughout the years with the extent of the economic and financial crisis that we are witnessing. Applying the European Customer Satisfaction Index (ECSI) model, was carried out a survey to customers of the institution in study.
With consumers becoming more and more selective and demanding becomes essential to be more careful in provision of services, specifically in the information they transmit to bank customers. Increasingly there have been demands by the Bank of Portugal in this area in order to promote the transparency and the accuracy of the information provided to consumers.
Given the framework of Caixas de Crédito Agrícola in the Portuguese financial system and the constant changes taking place in the same leads to the taking of a new position in terms of operating practices and definition of new strategies. Changes in this segment mainly by the crisis but also due to new technologies and the constant innovations that will somehow condition the basic law of supply and demand (Mendes & Ratanji, 2009). With these changes in the market, customers become more and more selective and demanding gaining bargaining power, so there is a need of companies to come up with different strategies so that the main asset in a financial institution is the client. It is imperative the interest in keeping existing customers for the sake of winning new customers. With this comes the need to study the satisfaction and loyalty of customers.
The work is structured as follows: starts with the methodology applied; a short review of the literature that address key issues of the study; the results; and the main conclusions.
2.
M
ETHODOLOGYThis study aims to analyze the satisfaction of customers of CCAMRBAD, that is, customers who go to the 20 agencies in the Region, in 2011, 2012 and 2013, as well as to identify the factors that are decisive in their satisfaction.
The sample collection was based on customers who went to the 20 agencies and made daily movements: cash withdrawal, transfers to saving accounts or term deposit constitution. The sample was calculated by a system belonging to the institution, obtaining a sample of 1705 customers in the three years.
In this study is applied the ECSI Portugal which is a system of measurement of service quality available in the market, through customer satisfaction. The data collected from the implementation of questionnaires to customers of the financial institution is used to estimate the model of customer satisfaction. It is the estimation of this model that provides the levels of satisfaction.
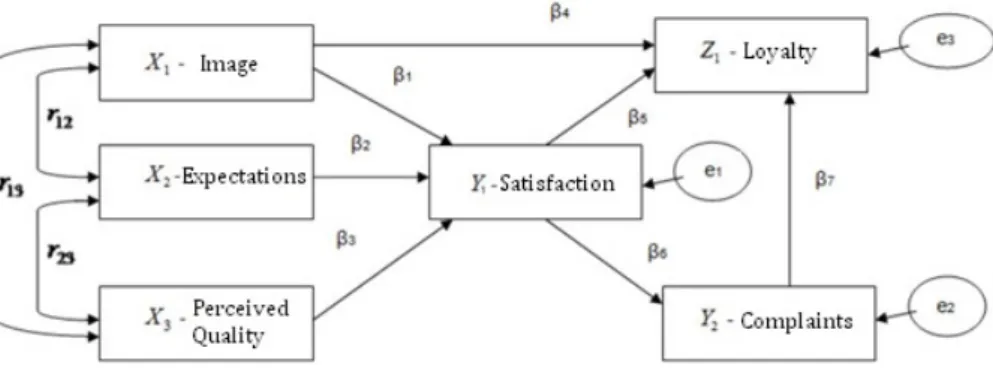
Table 1 – Research Hypotheses
H1: Image positively influences Customer Satisfaction
H2: Image positively influences Customer Expectations
H3: Image positively influences Customer Perceived Quality
H4: Expectations positively influence Customer Perceived Quality
H5: Expectations positively influence Customer Satisfaction
H6: Perceived Quality positively influences Customer Satisfaction
H7: Customer Satisfaction positively influences not formalization of complaints
H8: Image positively influences Customer Loyalty
H9: Complaints made by customers positively influence Customer Loyalty
H10: Customer Satisfaction positively influences their Loyalty
It should be noted that was proceeded to an analysis to the internal reliability of the data collection instrument, for this purpose was used the Alpha Cronbach coefficient. Thus, it is noted that the Alpha Cronbach coefficients have values above 0.7 in all the years for the indicator Image which indicates, according to the classification given by Hill and Hill (2002) that exists a good internal consistency. As regards to Perceived Quality since Alpha Cronbach takes values greater than 0.8 with an average of 0.925 for all the years in study this indicator also shows an excellent internal consistency.
Data processing was performed through descriptive and inferential statistics using parametric and non-parametric tests as well as logit regression models. Concerning the descriptive statistics was used relative and absolute frequencies as well as cross-tabulations variables. As measure of central tendency was used the average and as dispersion measures the standard deviation.
Figure 1 – Adapted structure from the structural model ECSI (Portugal)
As for inferential statistics was resorted the estimation of the Customer Satisfaction evaluation model based on the ECSI model. To study the relationships between variables of the model in question, in order to go meeting with the hypotheses and assumptions in the study, was made a division in the model. A first division is regarded to exogenous variables in which their relationship is merely correlated with no cause-effect relationship. The remaining divisions will be determined by three models. Since the goal that is intended to achieve consists in quantify and explain the occurrence of a dichotomous outcome. The models proposed were estimated by logit models which consists of a univariate and multivariate technique that allows us to estimate the probability of whether or not a prediction of an dependent binary result can occur from a set of independent variables (Pestana & Gageiro, 2005).
< < < !" #$ $%&'( <) * +# %, - ./ 0%$1 2 3
4 5 < <6 7 $%(8 #$%&' 243
9 5 : ; < 5= < <> <? 7 $%(8 @ABCD <E F& "0 %'$ 2G3
The estimated model by logistic regression methodology is validated by the test Likelihood ratio which leads to the conclusion that there is at least one independent variable with enough predictive power on the dependent variable. On the other hand, the application of the chi-square test, from Log Likelihood statistic, concludes on the quality of the model. Still in the quality analysis are considered the values of the pseudo R2
(coefficient of determination). In order to evaluate the closeness of estimated values before the observed values was resorted to the adjustment test of Hosmer-Lemeshow as well as it is analyzed the sensitivity and specificity of the model.
Finally, it is analyzed the significance of the independent variables coefficients by Wald test and it’s made the interpretation of the obtained estimations.
3.
L
ITERATURE REVIEWThis article follows with a theoretical Framework, which outlines issues such as the Framework of Caixas de Crédito Agrícola in the context of the Portuguese banking segment, a transition of a transactional marketing to relational marketing, the various models to assess the service quality and make a quick approach to theoretical terms of customer satisfaction and customer loyalty.
3.1.
THE CRÉDITO AGRÍCOLA IN THE PORTUGUESE BANK SEGMENT CONTEXTThe Crédito Agrícola (CA) is a financial group with Cooperative basis whereby the comprehension and the study of Cooperativism is of paramount importance.
The International Cooperative Alliance (ICA) defines a cooperative as “an association of autonomous people who together volunteer to meet their common needs, economic social and cultural common aspirations, through a jointly owned company that is democratically controlled” (Birchall, 2004:11).
Cooperatives differ from corporations primarily for their governance, their rights are based on the association and not the size of the share of the vote. Cooperatives also differ from philanthropic foundations whose configuration tends to benefit the needs of its members, rather than the needs of others (Nair & Kloeppinger-Todd, 2007).
Currently the CA consolidates its position as a financial group of national dimension with about 400 thousand members, 1.2 million customers, especially small and medium savers, landowners and small and medium enterprises and traders. It has a population of 83 local authorities holding about 700 branches across the country making it one of the leading financial groups in the segment. The Caixas de Crédito Agrícola Mútuo (CCAM) are credible institutions that value the relationship with the customer and the socio-economic development throughout the country supported by the performance of each of its Caixas at a regional level (CA, 2015).
3.2.
RELATIONAL MARKETING
affordable prices. This type of marketing also creates strong economic, technical and social ties between the organization and stakeholders (Kotler, 2002).
The changes taking place in the banking sector mean that companies in the sector in order to dispute the market, should rectify their operating practices and define new strategies which should take into account the relationship with the market especially with customers so that there are new benefits through income and reciprocal benefits (Polidoro, 2006).
These changes mean that customers are one of the main assets of the banks, since with this dynamic market and competitiveness in the segment customers gain bargaining power, turn themselves more selective and informed and naturally are more demanding which leads to the companies to direct their attention to a relational marketing (Holanda, 2008). The replacement of customers lost is costly for companies because the acquisition of new customers involves additional costs in advertising and sales promotions (Zeithaml et al. 1996).
The need to impose a more defensive strategic posture focused on a relational marketing is due to the fact of also being a very limited growth sector and where the difference between competing products and services is marginal (Vilar, 2004).
3.3.
THE USE OF ECSI MODEL TO EVALUATE SERVICE QUALITY
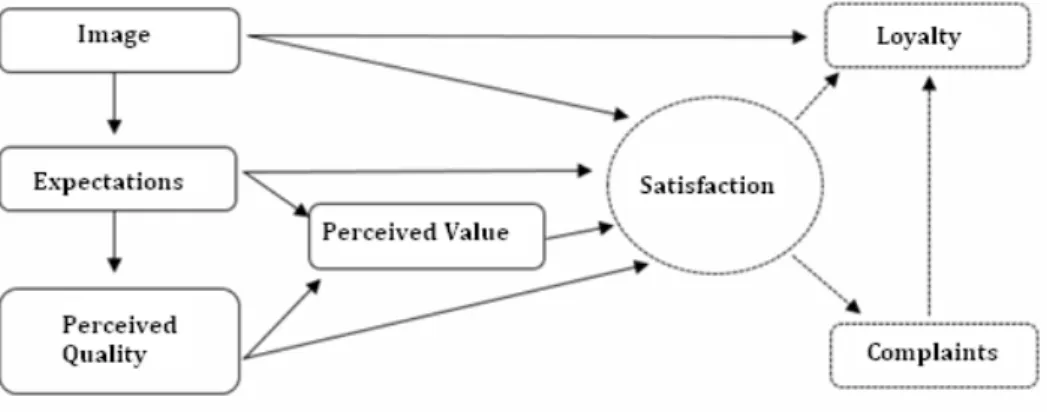
The European model is a variation of the US American Customer Satisfaction Index model (ACSI), which in turn is based on the Swedish Customer Satisfaction Index (SCSI) (Johnson et al. 2000). The European Customer Satisfaction Index (ECSI), being adapted based on the preceded models, integrates as part of customer satisfaction determinants the Expectations, Perceived Quality, Perceived Value, Customer Satisfaction, Complaints and Customer Loyalty also molded in previous models. Fundamentally what differs from ACSI is that ECSI incorporates the company’s Image as a determinant of satisfaction that has direct effects on Expectations, Perceived Quality, Customer Satisfaction and Loyalty (Johnson et al., 2000).
Figure 2 – Basis structure of the structural model ECSI Portugal
3.4.
CUSTOMER SATISFACTION AND CUSTOMER LOYALTY
Consumer Satisfaction is a central concept in modern thought and marketing in their practice. As mentioned above, the new marketing concepts emphasize the transmission of satisfaction, not just products, to the consumers in order to make profits out of it (Yi, 1989).
customers of companies to achieve total satisfaction, as if this not occur, the company does not become competitive and becomes unable to retain its customer base (Mittal, 2014).
The management literature claims that customer satisfaction is the result of perceptions that consumers have from the amount received during a transaction or relationship where the value equals perceived service quality (Hallowell, 1996).
Keeping customers happy is still seen as important for companies to achieve success. However, the importance of customer satisfaction differs based on the degree of hedonism and benefits that company offers has to give (Mittal, 2014).
In the banking segment customer satisfaction key element is the nature of relationship between the client and the service. However, the quality thereof is usually indicated as a requirement to satisfy and retain customers (Hoq & Amin, 2010).
However, satisfaction alone is not enough to explain in the fullest customer loyalty, Jones and Sasser (1995) and Oliver (1999) argue that loyal customers are not necessarily satisfied customers, but customers satisfied tend to be loyal customers by advocating that satisfaction is an indisputable determinant of loyalty.
For companies that already have a strong focus on service, future improvements in service can come only through the addition of new programs betting on endomarketing to their employees in order to achieve better productivity and efficiency with consumers (Zahorik, 1993).
The best customers, they say, are the loyal ones. Cost less to serve and are usually willing to act as marketers for the company, not to mention a willingness to pay more than others consumers for the same service/product. A plausible argument for the idea of an existence of a connection between a loyal customer and a reduced cost compared to other types of clients may be built in the idea that consumers are more familiar with the company’s transaction processes resulting in less time spent, which for the organization will be more practical and less expensive. Another claim is that loyal customers are willing to pay higher prices for the same service/product. In this case if the customer loyalty doesn’t generate less expensive prices at least is able to generate more revenue. Finally, there is the advantage of long-term customers working as company advocates and this conceives great marketing results since mouth-to-mouth marketing is extremely effective (Reinartz & Kumar, 2002).
4.
P
RESENTATION AND RESULTS ANALYSISTo perform the tests was necessary to add the 20 agencies in groups, since the study had some agencies that had a few samples relative to others. As a criterion for the compression of the agencies in groups was taken in regard its geographical proximity. With this, the 20 agencies were grouped in the following structure: - Group 1 (G1): County of Bragança and Vinhais;
- Group (G2): County of Macedo de Cavaleiros, Mirandela and Valpaços; - Group 3 (G3): County of Alijó, Murça and Sabrosa.
In 2011 were surveyed 564 customers of CCAMRBAD which represents 33.1% of the entire sample collected over the three years. It is noted that these 564 customers, 41.8% are of the agencies of Bragança and Vinhais, 34.5% of Macedo, Mirandela and Valpaços and 24.7% of Alijó, Murça and Sabrosa.
In 2012 were surveyed 537 customers representing 31.5% of the sample. Of these 537, 27.1% are of agencies of Bragança and Vinhais, 31.3% of Macedo, Mirandela and Valpaços and 35.2 of Alijó, Murça and
Sabrosa.
In turn, in the year 2013 were collected 604 clients representing 35.4% of the sample collected in the three years. It appears that of these 604 clients, 31.3% are of the agencies of Bragança and Vinhais, 34.2% of
Table 2 - Characterization of sample per year
Year 2011 Year 2012 Year 2013 Total
n % n % n % n %
Type Client Particular
Company 487 77 86.3 13.7 483 54 89.9 10.1 530 74 87.7 12.3 1500 205 88.0 12.0
Gender Men
Female 426 138 75.5 24.5 358 179 67.0 33.0 393 211 65.0 35.0 1177 528 69.0 31.0
Antiquity Up to 5 years
Over 6 years
59 505 10.5 89.5 33 504 6.1 93.9 71 533 11.8 88.2 163 1542 9.6 90.4 Frequency Daily Weekly Monthly 61 280 223 10.8 49.6 39.5 39 197 301 7.3 36.7 56.1 36 174 394 5.9 28.9 65.2 136 651 918 8.0 38.1 53.9
Table 2 shows that 88% of customers in the sample are the particular type and the remaining 12% are companies. Based on the time frame of the study it is concluded that private customers are always in the majority and above the 86% of the total.
As for the gender was found that 69% of all respondents were male and 31% were female. Over the years we observe a decrease of male customers and increase in females.
Concerning the antiquity it was observed that 90.4% of the entire sample customers are clients for more than 6 years already, this fact is repeated in each of the years in study.
As for the frequency that the client uses the counter can be seen that the majority, 53.9% do visit the counter monthly, 38.1% weekly and only 8% make it every day. In view of the year it appears that in 2011 the majority of customers, 49.6% appealed to the bank weekly but this rate decreases in the following years. It was also made the analysis of the Customer relation with CCAMRBAD in according to the year and it was found that most customers, up from 85% reported CCAMRBAD is their main bank. Also in all the years under study CCAMRBAD recommendation status from their customers was up to 98%. Also approximately 98% in each year said the CCAMRBAD properly clarifies its customers and also notes that most never presented any suggestion for improvement. As to problems with CCAMRBAD only 2% said they had a problem of which the majority said the issue was resolved. However, the percentage of customers who said that the issue was resolved decreased over time.
In Table 3 can be found the characterization of Satisfaction with Image, Perceived Quality and Satisfaction in general, for each year under review.
Table 3 - Characterization of Satisfaction with Image, Perceived Quality and General Satisfaction.
year n Theoretical
Minimum Theoretical Maximum Theoretical Average Empirical Minimum Empirical Maximum Empirical Average Standard Deviation Image 4 Items 2011 2012 2013 Total 564 537 604 1705 4 4 4 4 20 20 20 20 12 12 12 12 10 10 12 10 20 20 20 20 17.915 18.145 18.591 18.227 2.118 2.092 1.749 2.006 Perceived Quality 14 Items 2011 2012 2013 Total 564 537 604 1705 14 14 14 14 70 70 70 70 42 42 42 42 27 42 43 27 70 70 70 70 64.264 64.490 66.101 64.986 5.692 6.339 5.038 5.746 General Satisfaction 1 Item 2011 2012 2013 Total 564 537 604 1705 1 1 1 1 5 5 5 5 3 3 3 3 2 3 2 2 5 5 5 5 4.590 4.587 4.692 4.625 0.572 0.543 0.532 0.551
values, noting that the empirical values are considerably higher than the theoretical values, which indicates that there is a positive perception about Perceived Quality and Image of CCAMRBAD by its customers and that the customers have expressed high levels of satisfaction.
For the study in hand the dependent variable Satisfaction was rethought and grouped into two types of customers: “Satisfied and Very Satisfied” and “Totally Satisfied”, as only 0.4% said they were dissatisfied and only 2.4% said satisfied.
Therefore, 0.4% dissatisfied were excluded and was joined the satisfied faction to the very satisfied one. Thus the new variable of satisfaction includes now only two classes, the “Satisfied and Very Satisfied” and the “Totally Satisfied”.
Taking into account the model equations to test the relationships between the variables Image, Expectations and Perceived Quality prior to Satisfaction and taking into account the nature of these variables and its connections, it was performed an analysis through Pearson correlations. Thus it was found that only the coefficient of correlation between the variables Image and Perceived Quality is statistically significant, its value indicates a strong correlation and in the direct direction (r=0.867). In other words a better perception of Image leads to a better Perceived Quality and vice versa.
The three remaining models previously shown, namely [1], [2] and [3] are then analyzed. The first model presupposes a cause and effect relationship between the exogenous latent variables and the variable endogenous (mediator) Customer Satisfaction. In the second model is tested the relationship between Customer Satisfaction with the consequent variable of Satisfaction, Complaints. The third model allows to study the relationship between Satisfaction, the mediating variable Complaints, the antecedent variable Image with the dependent variable Loyalty. The latent variable is determined not through all the issues relating to Loyalty but only through the second issue associated with Loyalty that is of dichotomous nature: “In addition of being a client of CA, are you a client of another bank?.
Table 4 – Compilation of Regressions
Variables
Model 1 Model 2 Model 3
B p-value Exp (B) B p-value Exp (B) B p-value Exp (B)
Constant -26.778 <0.001 0.000 5.223 <0.001 185.500 -0.813 0.222 0.443
Image 0.496 <0.001 1.642 -0.043 0.213 1.044
Expectations 0.626 0.070 1.871
Perceived Quality 0.257 <0.001 1.292
Satisfaction -2.279 <0.001 0.102 -0.573 <0.001 0.564
Complaints -0.494 0.213 0.610
Likelihood Ratio <0.001 <0.001 <0.001
-2 Log Likelihood 1180.932 304.987 2284.376
Cox & Snell R Squared 0.445 0.021 0.029
Nagelkerke R Squared 0.615 0.115 0.038
Hosmer-Lemeshow 0.195 0.063
Note: B- estimated coefficient ; Exp (B) – exponential of the estimated coefficient
In Table 4 was presented a compilation of the regression test results performed on the variables of the three estimated models as well as the test results of likelihood ratios and the respective coefficients of determination. In the three models is concluded that there is at least one independent variable in the model with predictive power on the dependent variable. As for the values of pseudo R2 of Cox-Snell (0.445) and
(0.115) for model 2 revealing little adequate quality and finally Cox-Snell (0.029) and Nagelkerke (0.038) revealing little adequate quality of the estimated model to model 3.
According to the Hosmer-Lemeshow adjustment test it can be concluded that in the three models the estimated values are close to the observed values.
According to Wald tests, on model 1, the variables Image and Perceived Quality are significant. Therefore the customer odds ratio of being totally satisfied is 1.642 in each point of Image as well as the odds ratio for the client to be totally satisfied is 1.292 for every point in Perceived Quality. In other words, the chances a customer is fully satisfied increase 64.2% for each increase of one point in Image. So similarly the odds of a client being fully satisfied increase 29.2% for each increment of a point on Perceived Quality.
Regarding model 2, the significant variable in it its Satisfaction. Thus, the odds ratio of a client making a complaint decreases with increasing satisfaction. It can be said that being totally satisfied induce a decrease of about 90% to hold a complaint.
Finally, in model 3 the variable Satisfaction is significant. Thus, the odds ratio of not being a Customer of another bank is 0.564 when the client is fully satisfied. In other words, the probability of not being client of another bank always decreases 43.6% if the customer is fully satisfied.
In short, in Table 5 the hypotheses under consideration in the study and the respective diligence can be observed.
Table 5 – Brief analysis of the hypothesis under study
Hypothesis Diligence Significance Test Used
H1: Image positively influences Customer
Satisfaction Validated 5% Regression (Model 1)
H2: Image positively influences Customer
Expectations Indirect Weak relationship - Pearson Correlations
H3: Image positively influences Customer
Perceived Quality Direct Strong relationship - Pearson Correlations
H4: Expectations positively influence Customer
Perceived Quality Indirect Weak relationship - Pearson Correlations
H5: Expectations positively influence Customer
Satisfaction Not Validated - Regression (Model 1)
H6: Perceived Quality positively influences
Customer Satisfaction Validated 5% Regression (Model 1)
H7: Customer Satisfaction positively influences
not formalization of complaints Validated 5% Regression (Model 2)
H8: Image positively influences Customer Loyalty Not Validated - Regression (Model 3)
H9: Complaints made by customers positively
influence Customer Loyalty Not Validated - Regression (Model 3)
H10: Customer Satisfaction positively influences
their Loyalty Validated 5% Regression (Model 3)
5.
CONCLUSIONS
variable Image and Perceived Quality with Customer Satisfaction and that higher Customer Satisfaction leads to the no formalization of complaints, indicating that also exists a relation between Satisfaction and Complaints. Finally, it was also found that there is a direct relationship between Satisfaction and Customer Loyalty.
Given the above it is concluded then that aspects and civic, physical and professional characteristics in each collaborator – sympathy, education, availability, kindness, confidence, competence, patience, clarity, good presentation, seriousness, professionalism, speed in solving problems and clarity of the information that employees give – are indeed important for the customer contentment in the service concerns. Not only have the human resources directly influence the Image of the institution or the Perceived Quality also the organization itself and its strategies in relation to services and products that the institution launches in the market, innovation and the privacy of customer information has effects on Customer Satisfaction. Going for what was postulated theoretically it appears that greater customer satisfaction leads to no formalization of complaints and also was verified that there is a direct relationship between customer satisfaction and the consequent variable loyalty thereof.
Given that the institution had previously structured the survey on which the study was based it can be said that somehow there was limitations in this aspect since the scales used in the data collection instrument are unbalanced and may have influenced and affected the final analysis.
As suggestion for improvement, not only for future researches in the area but also for practical applications for the institution, in order to achieve more tangible and reliable results, it is suggested a restructuring of the questionnaire not only to balance the scales used to mediate variables but also a restructuring on its modules. Since results haven’t meet the expectations the questionnaire is structured to analyze customer satisfaction with aspects that are not connected to the financial crisis which prevents any relationship between satisfaction with this issue and can only reap results for factors as sympathy, education, availability, integrity, professionalism of employees, quality and location of premises. With that is strongly suggested an addition of a new variable “Financial Crisis” which required a structure of its own module for this variable.
BIBLIOGRAPHICAL REFERENCES
BIRCHALL, J. (2004). Cooperatives and the Millennium development goals. International Labour Office, Geneva.
HILL, M. & HILL, A. (2009). Investigação por Questionário. 2ª Edição, Lisboa: Edições Sílabo.
HOLANDA, S. (2008). Os antecedentes da lealdade no contexto bancário: um estudo com clientes de segmento empresa. Universidade de Coimbra – Faculdade de Coimbra. Coimbra, Portugal.
HOQ, M. & AMIN, M. (2010). The role of customer satisfaction to enhance customer loyalty. African Journal of Business
Management, 4 (12), 2385-2392.
JOHNSON, M., GUSTAFSSON, A., ANDREASSEN, T., LERVIK, L. & CHA, J. (2000). The evolution and future of national customer satisfaction index models.
JONES, T. & SASSER, W. (1995). Why Satisfied Customers Defect. Harvard Business Review, 1-14.
KOTLER, P. (2002). Marketing management. Millennium edition. University of Phoenix. Arizona, United States.
MITTAL, V., PALLAS, F. & GROENING, C. (2014). Allocation of Resources to Customer Satisfaction and Delight Based on Utilitarian and Hedonic Benefits. Journal of Research in Marketing, 2 (1), 106-112.
NAIR, A. & KLOEPPINGER_TODD, R. (2007). Reaching rural areas with financial services: lessons from financial cooperatives in Brazil, Burkina Faso, Kenya and Sri Lanka. Agriculture and Rural Development Discussion Paper, 35.
OLIVER, R. (1999). Whence Consumer Loyalty?. Journal of Marketing, 63, 33-44.
PESTANA, M. & GAGEIRO, J. (2005). Descobrindo a regressão com a complementaridade do SPSS. Edições Sílabo. Lisboa, Portugal.
POLIDORO, E. (2006). Satisfação e fidelização do cliente bancário: o marketing de relacionamento como base na lealdade de clientes. Faculdade XV de Agosto. São Paulo, Brasil.
RATANJI, D., & MENDES, R. (2009). A nova era do marketing na banca. Revista Científica do ISCET, 1, 59-68.
SHETH, J. (2002). The future of relationship marketing. Journal of Services Marketing, 16(7), 590-592.
VILAR, E. (2004). Imagem da banca: análise empírica de determinantes e efeitos. Instituto Superior de Ciências do Trabalho e da Empresa. Lisboa, Portugal.
YI, Y. (1989). A critical review of consumer satisfaction. Division of Research, School of Business Administration.
ZAHORIK, A. & RUST, R. (1993). Customer Satisfaction, Customer Retention, and Market Share. Journal of Retailing, 69 (2), 193-215.