ЭКОНОМИКА РЕГИОНА № 4/2010 The paper is dedicated to development of a
meth-odology for assessment of customer satisfaction with the products and services on the b2b market. The study of customer satisfaction is aimed at building strong and mutually beneficial supplier-customer relationship. The authors focus on the importance of customer satisfaction continuous monitoring intended for improvement of the company’s market performance. The research based on the works by N. Kano, J.-J. Lamben, R. Carter, A. Parashuraman, V. A. Zeitaml, L. L. Berry and oth-ers, describes an algorithm study of consumers and of-fers a methodology to evaluate customer satisfaction with the industrial products.
Based on the analysis of the economic crisis effects on the machine-building industry, the authors deter-mine the performance of “Pnevmostroimashina” JSC on the road and construction equipment market and illustrate an example of practical use of the customer satisfaction assessment technique in the company. At the end of the paper some recommendations for devel-opment of an efficient customer satisfaction measure-ment procedure are introduced.
L. M. Kapustina, A. V. Babenkova
assEssmEnt of businEss customErs satisfaction with thE products
and sErVicE of pnEVmostroimashina, jsc, on thE b2b markEt
The global financial crisis revealed weaknesses of the domestic machine-building industry and had a negative effect on the Russian industrial enterprises. Thus, a sharp decline in demand for road-construc-tion equipment from operating organizaroad-construc-tions re-sulted in stockpiling of this type of equipment in the manufacturers' warehouses. The financial difficul-ties caused by resection in sales led to reduction and even suspension of many productions. In turn, this trend influenced drop in demand for components, and, as a consequence, stirred up financial instabil-ity of assembler-producers.
Understanding of the need for reorientation of marketing activities by the owners and managers of industrial enterprises is another specific feature of the crisis. The main emphasis is put now on im-provement of compliance with discerning taste and specific requirements of a particular customer rather than on maximizing profits. Drucker P., the man-agement guru, wrote: «There is only one legitimate justification for conducting business: creating a sat-isfied customer» [1].
cus-ЭКОНОМИКА РЕГИОНА № 4/2010
tomers, attract new clients and effectively interact with them at all stages of purchase: from producing in accordance with individual requirements to selling goods and providing after-sales service. This is one of the most challenging marketing issues. In case of b2b markets, the mentioned problem can be solved by sat-isfaction level monitoring of the key customers.
Despite the fact that a lot of works by Russian and foreign authors are devoted to the aspects of customer relationships, many statistical methods for measurement of customer-supplier interaction efficiency were developed; but so far there is no ef-fective tool for assessment of customer satisfaction with product quality and service level. The problem of measuring customer satisfaction is still not studied well.
A theoretical background for customer satisfaction analysis
There is a variety of methodological approaches to evaluation of customer satisfaction with con-sumer goods and industrial products. Different al-gorithms, methods and rating scales are proposed. Meanwhile, a few studies are devoted to develop-ment of a universal methodology for customer sat-isfaction assessment.
In the majority of methodological approaches re-spondents are required to evaluate products, services and business performance according to a number of criteria. Thus, in 1995 Carter R. advocated a com-prehensive approach to supplier selection by a cus-tomer. This approach is known as “Carter's 10 Cs for supplier selection” [2]:, namely: Competence: all staff, all the time requires evidence; Capacity: sufficient and flexible; Commitment: to quality — quality systems; Control: control of the process; Cash: sufficient funds for the business; Cost: cost/ price relationships and total cost of ownership; Consistency: consistent production of goods or serv-ices; Culture: compatible with similar values; Clean: environmentally sound, conforming with legislative requirements; Communications: a supplier is fully integrated with information and communication technology.
One of the most popular approaches is the model of three levels of satisfaction by Kano N. (1980), in which customer satisfaction depends proportionally on a level and type of product quality [3]. Expected quality of goods is characterized by what might en-courage or induce the purchase. Desired product quality implies that in case the product is improved, the satisfaction level will increase. Attracting or exciting quality of the product represents an unex-pected level of service. In such cases, customers are agreeably surprised, delighted and even stunned.
Moreover, the exciting quality soon turns into the expected.
Lamben J.-J. offers an overall assessment proce-dure for measurement of a level of satisfaction or dis-satisfaction [4]. It is based on the concept of multi-attributive model and includes three stages: first, an average value of overall satisfaction with a product or service is calculated; second, an average value of satisfaction and importance for each characteristic is measured; finally, assessment of intention to repeat transaction is carried out. In order to determine the level of satisfaction for the most important charac-teristics, which impact the consumer choice, the ra-tio of satisfacra-tion / importance is assessed.
The Gap model, developed in 1985–1991 by American researchers Parashuraman A., Zei-taml V. A., Berry L. L. offers to measure customer satisfaction with service by analyzing the gap be-tween expectations and actual level of services ren-dered. Gap means excess of consumer expectations in the assessment of services received [5-6]. The Gap model allows understanding the process of rendering services in general, identifying a possible source of poor quality of the given services.
The Likert Scale, proposed by Likert R. in 1932, is a method of multi-factor assessment, in which re-spondents evaluate the criteria using the scale start-ing from one critical position through a neutral one, and to another critical position, such as “completely satisfied”, “to some extent satisfied” etc. Each cri-terion has a rating scale. [7]. The given approach is simple but unreliable because it does not take into account the importance of criteria for customers when evaluating a company’s performance. This makes it difficult to identify the scopes that require urgent improvement to a customer's perspective.
The study conducted by Mittal B. and Las-sar V. M. shows that dissatisfaction guarantees un-loyalty, while only total satisfaction provides loy-alty [8]. Therefore, overall customer satisfaction is a significant factor in creating loyalty, which re-quires regular monitoring of consumer satisfaction dynamics.
ЭКОНОМИКА РЕГИОНА № 4/2010 ЭКОНОМИКА РЕГИОНА № 4/2010
A methodical approach to measure customer satisfaction
The authors’ method is based on theoretical approaches by Lamben J.-J., Parashuraman A., Zeitaml V. A. and Berry L. L. As a research tool of the methodology a five-point Likert scale and the Gap model are used.
The authors suggest an organizational mecha-nism to conduct a research of customer satisfaction with industrial products. It includes several stages.
Stage 1. To set a survey goal, which may consist in identification of critical factors causing drop in product demand; definition of customers’ expecta-tions in order to maintain a leading position on the market; customer segmentation according to certain indicators, and so on.
Step 2. In cooperation with all the company’s departments to elaborate a list of criteria, which are important for a customer as well as for a pro-ducer and evaluation of which allows achieving the research goal. Taking into account specific features of industrial products and customers’ behavior re-garding product selection and buying process, the authors suggested including two types of param-eters in the questionnaire. The first group consists of the product quality parameters: compliance of a product’s technical characteristics with the cus-tomers’ requirements; adequacy of the product life span; packaging quality and reliability (ease of opening, warehousing, storage); warranty period. The second group includes service level parameters: supplier reliability and stability; supplier contract performance; delivery time; convenience of coop-eration with the manufacturer’s Sales department and/or its trade representative (calls frequency, accessibility, efficiency, professionalism); quality, adequacy and convenience of technical documen-tation; quality and speed of warranty service and repair; possibility of obtaining technical and design consulting (availability, frequency of complaints, sufficiency of consulting, efficiency, professional-ism); frequency and quality of information on new product types.
Stage 3. To prepare a database of companies responding.
Stage 4. To work out a questionnaire: to formu-late questions, chose a rating scale.
Stage 5. To send questionnaires to personal re-spondent companies by fax or e-mail. To keep track their routing in the responding companies.
Stage 6. To perform an analysis based on the questionnaire data collected, and to evaluate cus-tomer satisfaction with the product quality and serv-ice level.
In case of industrial customer analysis the au-thors suggest the respondents are divided into two groups: customers of primary and secondary mar-kets. The former group includes manufacturing companies or OEM companies, which purchase industrial products for further use as components in their product manufacture, the latter consists of reselling companies.
The authors’ method of industrial customer sat-isfaction assessment is presented in Table 1.
The authors introduced the formula for assess-ment of satisfaction with a service level and offered to measure overall customer satisfaction, which marks the customers’ opinion about the products and serv-ices (S1). Previously, only product quality parame-ters were studied and calculated. The authors refined upon the methods by reducing the list of questions in the questionnaire; simplifying question wording; in-cluding open-ended questions; setting a rating scale. Moreover, the authors analyzed customer satisfac-tion in the context of product types; tracked satis-faction dynamics in all the surveyed companies and systematized the mechanism for data collection and processing.
The given technique is applied for Pnevmo-stroimashina, JSC. The changes in the assessment procedure introduced by the authors have improved the customer research model previously used at the enterprise. In accordance with the findings of the customer satisfaction research held in 2009, the au-thors provide some recommendation. First, it is rec-ommended that the assessment technique was intro-duced in the companies of JSC Pnevmostroimashina distribution network in order to study end-users of the company’s products. To increase involvement of the company’s departments in achievement of the common goal to strengthen partnership with cus-tomers and gain profits, the authors offer to bring the research results to the management notice and use them in the work of all the departments. In or-der to increase respondents’ motivation to fill in the questionnaires and to get customer feedback, it is recommended that a written notice on the activities developed and approved for execution on the basis of the questionnaires was sent to the customers.
“Pnevmostoimashina” JSC performance in the machine-building industry
ЭКОНОМИКА РЕГИОНА № 4/2010 ЭКОНОМИКА РЕГИОНА № 4/2010
Table 1
Method of industrial customer satisfaction assessment
Indicator Stage: formula Rating scale, maximum indicator value
1. Analysis of the primary market customers (PM) 1.1 Rating of criteria importance when selecting a supplier IPM — importance
indicator for the primary market customers
(1),
P — criterion, n — number of respondents
One-to-ive scale is used, 5 — very important, 1 — of no importance. Maximum indicator value equals to 5 points or 100%
1.2 Rating of product and service criteria satisfaction
— customer satisfaction with the
product quality (PQ) (2),
PPQ1, …, PPQ4 — product quality criteria, n — number of respondents
Scale of one to ive is used, 5 — excellent, 1 — poor.
Maximum indicator value equals to 5 points or 100%
— customer satisfaction with the
service level (SL) (3),
PSL1, …, PSL8 — service level criteria, n — number of respondents
Scale of one to ive is used, 5 — excellent, 1 — poor.
Maximum indicator value equals to 5 points or 100%
S1 — customer satisfaction with the product quality and service level
(4)
Scale of one to ive is used, 5 — excellent, 1 — poor.
Maximum indicator value equals to 5 points or 100%
1.3 Competitive supplier analysis
S2 — indicator relecting customer attitude to the competitive suppliers’ products
(5),
A — a situation, when a customer buy the products from only one supplier, B — a situation, when a customer buy the products from several competing suppliers; n — number of respondents
B criterion equals to 2 points, A criterion equals to 1 point. Maximum indicator value equals to 2 points or 100%
1.4 Defect analysis
S3 — indicator relecting a return quantity of products over a warranty period
(6),
Nв — return quantity over a period; Vв — purchase quantity over a period; n — number of respondents
Each criterion value corresponds to a certain number of points. Maximum indicator value equals to 5 points or 100%
1.5 Calculation of the primary market customers satisfaction SPM — overall
satisfaction indicator of the primary market customers
SPM = S1 + S2 + S3 (7) Maximum indicator value equals to 5 points or 100%
1.6 Gap analysis between customers’ expectations and satisfaction
he gap discrepancy is calculated under every criterion
GPM = IPM – SPM (8)
To show the gaps between customers’ expectations and satisfaction on a graph.
2. Analysis of the secondary market customers (SM)
2.1–2.6 he identical analysis of the secondary market customers is conducted 3. Analysis of the overall customer satisfaction indicator
3.1 Calculation of the overall customer satisfaction indicator for the primary and secondary markets
S — integrated customer satisfaction indicator
(9)
SPM — overall satisfaction indicator of the primary market customers;
SSM — overall satisfaction indicator of the secondary market customers
Maximum indicator value equals to 12 points or 100%
ЭКОНОМИКА РЕГИОНА № 4/2010 In 2007, the company’s share in the domestic
market amounted to almost 80%, in the global mar-ket it has 2.5% in the axial-piston hydraulics seg-ment. One-fifth of the total sales are exported.
The company has widespread distribution and service networks in Russia and CIS countries: 5 trading houses, 9 distributors, 46 dealers; 15 sales representatives in CIS and non-CIS countries and 41 service centers. The products are exported to the Western and Eastern Europe, East Asia and Latin America.
According to the data of the Off-Highway Research consulting firm, amid the global financial crisis of 2008-2009 the Chinese, European, Indian, Japanese and North American markets saw a down-ward trend in demand for road-construction equip-ment that resulted in export reduction to these regions by 15% by JSC Pnevmostroimashina. Dynamics of demand for road-construction equipment in five ma-jor world markets is presented in Fig. 1.
According to data provided by the public or-ganization “Russian Engineering Union”, in 2009 production of tractor, agricultural, forestry, road-construction and municipal machinery decreased by 49.1% as a result of a sharp drop in demand due to financial insolvency of buyers, payment delay, in-creased inventory in stock, difficulties in obtaining loans to ensure continuous output [9]. Import re-duced significantly (Fig. 2).
Fig. 1. Dynamics of demand for road-construction equipment in 2006–2009, %.
Source: 1) The market for construction machinery: the peak is passed. Forecast for 2009: [web]. url: http://www.mashportal.ru/ machinery_russia-14921.aspx (access dated on: 17.05.2010); 2) At the bottom… the market for construction machinery. Results of
2009: [web]. url: http://www.prom-marketing.ru/articles/114-5201-machines.2009.html (access dated on: 17.05.2010).
Fig. 2. Pattern of demand for road-construction equipment by the countries, %
Source: Yellow Table: 50 world's largest manufacturers of construction machinery in 2009.: [web]. url: http://www.xn--80aaf4aa1aocn7h.net/articles/marketing/~id=9390 (access
dated on: 17.05.2010)
ЭКОНОМИКА РЕГИОНА № 4/2010
Influenced by the negative effects of the eco-nomic crisis, the purchasing power of domestic road-construction equipment producers, which are the target customers of JSC Pnevmostroimashina reduced significantly.
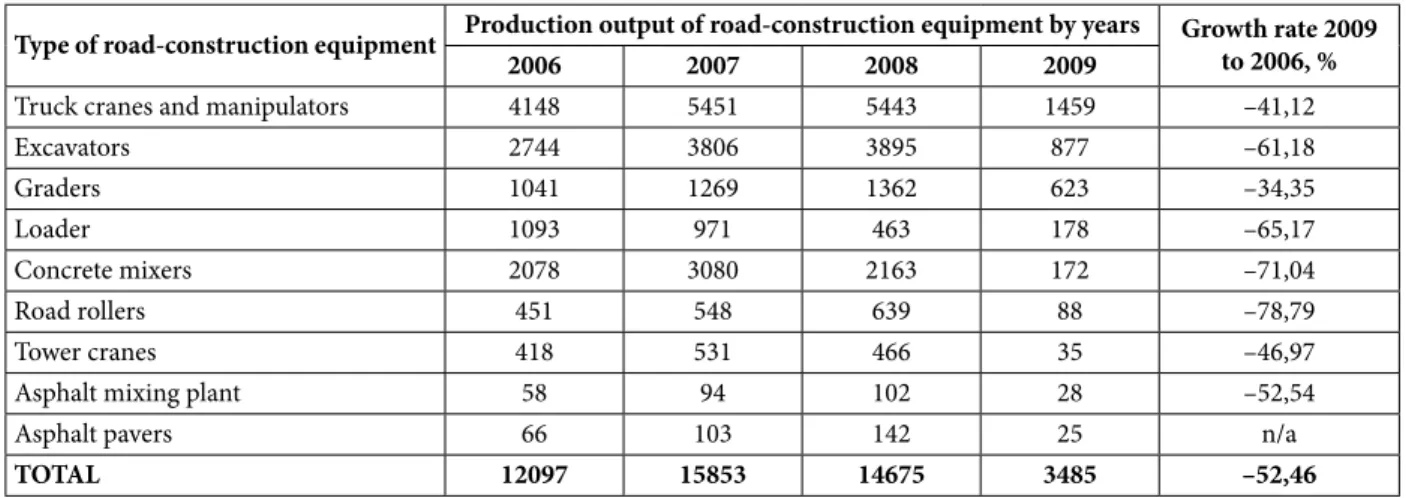
Table 2 shows the dynamics of the road-construc-tion machinery producroad-construc-tion in Russia in 2006–2009. Reduction in the output of the major road-con-struction equipment resulted in a five times drop of JSC Pnevmostroimashina production (Fig. 3).
To overcome the crisis and ensure competi-tiveness of domestic machinery producers on the Russian and global marketplace, it is required to de-velop and implement an integrated approach, com-bining development and introduction of modern technologies, to supply plants with high-technology equipment of the world leading producers, to
con-duct personnel training for establishing so-called “smart plants”. Machine-building ensures produc-tion saturaproduc-tion with new technical means and tech-nologies and it is, ultimately, the main source of innovation development and further growth of the country [10].
The post-crisis industrial Russian market is char-acterized by the intensifying competition with the world leading machine-building companies, which establish their assembly plants in Russia. Under these circumstances domestic industrial enterprises pay more attention to customer research, develop-ment of individual technical solutions to meet the most demanding requirements. Development and implementation of an effective methodology for measurement of customer satisfaction will facilitate the work with customers and help to identify strong
Table 2
Dynamics of road-construction equipment production by product type, ea
Type of road-construction equipment Production output of road-construction equipment by years Growth rate 2009 to 2006, %
2006 2007 2008 2009
Truck cranes and manipulators 4148 5451 5443 1459 –41,12
Excavators 2744 3806 3895 877 –61,18
Graders 1041 1269 1362 623 –34,35
Loader 1093 971 463 178 –65,17
Concrete mixers 2078 3080 2163 172 –71,04
Road rollers 451 548 639 88 –78,79
Tower cranes 418 531 466 35 –46,97
Asphalt mixing plant 58 94 102 28 –52,54
Asphalt pavers 66 103 142 25 n/a
TOTAL 12097 15853 14675 3485 –52,46
Source: compiled by the authors on the basis of data provided by “Stroydorm-UK” Ltd., “Stroydormash” Association
ЭКОНОМИКА РЕГИОНА № 4/2010 Fig. 5. Gap analysis between expectations and satisfaction of the primary market customers, points
ЭКОНОМИКА РЕГИОНА № 4/2010
and weak points of an enterprise, which require im-provement to enhance customer loyalty and increase market share.
Customer satisfaction assessment at Pnevmostroimashina, JSC
Road-construction equipment producers or pri-mary market companies, as well as the distribution network entities or secondary market companies, are the respondents in the customer satisfaction survey held by JSC Pnevmostroimashina”. The cus-tomer satisfaction analysis is conducted twice a year (in July and December) and consists of two parts: the analysis of primary market companies and the analysis of secondary market companies.
The authors have made calculations to assess pri-mary market customer satisfaction with the product quality of JSC Pnevmostroimashina, and the analy-sis of values over the past three years that are pre-sented in Figure 4.
Based on the results of the primary market cus-tomer analysis, the criteria are ranked in order of importance for the respondents and the gap analysis between customers’ expectations and satisfaction is conducted (Fig. 5).
An analysis of the gap between customers’ expec-tations and satisfaction discovered the fact that the high satisfaction criteria have high importance rat-ing for the respondents. At the same time, the crite-ria requiring improvement due to the fact that their importance ratings exceed the satisfaction level, are identified.
Calculation of the average customer satisfaction indicator shows that 70% of primary market custom-ers rate their satisfaction with products and services above average as shown in Figure 6.
The analysis of changes in the satisfaction level with product quality and service level by customers of the primary market for the last 3 years is shown in Figure 7.
In the 1st and 2nd half of 2009 the average cus-tomer satisfaction index on the primary market amounted to 9.41 points (78.38%) and 9.48 points (78.98%), respectively. The overall customer satis-faction index on the primary and secondary mar-kets equals to 10.32 points (85.96%). The dynamics of the integrated consumer satisfaction indicator is shown in Figure 8.
Fig. 7. Dynamics of customer satisfaction on the primary market, points
ЭКОНОМИКА РЕГИОНА № 4/2010 Thus, heightened attention is paid to the needs
and expectations of customers to meet growing cus-tomer expectations. Cuscus-tomer satisfaction becomes one of the most efficient marketing tools, capable of measuring efficiency of a company and predicting the way a company's market share may change de-pending on a current level of customer satisfaction.
When selecting ways to increase company’s competitiveness, customer satisfaction, as well as customer expectations, product quality and service parameters are to be estimated.
Investigation of consumer satisfaction regularly executed by the specialists of the marketing depart-ment, allows upgrading technical characteristics of a product during its production and improving quality of service, thereby enhancing the company’s com-petitive position on the industrial market.
References
1. Tracy, B. (2004). Victory! Translation from English by Е. А. Bakusheva. Mn.: «Poppuri» JSC, 236 p.
2. Carter, R. (1995). he Seven Cs of Efective Supplier Evaluation. Purchasing and Supply Chain Management.
3. Kano, N., Nobuhiku, S., Fumio, T., Shinichi, T. (1984). Attractive quality and must-be quality. Journal of the Japanese Society for Quality Control, 14 (2).
4. Lamben, J.-J. (1996). Strategic Marketing. European per-spective. Translation from French. Saint-Petersburg: Nauka. 589 p.
5. Zeitaml, V. A. A., Berry, L. L., Parasuraman, A. (1988). Communication and Control Processes in the Delivery of Service Quality. Journal of Marketing, Vol. 52.
6. Parasuraman, A., Berry, L. L., Zeitaml, V. A. (1985). Conceptual Model of Service Quality and Its Implication for Future Research. Journal of Marketing, Vol. 49.
7. Predvoditeleva, M. D., Balaeva, О. N. (2005). Approaches to service quality management: focus on the consumer. Management in Russia and abroad, 2. Moscow. 144 p. pp. 90-97.
8. Mittal, B., Lassar, W. M. (1998). Why do customers switch? he dynamics of satisfaction versus loyalty. Journal of Services Marketing, Vol. 12,
9. Monthly informational and analytical bulletin. Public Organization “Russian Engineering Union”, Committee on the tractor, agricultural, forestry, road-construction and municipal machinery. Moscow. January 2010, Vol. 1 (18). 130 p. p.3.
10. Klimov, G. (2008). On the state and machinery in Russia. Intelligent production, 2 (5).
U.D.C. 338.4