Abstract. Miles e Snow’s configurational theory has received a great deal of attention from many investigators.
Framing the Miles e Snow Typology with the organizational configuration concept, the main pur-pose of this paper is to make an empirical evaluation of what configurational theories postulate: higher organizational performance is associated to the resemblance to one of the ideal types defined. However, as it is often assumed that an organization can increase performance by selecting the adjustable hybrid type to its own exogenous environment, the relation between the organiza-tion’s effectiveness and the hybrid configuration alignment to the respective specific environment types was also analyzed.
The assumption of equifinality was also considered because the configurational theory assumes that all the ideal types can potentially achieve the same performance level.
A multiple regression model was made to confirm if the misfit related to the ideal and hybrid types has significant impact on the organizational effectiveness. The analysis of variance and the Kruskal-Wallis test were used to verify the equality of performance between the different organiza-tion types. In short, the empirical results obtained confirm what is postulated in the theory.
Key words: Organizational configuration, fit, equifinality, Miles and Snow typology, performance.
Introduction
Industrial Organization researchers have long been trying to understand and explain organi-zations’ performance, a fertile area of theoretical conception and empirical analysis. This quest to understand the differences of performance has been through an evolution process characterized by the introduction of new concepts and their corresponding methodologies.
A different basis has emerged to construct synthesis models from the various theoretical
Organizational configuration, fit and performance: The
case of the pharmaceutical industry in Portugal
José Castro Pinto
Instituto Superior de Ciências do Trabalho e da Empresa, Lisboa
Endereço: Instituto Superior de Ciências do Trabalho e da Empresa, Av. das Forças Armadas, 1600-026 Lisboa, Portugal.
approaches and their respective empirical applications, which are intended to explain organizatio-nal performance. The present model tried to evaluate the importance that the organizatioorganizatio-nal confi-guration concept has in explaining the organizations’ performance.
The organizational configuration concept
Essentially, the organizational configurations can be perceived as systems, comprising groups of attributes, which reflect organizational states and processes, as well as the associated external characteristics. The consistency between all these factors will determine the level of performance.
The organizational configurations can be defined and identified through a theoretical con-ceptualization, based on a synthesis of literature, or through empirical studies, supported by sam-ples of an appropriate size. Although both approaches are equally robust, the theoretical configura-tions, obviously require, empirical validation.
Ideal and hybrid configurations
The theoretical approach raised some typologies that tried to define and describe a reduced number of gestalts, where the consistency among the different and relevant factors in the organiza-tion and respective environment would reach the maximum level, and consequently, the best per-formance would be achieved.
The organizational literature usually terms these configurational archetypes “Ideal Types”, “Ideal Configurations” or “Pure Forms”.
In the conceptual approach, the ideal types can be seen as theoretical abstractions, which allow an optimized referential of a complex reality to be established. Actually, in a dynamic frame, the perfect adjustment between the relevant components of the organization and its environment, characterized by a continuum and precise alignment, is highly unusual and only admissible in a theoretical context.
All the other forms, besides the restricted group composed by the ideal types, are generally termed “hybrid types”. These kinds of configuration are justified theoretically as organizations’ solutions to face a specific heterogeneous environment. The hybrid types are characterized to exhi-bit a deviation in relation to ideal types and can also present some misfits between the relevant organizational factors such as structure and strategy.
In the empirical approach, the ideal types are defined a posteriori. This means that key indi-cators’ values of the best performing organizations will define the ideal type coordinates.
This procedure, although less ambitious than the conceptual approach, will certainly be more realistic, given that those configurations were effectively observed. However, in ideal terms, the exis-tence of an organization with a higher degree of consistency and alignment is always admissible.
Irrespective of the approach followed to design an ideal type, what really matters is that it should reflect an optimized referential system, which allows the organization’s performance to be explained through the proximity to that configuration.
The fit concept
The fit concept among the organizational theories is far from being a clear idea. The com-mon platform of the fit concept lies on the premise that organizational performance is the fruit of the adjustment between two or more factors. Nevertheless, some researchers frequently use this concept, each with a different perspective.
In our opinion the systemic approach best reflects the organization complexity. According to this approach, organizations are conceived as synergetic entities, framed by distinguishable subsys-tems. When all these subsystems, related with each other, form a coherent and consistent set, they configure an ideal type. Deviations from this pure form, on one or more dimensions, led necessarily to a reduction in performance.
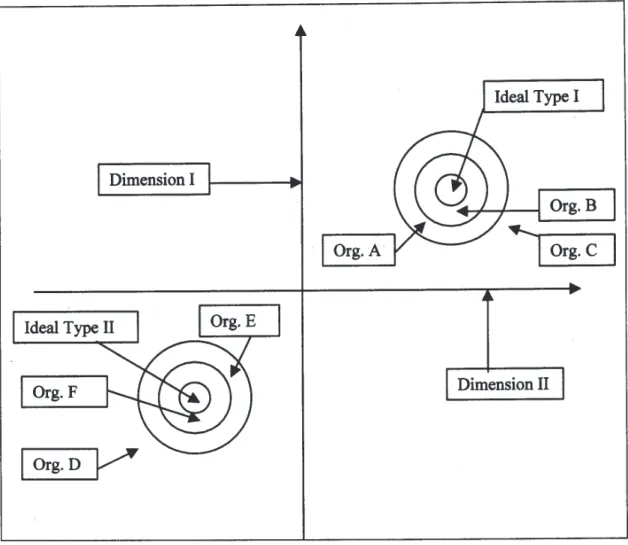
Van de Ven and Drazin (1985) attempted to illustrate the fit systemic approach with Figure 1. To simplify it, these authors considered only two dimensions and two ideal types, recognizing that the principles involved can easily be extended to more dimensions and pure forms. The orga-nizations can be represented in the graph according to the respective valorization for both dimen-sions. The ideal type I is shown in the first quadrant, while the ideal II is shown in the third quad-rant. Each of them is presumed to represent an ideal pattern of scores, and consequently the highest performance level for a given level of context.
Organizations A, B and C are represented around the ideal type I, while organizations D, E, and F are located around ideal type II. In this example, a greater distance from the organization to its ideal type corresponds to a lower performance level. Every organization with the same distance to its ideal type – no matter the direction – would achieve an equal performance level. This explains why the isoperformance lines are concentric circumferences around the coordinates of the ideal type.1 Therefore, the performance ranking related with the ideal type I and II should be
respectively: B, A, C and F, E, D. For more than two dimensions, spheres or hyperspheres would represent the performance outline.
Van de Ven and Drazin developed a three-step procedure to test this approach. First, the coordinates that will define the ideal type would emerge from either the theoretical or empirical approach. Second, the organizations’ patterns should be compared to their respective ideal types through the following Euclidean distance formula:
, where Distij represents the euclidean distance from the jth
organi-zation to its ideal type.
Xisrepresents the score of ideal type i on the sth dimension.
Xjsrepresents the score of the jth organization on the sth dimension.
1Assuming that the two dimensions produce different performance impacts in each organizational type, then the cir-cumferences should be replaced by ellipses.
The third step comprises the validation test. Thus, Dist can now be correlated with the orga-nization performance. The misfit influence can be demonstrated if the distance measure is signifi-cantly and negatively correlated with performance.
One extremely important aspect considered in the systemic approach is the equifinality assumption. According to Katz and Kahn (1976) “a system can reach the same final state – e.g. the same level of organizational effectiveness – from differing initial conditions and by a variety of paths”. Thus, the assumption of a unique optimized organization profile is rejected.
Selection of a maximizing performance referential
Given the broad character of the conceptual approach, it can be applied to various industries and therefore seems more adequate than the empirical approach to build a synthetic and referential model, which is somehow limited by its permeability to specific aspects of a particular industry.
The analysis of the advantages and disadvantages of the most promising proposals led to the formalization of a model built on the typology of Miles and Snow (1978).
In the organizational adaptation domain, the Miles and Snow typology is based on the pro-claimed strategic-choice perspective of Child (1972). In this approach organizations do not simply have to adjust their purpose to meet the environmental characteristics. Instead, it is considered that organizations and environments can interact, and so organizations have enough space to create their own context, structure and strategy. Consequently, the performance level will be the result of the consistency achieved with these factors.
To Miles and Snow, this complex and dynamic process is called the adaptive cycle, which can be broken down into three components: the entrepreneurial problem, the technological pro-blem and the administrative propro-blem. Top management will continuously be confronted with these problems.
Miles and Snow identified four patterns that reflect the organizational profiles adopted to face these three problems. Three of these patterns are considered viable configurations where the performance is optimized given the consistency between the adaptive cycle factors. The fourth is characterized by structural inconsistencies, which promote lower levels of performance.
In short, the main characteristics of the four archetypes are as follows:
Prospector – tries to continuously explore the opportunities of the global market, frequently testing new solutions as alternatives to emergent trends. This pioneer behavior sometimes led to dealing with efficiency problems.
Defender – operates only in a few domains, in general characterized by stability. This beha-vior results in a stressful specialization and a permanent quest to increase the effectiveness of ope-rations.
Analyzer – adopts a dual posture. In turbulent domains pays close attention to the innova-tions developed by the prospectors, trying to imitate those they think have most potential. In the domains characterized by stability, the main goal is to optimize the efficiency through very forma-lized procedures.
Reactor – is characterized by the absence of consistency between the organizational varia-bles, promoting a mediocre performance. The actions undertaken can fundamentally be understood as answers to the market pressures.
This typology emerged as particularly attractive given that it has a reasonable empirical con-firmation. Nevertheless, in many studies, the empirical confirmation was only partial and there we-re sometimes several weaknesses in the formalization.
Zahra and Pearce (1990), in a review of the empirical literature concerning the Miles and Snow typology, noted frequent inconsistencies in the passage of the theory for empirical testing. The inclusion of different numbers of ideal types and the utilization of only one or a few constructs to characterize the configurations described in the theory are two examples mentioned. These weaknesses may be responsible for the wide variation in the reported levels of support.
There are five particularly relevant problems when testing the configurational theories among the weaknesses in the empirical studies. Three of these can be classified at a conceptual level and the other two at an operational level.
Starting at the highest-level, one problem consists of considering organizational configura-tions as categories rather than ideal types. In fact, most researchers have categorized organizaconfigura-tions as belonging to one of the types described in the Miles and Snow typology (Hambrick, 1983; Smith et al., 1989; Snow & Hrebiniak, 1980; Zajac & Shortell, 1989). When that happens, the mar-ginal members of each category are supposed to be as effective as their central members. Contrary to this, when configurations are threatened as pure forms, the organizations that marginally resem-ble the respective types are predicted to be less effective than organizations that closely resemresem-ble them.
The second main failure consists of not considering the relevant contextual factors and their respective consistency with the internal factors. As a matter of fact, it is rare to find studies, which analyze the specific environments in each industry in order to determine the possible alignment between the organizational characteristics and its respective context. The study of Venkatraman and Prescott (1990) is a rare exception.
In addition, the equifinality assumption, equally subjacent to the configurational theory, is not the subject of analysis2. What is frequently observed is the identification of the organizational
type, which get the best performance, taking it as referential model for that industry.
With regards to operational problems, Conant, Mokwa and Varadarajan (1990) noticed that the paragraph approach is frequently used. This method was employed in several empirical studies to classify the organizations according to the typology of Miles and Snow. The following resear-ches are examples of this: Snow and Hrebiniak (1980), McDaniel and Kolari (1987), Segev (1987), Zahra (1987). The paragraph approach requires that respondents read a short paragraph – length descriptions of each ideal type, and then select the one which best characterizes their organization. Typically only a few dimensions considered in Miles and Snow’s adaptive cycle are expressed in the paragraph. In addition, this does not permit the evaluation of the possible gap between the or-ganization and the respective ideal type, even for the dimensions considered, and therefore it is useless to measure the performance evaluation impact resulting from unsuitability of relevant orga-nizational factors.
The selection of a performance indicator is another problem worthy of attention. In fact, it will be relatively uncontroversial to accept that two firms in the same industry, disputing different market segments, and therefore adopting strategies and structures in harmony with the characteris-tics of the respective segments, would probably have specific indicators to measure their own way of acting. Those indicators will tend to reflect their own organizational profile. Thus, as these have different measurements to quantify the organizations’ performance, it will not be possible to
date the equifinality principle. However, we could consider an alternative perspective, in which a set of indicators might be admissible that could be seen as an important indicator to any organiza-tions’ survival, even though it does not reflect the specific organizaorganiza-tions’ profile. We think that the ROI or ROE ratios contain that concern about the profitability of capital.
This study appealed to concept of the correct organizational configuration, which, in our opinion, has not been properly absorbed by the majority of researchers and therefore justifies its use to empirically test the respective usefulness in explaining organizational performance.
Aims of the search
Summarily, the main goals of this research were:
1. To evaluate the existence of a negative relationship between the misfit level to ideal type and organizational performance. In other words, the higher organizational performance, the lower is the deviation to the respective ideal type.
2. To evaluate the existence of a negative relationship between the misfit level in the hybrid type and organizational performance. In other words, the higher the organizational per-formance, the lower the deviation to its environment types.
3. To compare the performance impact resulting from both misfits. 4. To empirically test the equifinality assumption.
Method
The Portuguese Pharmaceutical Industry3 was chosen for this study; this is defined as a
group of entities that produces and/or commercialize pharmaceutical specialties, excluding all other entities related to wholesale and retail distribution. The sample size of this study comprised 53 organizations.
The pharmaceutical market is structured through therapeutic classes standardized according to the Anatomical Classification System (ACS) developed by the European Pharmaceutical Market Research Association (EphMRA), based on the classification of the World Healthcare Organi-zation (WHO). In the ACS, products are divided into different groups according to anatomical site of actions. Each group comprises four different levels. There are main groups (first level), and then second, third and four levels. The 2nd, 3rd and 4th levels are used to identify pharmacological sub-groups.
3Given the difficulty in getting accurate data from the hospital market, all data in this work is based only on the latory market. Although this can obscure some important particularities in this industry, it is assumed that the size of the ambu-latory market (about 85% of industry total sales) can be a reasonable reflection of the respective activity or, at least, the most significant.
The following scheme illustrates the complete classification of a product. C Cardiovascular System
(1st level, anatomical main group)
C10 Hypolipidaemics/Anti-Atheroma Preparations (2nd level, therapeutic main group)
C10A Cholesterol & Triglyceride Reduction Preparations (3rd level, therapeutic/pharmacological group) C10A1 HMG-CoA Reductase Inhibitors
(4th level, chemical/pharmacological/therapeutic subgroup).
In particular, the 3rd level is quite relevant because it reflects a relatively homogeneous group of needs, where only some organizations, by strategic choice, are interested in accompli-shing, through a specific set of products.4
This will foster the genesis of particular characteristics originating what we can call “speci-fic environments”. Thus, it seems reasonable that the domain concept proclaimed by Miles and Snow (1978) in abstract, can be transposed to this concrete situation of therapeutic classes, or spe-cific environments, which constitute the pharmaceutical market.
As it was also necessary to classify the 219 therapeutic classes at the 3rd level into homoge-neous subsets, in order to evaluate the specific environment misfit, some data was collected to sum up the dominant marks with regard the following dimensions: attractiveness, range offered, rivalry, dynamism and relative importance in terms of sales. Seven attributes were therefore selected: rate of growth in units (Cr.Quant.) and value (Cr.Valor), number of different products (NºProd) and number of competitors (NºConc.), number of products with less than one year (Nov.Prod<1ano) and two years (Nov.Prod<2anos), and the proportion of sales (Prop.V.N.).
Figure 2 shows the identification and the characterization of the groups of therapeutic clas-ses, based on the mean values obtained through a cluster analysis.
Study design
To fulfill the research objectives, it would be necessary to select the right dimensions to apply the organizational configuration concept and the Miles and Snow typology appropriately. Therefore, three kinds of dimensions were taken into account: dimensions related to the specific environment, dimensions associated to the adaptive cycle, and the organizations’ performance.
4In general, in the context of competitive analysis, strategic marketing and decision-making, the third level is frequen-tly used by the organizations, except in a few cases where greater refinement is required.
Three indicators were selected to evaluate the organizational fit to the environment types: - The percentage of sales in therapeutic classes classified as stable (%VNEE)
- The percentage of sales in therapeutic classes classified as dynamic (%VNED) - The percentage of sales in therapeutic classes classified as pioneers (%VNEP)
When looking at the dimensions associated to the adaptive cycle, all the three components associated to the typology of Miles and Snow were considered: the entrepreneurial, the technologi-cal and the administrative.
To this effect, two types of information sources were used: primary and secondary data5.
The following indicators were selected from the secondary data: Portfolio products indicators:
- Portfolio products (NPC)
- Number of products launched during the last year (NP<1) - Number of products launched during the last 2 years (NP<2) Figure 2. Classification of therapeutic classes
5In order to minimize occasional effects, which could bias the selected indicators, the objective data (including the %VNEE, %VNED and %VNEP) embraced a three-year period (97-99). Therefore, it was decided to take the mean values for each indicator as the representative value of organizations’ behavior; the variable NCTNP was obviously excluded.
Therapeutic classes indicators:
- Number of segments in which the firm operates (NS)
- Number of new segments where the firm started activity (NNS)
To evaluate the firms’ innovation capability, another indicator was considered in the prod-uct-market context. This indicator was defined as the number of therapeutic classes created in the last 15 years, to integrate the new organization’s products, which could not be inserted in the exist-ing classes (NCTNP).
The primary data basically intended to complete the information given by the previous indi-cators with regard the adaptive cycle dimensions. This data was collected through a questionnaire applied to the organizations’ top management.
The first six questions have the same structure; they are based on a collection of four para-graphs, each reflecting the typical posture of the configurations defined in the Miles and Snow typology6. The proximity or organization fit for each configuration would be obtained through a
different score conferred by the respondent for each paragraph7, in such manner that the sum of the
points would be necessarily equal to 10. Thus, it was possible to identify what configurations better reflected the behavior of each organization and, simultaneously, measure the distance between the nearest ideal type and the correspondent behavior.
The first two questions, framing the entrepreneurial problem of the adaptive cycle, include four dimensions (domain selection, organizational attitude8, growth9and market surveillance).
The third question intends to capture the main technological goal (flexibility and innovation versus cost-efficiencies).
The other four questions comprise the administrative problem. The aim of the fourth ques-tion is to determine which areas of the organizaques-tion are the most influential in the strategy-making process and which the top management pays most attention to. The fifth aims to identify the objec-tives and the planning methods adopted; the sixth identifies the basic design structure selected.
Finally, as pointed out in the Miles and Snow Typology, it was also considered relevant to get a valorization of four attributes, which could characterize the coordination and control mecha-nisms, namely, formalization, standardization, specialization and centralization10. In this case,
how-ever, it was considered that an organization could present different levels of formalization, stan-dardization, specialization and centralization in some distinct areas. Thus, if this was the case, the
6Although, some interpretations were oriented to classifying the analyzer as a hybrid type, Miles and Snow underline the uniqueness of this archetype. This argument led us to consider this configuration as an individualized form and therefore one paragraph was introduced in each question in an attempt to illustrate its respective behavior pattern.
7It was utilized a scale from 0 to 10, where 0 corresponds to the maximum remoteness and 10 to the maximum pro-ximity.
8Concerning the change and innovation propensity.
9Penetrate deeper in their own market segments with traditional products, versus exploiting new products and markets. 10The importance of each parameter was captured through a scale from 0 to 10, where 0 is very low and 10 very high.
CEO was invited to mention the proportions of areas of the organization where those levels were similar for each attribute. For example, in an organization with a few areas characterized by a strong centralization and others characterized by a high level of autonomy, it was possible for the CEO to reflect this situation, using the above-mentioned procedure.
The procedure to evaluate the global misfit in relation to the respective ideal type was obtai-ned in two steps:
First, a cluster analysis was performed comprising both types of data. This procedure allowed the companies to be classified according to their resemblance with the typical characteris-tics of the ideal archetypes described in the Miles and Snow Typology11.
Second, the misfit of each organization to the respective ideal type was measured through the squared Euclidean distance12taking into account the dimensions related to the specific
environ-ment type and the dimensions associated to the adaptive cycle.
To do this, some assumptions were made in order to define the three ideal profiles.
Concerning the specific environments, Miles and Snow (1978, p. 57), typifies the Defen-der’s domain declaring: “The most notable feature of the DefenDefen-der’s product-market domain is its narrowness and stability. Defenders typically direct their products or services only to a limited segment of the total potential market…” So, according to our interpretation, it was supposed that a pure Defender should operate only in specific environments characterized by stability. Therefore, for this kind of organization, it was considered a deviation, the sales proportion in therapeutic clas-ses classified as dynamic or pioneer.
About the Prospector’s typical domain, Miles and Snow (idem, p. 56), asserted: “The dyna-mic nature of Prospector’s domain is perhaps best exemplified in the case of....” adding later “Prospector’s are frequently creators of change in their industries.” Consequently, it was admit-ted that the pure Prospector should operate only in specific environments characterized by being new or dynamic. Therefore, for this kind of organization, it was considered a deviation, the sales proportion in therapeutic classes classified as stable.
The parameterization of the Analyzer’s domain is more difficult due to its dual nature. How-ever, according to Miles and Snow description (idem, p. 72 and p. 68): “The Analyzer’s domain, therefore, is a mixture of products and markets, some of which are stable, others changing”. And “The ideal Analyzer is always poised, ready to move quickly toward a new product or market that
11As Miles and Snow (1978, p. 12) reported, “Three of the four strategic types have their own unique, viable pattern of adaptation. The fourth (Reactor) is a form of organization that occurs when management fails to align strategy, structure and process in a consistent fashion”. Therefore, the ideal type parameterization included only the three viable configurations.
12Given by the expression:
, where Xiv represent the observed value in a firm relatively to
has recently gained a degree of acceptance”. And also “…Analyzer’s combines strengths of both the Prospector and the Defender into a single system. Thus the word that best describes the Analyzer’s adaptive approach is balance”. All these statements led us to place the parameteriza-tion on a perfect balance between therapeutic classes classified as pioneers and dynamic and those classified as stable13.
So, we assumed that would be on that balanced activity in both domains, that the Analyzer acquires its own identity relatively to a hybrid type with Defender or Prospector inclination. According to this interpretation, the proportion of sales above 50% in either of the two types of therapeutic classes, classified as stable or pioneers and dynamic were considered a deviation.
The measurement for the adaptive cycle fit was based on the CEO score distribution for each paragraph regarding the seven questions in the questionnaire.
For the first six questions, it was considered as deviation the difference between the CEO score and the maximum score (10), for the paragraph associated with the firm’s ideal configura-tion14.
With respect to the 7th question (formalization, standardization, specialization and centrali-zation), it was assumed that a pure Prospector would decline the use of any of these mechanisms, and therefore, the ideal parameterization, for this archetype would be 0 in any organizational area. Thus, for an organization with evident similarities with this configuration, it was considered a de-viation, after the correspondent weighing, the difference to 0 relatively to the points attributed to each control mechanism.
On the contrary, it was assumed that a pure Defender, would use all of these mechanisms, hence its ideal parameterization would be 10 in any organizational area. Therefore, for an organi-zation with evident similarities with this configuration, it was considered a deviation, after the cor-respondent weighing, the difference to 10 relatively to the points attributed to each control mecha-nism.
Finally, it was admitted that a pure Analyzer would use totally these mechanisms in organi-zational areas related to therapeutic classes classified as stable as well as promote the contrary within the organizational areas related to therapeutic classes classified as pioneers and dynamic. Thus, for this archetype, the ideal parameterization would be 0 in 50% of organizational areas linked to innovating and dynamic classes and 10, in 50% of organizational areas linked to stable classes (0 50% + 10 50% = 5)15. Therefore, after the corresponding weighing, the difference to 5
for the points attributed to each control mechanism was considered a deviation.
13The innovation attitude is clearly associated to the Prospector’s organizations. However, as the Analyzers are greedy followers of successful innovations started by Prospectors, both class’ types (pioneer and dynamic) were considered, recogniz-ing that the classes classified as pioneers are less important in the Analyzer’s sales.
14This classification was based on the cluster analysis, which allowed the companies’ classification according to their resemblance with the typical characteristics of the ideal types considered.
15Following our previous interpretation regarding the analyzer ideal type, it was assumed that would be proportionate-ness between the percentages of the organizational areas associated to the different types of therapeutic classes (pioneer/dyna-mic and stable) and their correspondent sales.
The adaptive cycle misfit for the respective hybrid type was evaluated using a similar proce-dure. In this case, however, the specific environments’ characteristics were taken as exogenous. Thus, the referential point to evaluate the alignment of each organization was based on the activity distribution according to the different types of therapeutic classes’ considered16.
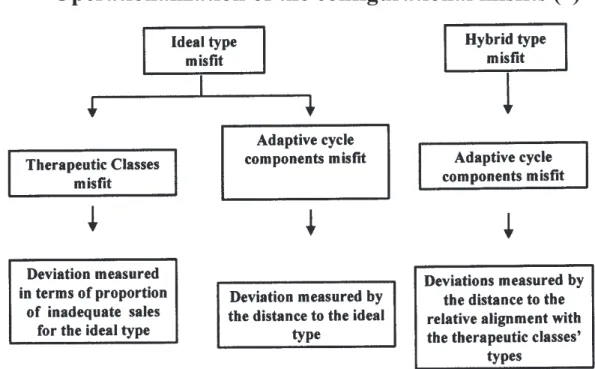
Figure 3 summarizes the approach used to measure the configurational misfit.
The return on equity (ROE) was selected for the performance indicators, because, as a broad indicator, it is appropriate to capture the outcome of the different organizational profiles.
16To better illustrate the parameterization applied, it was considered the presentation of an example: Supposing that a company has 20% of sales associated to therapeutic classes classified as stable (consequently 80% would be linked to therapeu-tic classes classified as pioneers and dynamic). This situation will persuade the company to move eventually from a pure prospector form towards a hybrid solution in order to keep a consistent alignment with his activity’s distribution. Thus, in the questions 1 to 6 the alignment and balance score for this situation would be 8 (scale from 0 to 10) for the paragraphs associated to prospector profile. In the seventh question the perfect alignment situation would be as follows: 80% of the organizational areas should be ruled in the absence of formalization, standardization, specialization and centralization (it was assumed, that in a balanced situation the resources application would be proportional to the expected sales). On the contrary, 20% of the organi-zational areas and associated resources would be characterized by strong control measures. Therefore, the ideal parameteriza-tion to this situaparameteriza-tion would be: 0 80% + 10 20% = 2.
Figure 3. Configurational misfit
Operationalization of the configurational misfits (*)
Results
Preliminary tests
Some preliminary tests were performed in order to evaluate the robustness of the question-naire scales used to classify the organization profiles (Table 1) and to verify the viability of using parametric tests (Table 2).
Table 1 Reliability analysis - S C A L E ( A L P H A ) R e l i a b i l i t y C o e f f i c i e n t s - A n a l y z e r N o f C a s e s = 5 1 , 0 N o f I t e m s = 6 A l p h a = , 9 8 2 5 R e l i a b i l i t y C o e f f i c i e n t s - P r o s p e c t o r N o f C a s e s = 5 1 , 0 N o f I t e m s = 6 A l p h a = , 9 8 8 7 R e l i a b i l i t y C o e f f i c i e n t s - D e f e n d e r s N o f C a s e s = 5 1 , 0 N o f I t e m s = 6 A l p h a = , 9 8 9 7 R e l i a b i l i t y C o e f f i c i e n t s – C o o r d i n a t i o n a n d c o n t r o l m e c h a n i s m s N o f C a s e s = 5 1 , 0 N o f I t e m s = 4 A l p h a = , 9 6 9 0 Table 2
Kolmogorov-Smirnov tests (normal)
ROE DTI DTH
Cronbach’s alfa indicates how much correlation we expect between our scale and all possi-ble scales, containing the same number of items, measuring the same thing. The large values obtained indicate that the scales used are quite reliable.
For a significance level of 0.05 the goodness of fit tests (for normal distribution) point to not rejecting the null hypothesis for the three variables; this means that it would be possible to use parametric tests for these variables in further analysis.
The groups
Based on the questionnaire variables set and objective indicators (obviously excluding the performance indicator) a cluster analysis was applied to 53 companies in the sample. Previously all the variables were standardized in order to overcome distortions caused by the different unit mea-sures.
As we considered the Miles and Snow Typology, we expected to capture the four organiza-tion patterns through the cluster analysis.
Figure 4 shows the dendrogram resulting from the application of complete linkage criteria17.
It is clear that by suspending the aggregation process on value 5 of the dendrogram distance scale, we obtain the four expected groups, called group 1, 2, 3 and 4 comprising, respectively, 12, 19, 20 and 2 companies.
However, in order to evaluate the groups’ homogeneity, a discriminant analysis was per-formed based on the four groups found previously.
The discriminant functions show high discriminatory power, as reported by the canonical correlation exhibit in Table 3. In addition, in Table 4 the perfect consonance between discriminant and cluster analysis stands out.
According to these results, a strong level of homogeneity is admissible inside each group. Based on the questionnaire variables, it was observed that the top management scores relat-ed to the last group strongly points to the reactor profile. Thus, as this profile does not configure any ideal type, these two companies were withdrawn from further analysis.
On the other hand, taking into account all the variables considered, the other three groups present a clear resemblance with the viable types described by Miles and Snow. To illustrate these findings, Table 5 presents the objective means indicators in order to show their similarities with the archetypes defined in the typology.
Brief description of the groups
Group 1 comprises 12 organizations and the majority of its sales is in therapeutic classes
classified as dynamic and pioneers (Ref. 2). However, more than 1/3 of sales is from therapeutic
17This linkage rule states that any candidate for inclusion into an existing group must have a certain level of similarity for all members of that group. Therefore, complete linkage has a tendency to find relatively compact clusters composed of highly similar cases.
Canonical Discriminant Functions
Pct of Cum Canonical After Wilks’
Fnc Eigenvalue Variance Pct Corr Fnc Lambda Chi-square df Sig.
: 0 ,000018 513,348 18 ,0000
1* 84,0143 62,66 62,66 ,9941 : 1 ,001535 304,536 10 ,0000
2* 30,1469 22,48 85,14 ,9838 : 2 ,047798 142,916 4 ,0000
3* 19,9214 14,86 100,00 ,9758 :
* Marks the 3 canonical discriminant functions remaining in the analysis.
Table 3
Discriminant functions and canonical correlation
Table 4
Percentage of correct classifications for the cluster analysis
C l a s s i f i c a t i o n r e s u l t s – N o . o f P r e d i c t e d G r o u p M e m b e r s h i p A c t u a l G r o u p C a s e s 1 2 3 4 G r o u p 1 1 2 1 2 0 0 0 1 0 0 , 0 % , o % , 0 % , 0 % G r o u p 2 1 9 0 1 9 0 0 , 0 % 1 0 0 , 0 % , 0 % , 0 % G r o u p 3 2 0 0 0 2 0 0 , 0 % , 0 % 1 0 0 , 0 % , 0 % G r o u p 4 2 0 0 0 2 , 0 % , 0 % , 0 % 1 0 0 , 0 % P e r c e n t o f “ g r o u p e d ” c a s e s c o r r e c t l y c l a s s i f i e d : 1 0 0 , 0 0 % C l a s s i f i c a t i o n p r o c e s s i n g s u m m a r y 5 3 ( U n w e i g h t e d ) c a s e s w e r e p r o c e s s e d . 0 c a s e s w e r e e x c l u d e d f o r m i s s i n g o r o u t - o f - r a n g e g r o u p c o d e s . 0 c a s e s h a d a t l e a s t o n e m i s s i n g d i s c r i m i n a t i n g v a r i a b l e .
classes classified as stable (Ref. 1). On average, this group presents the biggest portfolio of prod-ucts (Ref. 3), also leading in the number of new prodprod-ucts launched in the market (Ref. 4 and 5). In the last 15 years (85-99), on average this group was responsible for the creation of 2.6 new thera-peutic classes associated to the launch of new products that were not susceptible to framing in the existing therapeutic classes (Ref. 6). On average, this group operates in approximately 31 segments (Ref. 7), and simultaneously is the one that expands its business to other therapeutic classes at fastest pace (Ref. 8).
Considering all these values, the organization members of this group are closest to the char-acteristics described by Miles and Snow for the prospector organization18.
Group 3 comprises 20 organizations and centralizes its activity in therapeutic areas
charac-terized by stability (Ref. 1). Only 1/10 of its sales are related to the therapeutic classes classified as dynamic and pioneers (Ref. 2). This group also presents the smallest portfolio of products (Ref. 3) and the poorest wallet of new products (Ref. 4 and 5). The mean value of the responsibility for new therapeutic classes due to its own launch of new products is also meaningless (Ref. 6). This group develops its activity in just a few segments (Ref. 7) and seems to be more interested in pene-trating deeper in the therapeutic classes where it is already working, than looking for new opportu-nities in other therapeutic areas (Ref. 8).
Given the mean values of the objective indicators, the companies inside this group are more similar to the defender profile.
Group 2 comprises 19 companies and presents a better-balanced activity in therapeutic
classes classified as stable and dynamic/pioneers (Ref. 1 and 2). In addition, the observation of all mean values points to an intermediate position in relation to groups 1 and 3. Therefore, according Table 5
Objective indicator means by group
Ref. Variables Gr. 1 Gr. 2 Gr. 3 (1) %VNEE 37,25% 40.47% 89.60% (2) %VNED + %VNEP 62.75% 59.53% 10.40% (3) NPC 39.84 17.00 15.41 (4) NP<2 2.83 1.30 0.79 (5) NP<1 1.48 0.70 0.36 (6) NCTNP 2.58 0.74 0.20 (7) NS 30.71 14.47 11.30 (8) NNS 1.97 0.86 0.23
18Due to the aggregation, in Table 3 there is no reference to the percentage of sales in therapeutic classes classified as pioneers. However it is important to notice that only the organizations belonging to group 1 have a significant mean value in these classes (approximately 3%).
to the Miles and Snow typology, the members of this group show a closer resemblance to the
ana-lyzer organization.
The negative relationship between the misfit level to ideal and hybrid type and the organizational performance
According to the theory of organizational configurations, the pure form has higher perfor-mance levels, due to the maximum consistency achieved among internal and external factors. However, in a given set of external conditions, an organization can also increase the performance by selecting the adjustable hybrid type to that exogenous environment.
These assumptions were tested based on a data sample of 51 organizations, each associated to one of the three viable types of the Miles and Snow typology.
As adequate indicators to reflect the similarities or dissimilarities19 to the respective
arche-types, it was considered the aggregate misfits associated to: - The correspondent ideal type (DTI)
- The hybrid configuration alignment related to the specific environment types (DTH). Supposing the validity of organizational configurations theory and considering the systemic approach of fit, as well as its extension to the hybrid types, a negative and significant correlation between the performance indicator (ROE) and both misfits’ indicators would be predictable.
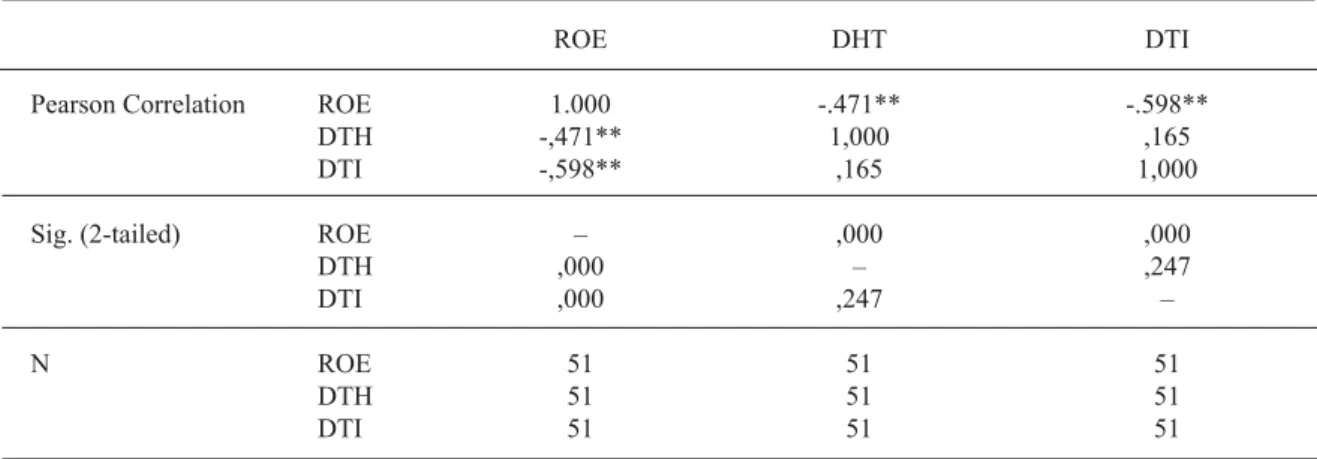
Table 6 shows Pearson’s correlation coefficient and its respective significant levels to these three indicators.
19As above-mentioned both misfits were calculating through the squared Euclidean distance. Table 6
Pearson correlation coefficient
ROE DHT DTI
Pearson Correlation ROE 1.000 -.471** -.598**
DTH -,471** 1,000 ,165
DTI -,598** ,165 1,000
Sig. (2-tailed) ROE – ,000 ,000
DTH ,000 – ,247
DTI ,000 ,247 –
N ROE 51 51 51
DTH 51 51 51
DTI 51 51 51
As we can observe the correlation between the DTI and ROE is relatively moderate but sta-tistically significant. In addition, the negative value indicates that ROE is expected to increase when DTI decreases. This result confirms the advanced expectations. A similar conclusion can be taken for the correlation between ROE and DTH. As can be seen the correlation is also negative and statistically significant.
In spite of the moderate value for both correlation analyzed, we can also notice that the corre-lation between the DTI and DTH is low and not statistically significant. This will be examined later. The performance impact resulting from both misfits
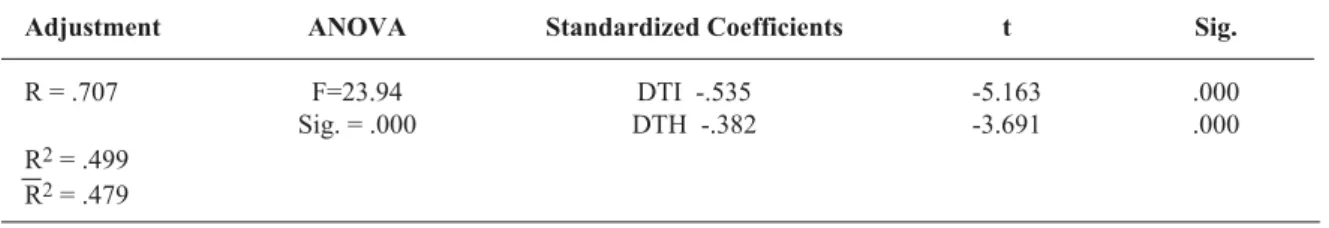
The evaluation of the performance impact resulting from each misfit was also considered. Thus, a multiple regression model was built, with the ROE as a function of DTI and DTH (Table 7). Table 7 shows that both misfits have a negative and significant impact on the organizational performance and together are responsible for approximately 48% of the ROE variation. The obser-vation of the standardized coefficient allows us to conclude that the misfit related to the ideal type has a greater impact in organizational performance. This empirical evidence is in line with what the organizational configuration postulates: the greater the correspondence between a real organi-zation and one of the ideal types, the greater the organiorgani-zation’s effectiveness.
Equifinality
In order to test the equifinality principle, the performance mean of each group was collected to verify if it would reveal statistically significant differences. Although the 51 organizations in the sample were not the pure forms but only approximations to the respective ideal type, the profile presented is sufficiently marked and associated to each of the three viable archetypes. Thus, admit-ting the validity of this principle, a similar performance for the three organizations types would be expected.
The analysis of variance (ANOVA) and the Kruskal-Wallis test were the instruments used to verify the equality of performance between the three groups. The latter was performed in order to prevent any possible violation of ANOVA assumptions.
Tables 8 and 9 present the results of these tests.
Table 7
Relative importance of misfits
Adjustment ANOVA Standardized Coefficients t Sig.
R = .707 F=23.94 DTI -.535 -5.163 .000
Sig. = .000 DTH -.382 -3.691 .000
R2= .499
As can be observed in Table 8, the hypothesis that postulates the equality of means perfor-mance should not be rejected. Moreover, the result of the non-parametric test corroborates the ANOVA indication. Hence, taking into account the data sample, there is statistical evidence to support the equifinality premise.
Discussion and Conclusion
Firstly, the findings clearly confirm the significant effect of the organizational misfit on the organizational outcomes. In fact, both misfits (DTI and DTH) showed a negative and statistically significant relation with the organizational performance. These results confirm the first and second hypothesis above-mentioned in the aims of the search.
However, similar to the results obtained by Doty, Glick and Huber (1993), this study also reveals that the misfit related to the ideal type has a greater performance impact than the misfit related with the hybrid types. Framing our third objective, this finding, can be interpreted as fol-lows: if an organization intends to improve its performance, it should make an effort to be com-pletely aligned with the selected organizational type and, simultaneously, try to participate exclu-sively in specific environments linked with that profile. The option for simple alignment with the characteristics of the specific environments where the organization already operates, will improve the performance, but at a lower level.
Table 8
Analysis of variance (ANOVA)
Sum of Squares df Mean Square F Sig.
ROE Between Groups 174.822 2 87.411 0.222 0.802
Within Groups 18876.342 48 393.257
Total 19051.165 50
Table 9
Kruskal-Wallis Test
Dependent Variable ROE
Chi-Square 1.688
df 2
It is equally important to notice that the weak and insignificant relation between both misfits (Table 6), confirms what would be intuitively plausible to admit. This means that an organization can improve its performance following two independent ways: moving towards the selected ideal type or towards the hybrid configuration correctly aligned with its specific environment types.
Finally, in relation to our forth objective, the hypothesis of equifinality was equally tested. The empirical findings also point to the confirmation of the equifinality assumption. In short, the results indicate that different configurations can potentially aspire to similar performance levels. Final remarks
The major conclusion of this study is that the correct application of the organizational con-figuration concept associated to the systemic fit approach, described by Van de Ven and Drazin (1985), is a relatively powerful predictor of the effectiveness of organizations.
In addition, this study suggests that Miles and Snow’s typology is a more powerful predictor of organizational effectiveness than previously thought. For example, Hambrick (1983) predicted 13% of the variance in cash flow on investment and only 10% of the variance of ROI. In this study, using the aggregate mismatch to the corresponding ideal type (DTI), the performance explained is approximately 36% (0.5982).
Moreover, given the broad context of this study, the analysis of the performance was made considering the ROE as a suitable indicator. Nevertheless it would be plausible to consider the hypothesis that the explanation for the performance could be improved by using a performance indicator particularly associated to each ideal type. Probably this relation would increase the sensi-tivity between the ideal type misfits and the performance. Exploring the predictive capabilities of a model of this kind can be a relevant challenge for further research. For example, according to the Miles and Snow typology, the prospector organization tends to evaluate its own performance based on measures susceptible to comparing the degree of its products’ acceptance with the level achieved by the other competitors. Thus, the market share appears as a particularly appropriate indicator to mea-sure the performance of this organization type.
Finally, just a few words related to the applications of the model. As we have already referred, the organizational configuration concept can be seen as a predictive model relating the internal and external misfits and the performance. Consequently, a regular diagnosis of the relevant misfits to the respective ideal / hybrid type by top management can provide the basis for introduc-ing corrective measures in order to optimize organizational effectiveness.
References
Child, J. (1972). Organization structure, environment and performance: The role of strategic choice. Socio-logy, 6, 168-185.
Conant, J. S., Mokwa, M. P., & Varadarajan, P. R. (1990). Strategic types, distinctive marketing competen-cies and organizational performance: a multiple measures-based study. Strategic Management Jour-nal, 11, 365-383.
Doty, D. H., Glick, W. H., & Huber, G. P. (1993). Fit, equifinality, and organizational effectiveness: A test of two configurational theories. Academy of Management Journal, 36 (6), 1196-1250.
Hambrick, D. C. (1983). Some tests of the effectiveness and functional attributes of Miles and Snow’s strate-gy types. Academy of Management Journal, 26, 2-26.
Katz, D., & Kahn, R. L. (1976). The social psychology of organizations. New York: Wiley.
McDaniel, S. W., & Kolari, J. W. (1987). Marketing strategy implications of Miles and Snow strategic typo-logy. Journal of Marketing, 51 (4), 19-30.
Miles, R. E, & Snow, C. C. (1978). Organization strategy, structure and process. New York: McGraw-Hill. Segev, E. (1987). Strategy, strategy making, and performance in business game. Management Science, 33
(2), 258-269.
Smith, G. S., Guthrie, J. P., & Chen, M. (1989). Strategy size and performance. Organizations Studies, 10, 63-81.
Snow, C. C., & Hrebiniak, L. G. (1980). Strategy, distinctive competence, and organizational performance. Administrative Science Quarterly, 25 (2), 317-336.
Van de Ven, A. H., & Drazin, R. (1985). The concept of fit in contingency theory. In L. L. Cuminggs, & B. M. Staws (Eds.), Research in Organizational Behavior, 7, 333-365.
Venkatraman, N., & Prescott, J. E. (1990). Environment – strategy coalignment: an empirical test of its per-formance. Strategic Management, 11, 1-23.
Zahra, S. A., & Pearce, J. A. II. (1990). Research evidence on the Miles and Snow typology. Journal of Ma-nagement, 16, 751-768.
Zahra, S. A. (1987). Corporate strategic types, environmental perceptions, managerial philosophies, and goals: an empirical study. Aakron Business and Economic Review, 18 (2), 64-77.
Zajac, E., & Shortell, S. M. (1989). Changing generic strategies: likelihood, direction and performance implications. Strategic Management Journal, 10, 413-430.
Resumo. A tipologia organizacional elaborada por Miles e Snow tem vindo a receber grande atenção por parte de muitos investigadores. Enquadrando essa tipologia com o conceito de configu-ração organizacional, o principal objectivo deste trabalho é avaliar empiricamente o postulado nas teorias configuracionais, isto é, o elevado desempenho organizacional está associado com a proxim-idade que as organizações apresentam em relação aos tipos ideais definidos. Contudo, como é fre-quentemente assumido que as organizações podem incrementar o seu desempenho ao selec-cionarem um modelo híbrido ajustado à sua própria envolvente – tomada como exógena, a relação entre o desempenho organizacional e a configuração híbrida resultante do alinhamento com os res-pectivos tipos de envolvente, foi também objecto de análise.
A premissa de equifinalidade foi igualmente testada empiricamente, dado que de acordo com a teo-ria configuracional é suposto que todos os tipos ideais possam potencialmente atingir o mesmo nível de desempenho.
Foi construído um modelo de regressão no sentido de confirmar se os desvios em relação ao tipo ideal e em relação ao tipo híbrido de alinhamento com a respectiva envolvente específica, têm im-pacte estatisticamente significativo na performance organizacional. A análise da variância e o teste
de Kruskal-Wallis foram utilizados para verificar a igualdade do desempenho para os diferentes tipos organizacionais. Em síntese, os resultados empíricos obtidos confirmam o postulado na teoria. Palavras-chave: Configuração organizacional, ajustamento, equifinalidade, tipologia de Miles e Snow, desempenho.