Analysis of Reliability of Peak Treadmill Running in Maximum
Progressive Effort Test: Influence of Training Level
Alberto Souza de Sá FilhoI,II, Wendel AlvesII, Thiago Gottgtroy MirandaII, Eduardo PortugallI, Sérgio MachadoIII,IV,V
DOI: 10.5935/MedicalExpress.2018.mo.001
I Universidade Federal do Rio de Janeiro (UFRJ), Programa de pós-Graduação em Psiquiatria e Saúde Mental, Rio de Janeiro, RJ, Brasil; II Faculdade Unida de Campinas (FacUNICAMPS), Departamento de Educação Física, Goiânia, Goiás, GO, Brasil.
III Universidade Federal do Rio de Janeiro (IPUB/UFRJ), Instituto de Psiquiatria, Laboratório de Pânico e Respiração, Rio de Janeiro, RJ, Brasil; IV Universidade Salgado de Oliveira (UNIVERSO), Programa de Pós-Graduação em Neurociências e atividade Física, Niterói, RJ, Brasil; V Intercontinental Neuroscience Research Group
OBJECTIVE: To determine the reliability (stability) of the peak velocity measurement (VPeak) derived from the incremental maximal effort test, as well as to establish the possible influence of the level of training on these responses.
METHOD: Thirty-eight male volunteers made two visits (3 - 5 days apart) to the training center where the study was conducted and performed maximal progressive running tests. The protocol consisted of increments of 0.5 km.h-1/min, starting at a running speed comfortable for each participant (7-9 km.h-1). All subjects were
encouraged to achieve the maximum possible performance in both tests, with final voluntary exhaustion being the criterion for interruption.
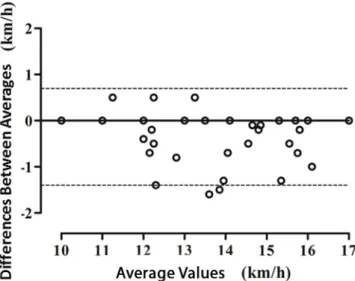
RESULTS: The intraclass correlation coefficient presented excellent consistency of measurements (ICC = 0.975 -p = 0.001). The ty-pical relative error of the measurement was 2.6% for the stability of the measurement of VPeak. Moreover, there were no significant differences between the individual coefficients of variation for measures 1 vs. 2 (p > 0.05). Graphical representation of Bland-Altman demonstrated a homogeneous distribution of the measurement error for all dependent variables.
CONCLUSION: Determination of VPeak exhibited excellent levels of reliability with small measurement errors. There was no influence of the training level on the reliability responses.
KEYWORDS: Reliability, VO2Max, Aerobic Exercise, Aerobic Performance.
Sá-Filho AS, Alves W, Miranda TG, Portugal E, Machado S. Analysis of Reliability of Peak Treadmill Running in Maximum Progressive Effort Test: Influence of Training Level. MedicalExpress (São Paulo, online). 2018;5:mo18001
Received for Publication on November 7, 2017; First review on December 8, 2017; Accepted for publication on January 9, 2018; Online on
January 29, 2018
E-mail: [email protected]
■
INTRODUCTIONThe peak velocity measurement (VPeak), normally obtained through maximum incremental tests is of great
value in scientific, academic, and sporting activities,
because of its practicality and applicability1-3 as well as because of its utility for aerobic training prescription. The measurement of this mechanical load, unlike VO2Max, does not require large equipment or high execution costs, nor does it need trained and specialized personnel.
In addition, VPeak is directly associated with short and long term aerobic performance;2-4 moreover, it is able to predict risks associated with health and mortality,
and more specifically, the relative risk of negative
cardiovascular events.5,6
Given the importance of this index, small variations can directly impact upon the above scenario. Random and biological variations can affect maximum aerobic performance and therefore affect consistency in obtaining
such a variable. The quantification of the measurement
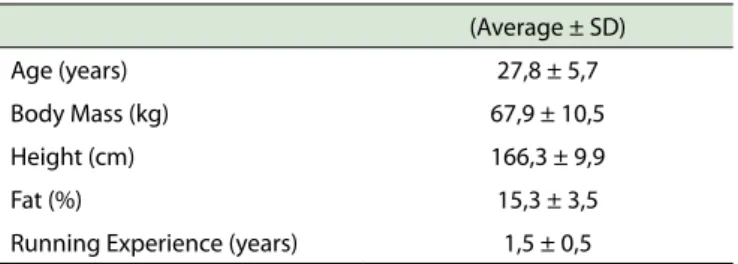
Table 1 describes the sample characteristics.
Design. Each volunteer visited the laboratory twice
at intervals of three to five days. During the first visit,
they signed the consent form, had their anthropometric
measurements recorded and performed the first session
of maximal progressive running test. At the second visit, the same maximum progressive test was repeated. All procedures were performed at the same time of day with controlled temperature (21-23C).
Procedures
Anthropometry. The following measures were obtained: body mass, height (Filizola Scale, São Paulo, Brazil), and skinfolds (Slim Guide, Rosscraft, Surrey, Canada). Body density was estimated as suggested by Jackson & Pollock’s,13 and the fat percentage was calculated by the Siri equation.14
Maximum Progressive Effort Test. Subjects started to run on the treadmill at 7 to 9 km.h-1 and 0% gradient.
From this initial stage, speed was increased by 0.5 km⋅h1 every minute aiming at achieving maximum performance and effort. Oxygen consumption was determined according to metabolic equation for running proposed by American College of Sports Medicine.11 Heart rate (HR) was measured by means of a Polar® model RS
800 device and the subjective effort perception was estimated through the Borg 0-10 scale; both were monitored every minute until the time of exhaustion. The occurrence of maximum voluntary exhaustion, or the presence of signs or symptoms
(mentioned or observed) were used as criteria for finalizing
the test.11
VO2Max results derived from the maximal progressive effort test were used to stratify the participants into two distinct groups in terms of their conditioning levels: high
(group 1) vs. low (group 2). Stratification took into account
the percentile range for the mean age of the subjects, as proposed by ACSM:11 participants in group 1 belonged in the 90-95 percentile value, while group 2 belonged in the 55-60 percentile value.
Statistical analysis
Descriptive parameters are presented as mean ± standard deviation. The intra-class correlation (ICC) was used to determine the degree of association between 1st and 2nd test measurements. Absolute and relative Typical Error especially in the running modality. In addition, the literature
shows little consistency regarding the influence of the
training level and the inter-day reliability responses.9,10 Another question associated with adequate and reliable measurement of VPeak or VO2Max itself, is the methodological variation of available reports. In addition, many authors only report reliability for the Intra-Class
Correlation Coefficient (ICC) or for the Coefficient of
Variation (CV), both measured only in quantitative terms. It is our understanding that in isolation these measures do not bring relevant information to be properly considered for the
quantification of error.9,11,12 In this case, the establishment of the typical error of measure (TEM), both absolute and relative, as proposed by Hopkins,12 could solve this need, and validate the interpretation of interventions, giving greater solidity to the results of studies.
Therefore, given the lack of available data and the importance of establishing the magnitude of the error of this measure, we felt the need to carry out this investigation. Its objective was to determine the stability of the VPeak measurement. The absolute and relative error magnitudes, as well as their distribution pattern, were also established.
In addition, possible influences of the level of training on
the stability of the measure were also investigated. We
hypothesized that intra-class coefficient results would be
highly consistent across measurements, producing minimal absolute and relative errors. However, we believed that the
lower fitness group would exhibit larger variations of these measures thereby influencing the reliability of results.
■
METHODSThe present study used as reference the ethical assumptions described by the International Committee of Medical Journal Editors (ICMJE) and respected all the items proposed in the CONSORT STATEMENT guidelines. The study was previously approved by the Ethics Committee of Universidade Salgado Filho (case #1.220.339).
Sample
Thirty-eight physically active non-smoking male volunteers were invited to participate in the study. They were familiar with treadmill running and had answered announcements made at the training center where the study
was conducted; they responded to the risk stratification
questionnaire for coronary artery disease, as proposed by the American College of Sports Medicine.11 Individuals with mental or physical illnesses, or users of psychoactive or ergogenic substances, or who had pre-existing muscle lesions were excluded. All participants were informed about the procedures, and signed a free and informed consent form. All subjects were instructed not to practice strenuous exercise for at least 24 hours prior to testing. They were also instructed not to feed for at least two hours prior to testing.
Table 1. Sample Characteristics
of Measurements (TEM) were established as suggested by
Hopkins12and the error distribution of the measure was
established through the Bland-Altman strategy.15Finally,
an independent t-test was used to compare the individual
coefficients of variation (CV) between the groups of high
x low levels of aerobic conditioning. The assumptions of normality were previously tested, and analyzes were
performed on GraphPad Prism (v. 5.01, GraphPad Software
Inc., San Diego California, USA). Significance was assumed
at p < 0.05.
■
RESULTSTable 2 shows that the VPeak measured in the two consecutive tests yielded consistently repeatable values. Table 2 also shows that the respective magnitudes of the absolute and relative values for typical errors (TEMs) were minimal. Figure 1 shows the relationships between measurements 1 and 2 of VPeak. The schematic representation of the Bland-Altman test, shown in Figure 2 demonstrates homogeneity of the variance in the distribution of measurement error for the dependent variables.
Table 3 exhibits the analysis of reliability for the
high vs. low levels of conditioning; a significant difference
was found between the performance values of VPeak (p <
0.05), reaffirming differences in the aerobic conditioning
separating groups 1 and 2. In spite of this, the absolute
and relative TEM values yielded similar measurement errors between the groups; likewise, when we compared
the individual coefficients of variation (CV) there were no significant differences between aerobic training levels, suggesting their non-influence in the determination of the
measure reliability.
■
DISCUSSIONThe present study aimed to establish the reliability of the determination of the peak mechanical load
reached at the maximum point of the effort test (VPeak). As
hypothesized, we believed that the reliability level of the
measure expressed by the inter-class coefficient would be high, and this hypothesis was confirmed. Correlational
values above 0.97 were observed for the dependent variable
investigated. However, the main findings and the most useful technical findings of our study are represented by
the reduced magnitude of absolute and relative Typical
Errors of Measurement (2.6%) for VPeak. To the best of our
knowledge, no such TEM analysis has been previously reported. Previous reports only used the Inter-class
Table 2. Reliability Measure in the Maximum Effort Test (n = 38)
Stability VPeak
ICC 0.972
P Value 0.001
TEM (Absolute) 0.4 km.h-1
TEM (Relative) 2.6%
Subtitles: ICC = Intraclass Correlation Coefficient; TEM = Typical Error of Measure.
Figure 1. Relationship between measurements of VPeak in test and re-test.
Figure 2. Bland-Altman's schematic representation of VPeak Measurement Distribu-tion Error.
Table 3. Reliability of maximal effort test: group 1 vs. group 2 (N = 38).
VPeak
Group 1 (n = 20) Group 2 (n = 18) Average 15.0 ± 0.7 km.h-1 * 12.3 ± 0.9 km.h-1 *
TEM (Absolute) 0.4 km.h-1 0.3 km.h-1
TEM (Relative) 2.6% 2.8%
CV (%) 2.3% 1.7%
Independent t-test G1 vs G2 for TEM
p = 0.440
correlation or the coefficient of variability strategy to
establish reliability, and we understand that in isolation neither ICC nor CV can aid in the interpretation of results
from acute and chronic interventions.1,12Therefore, we
understand that our findings are of great value in academic,
sport, and gym situations. The peak mechanical load obtained in the maximum incremental test is extremely relevant for different areas of knowledge. For example, such
a variable is directly associated with aerobic performance,2-4
that is, the individual with a high VPeak will probably perform
with higher quality in short and long term scenarios.3
Additionally, VPeak is also able to predict prognosis in
patients with coronary disease.5,6The peak mechanical load
is still widely used for the prescription of aerobic training in sport centers and gymnasia, because it is easily obtained, and because it dispenses the use of expensive equipment or the presence of specialized professionals.
However, evidence on the reliability of running peak is poor, with most studies concentrating on peak power
using the cycle ergometer.16-18In a study similar to ours,
Harling et al19failed to observe significant differences
between test vs. re-test (p = 0.10) of VPeak (mean of 17.4 ±
1.3 km.h-1) in 11 recreationally trained individuals. No other
types of analysis were presented, making comparisons
of percentage data difficult. Billat et al20 reported on
differences in maximal velocity achieved associated with
VO2Max in two different progressive exercise tests with the
same metabolic demand:in the first model, speed was
increased by 1 km.h-1every 2 min, whereas in the second
model the increments were +0.5 km.h-1per min. The authors
found no significant differences between the protocols in
obtaining VPeak, producing a CV = 4-5% (20.7 ± 1.0 km.h-1
vs. 20.8 ± 0.9 km.h-1) in trained athletes. A classic study
by Froelicher et al1reported the reliability of obtaining
VO2Peak in three different protocols (the Taylor, Bruce and Balke procedures) of maximal running effort. The observed results were consistent across days for the three tested protocols (CV = 4.4%, 4.1%, and 5.8%, respectively); however, they were higher than those obtained in our study, where CV values ranged from 1.7% to 2.3% (low vs. high
fitness groups, respectively).
Using the same stress protocol approach, performed
within a different pattern of exercise modality, Balmer et
al16determined the reliability of peak power production
during a maximum progressive aerobic performance using a cycloergometer test. They reported an excellent level of ICC (0.99) and an fair level of CV (1.32%) in three
tests.16 Similarly, as a secondary objective, Lindsay et al21
established the reliability of the peak power measure for eight professional cyclists using the cycle ergometer. The results showed a CV of 1.7%, similar to that observed by Balmer, Davison e Bird.16These results were close to
the CV observed in running performance in our study,
and suggest that, in spite of the specific peculiarities of cycling, there seems to be consistency in obtaining peak
mechanical load measurements.
Another interesting finding was the analysis of the influence of physical conditioning on the reliability of
VPeak measurement. It was expected that there would be
significant reliability differences between different levels of aerobic fitness, in line with our hypothesis; however, and contrary to what we had predicted, a greater level of homogeneity was observed in the data of individuals with
low physical fitness. We had expected that individuals with high fitness would have produced lower measurement errors, but no significant differences were observed.
Differences have been reported when comparing
non-athletes vs. non-athletes;9 in fact, evidence show lower CV for
VO2Max or peak power reliability in athletes vs. non-athletes
(CV = 1.1% and 1.4% respectively).9We offer no explanation
for this discrepancy. However, we would also note that Kyle
et al10submitted 5 highly trained, 7 moderately trained,
and 5 untrained subjects to three treadmill progressive maximum exercise tests, and observed similar ICC values for all training levels (ICC > 0.92). In our study, we did not use volunteers who practiced any high-performance modality;
our volunteers were only classified as recreationally
trained (45.3 vs. 55.7 mL.kg.-1min-1), with little difference
between fitness levels (despite the statistically significant differences), and perhaps for this reason we did not find
differences in results. In this case, despite the differences in
CV between the high vs. low fitness groups, a t-test found no significant differences (p = 0.440), suggesting no influence
on the measure of reliability. Finally, the distribution of error measurement enhances our understanding about the behavior of the measurement across the range of the dependent variable values. Is it possible that the increase
in the magnitude of the error is due to higher Vpeak values?
In our study, homoscedastic distributions of the error measurement were observed, suggesting homogeneity of the error measurement.
Limitations
Our study has a few limitations. First, the literature reports an overestimation of the ACSM metabolic equations,
which could affect the definition of the level of sample
conditioning 22.If such an effect actually occurred, it would have applied to both conditioning groups, a systematic error which would not affect the result comparisons.Secondly, we believe that even though participants were characterized as high or low conditioning, the small difference between their maximum aerobic power levels may have positively affected resutls, and therefore maintained the consistency of the data, contrary to our initial hypothesis.It is therefore
suggested that the differences between fitness levels should
confortável por cada participante (7 a 9 km.h-1). Todos os participantes foram encorajados a alcançar o máximo de desempenho possível em ambos os testes, tendo como
critério de finalização, a exaustão voluntária máxima. RESULTADO: O coeficiente de correlação intra-classe
(CCI) apresentou excelente consistência da medida (0,975) para VPico (p = 0,001). O erro típico relativo da medida foi de 2,6% para a estabilidade da medida de VPico. Não foram
observadas diferenças significativas entre os coeficientes de
variação individuais para as medidas G1 vs. G2 (p > 0,05).
A representação gráfica de Bland-Altman demonstrou
distribuição homogênea do erro da medida para todas as variáveis dependentes.
CONCLUSÃO: A determinação da VPico exibiu
excelentes níveis de confiabilidade, com pequenos erros de medida. Não houve influência do nível de treinamento sobre as respostas de confiabilidade.
PALAVRAS-CHAVE: Reprodutibilidade, VO2Máx, Exercício Aeróbio, Desempenho Aeróbio
■
REFERENCES1. Froelicher VF, Jr., Brammell H, Davis G, Noguera I, Stewart A, Lancaster MC. A comparison of the reproducibility and physiologic response to three maximal treadmill exercise protocols. Chest 1974;65(5):512-7. DOI:10.1378/chest.65.5.512
2. Noakes TD, Myburgh KH, Schall R. Peak treadmill running velocity during the VO2 max test predicts running performance. J Sports Sci 1990;8(1):35-45. DOI:10.1080/02640419008732129
3. Scott BK, Houmard JA. Peak running velocity is highly related to dis-tance running performance. Int J Sports Med 1994;15(8):504-7. DOI: 10.1055/s-2007-102109
4. Hawley JA, Noakes TD. Peak power output predicts maximal oxygen uptake and performance time in trained cyclists. Eur J Appl Physiol Occup Physiol 1992;65(1):79-83.
5. Myers J, Prakash M, Froelicher V, Do D, Partington S, Atwood JE. Exercise capacity and mortality among men referred for exercise testing. N Engl J Med 2002;346(11):793-801. DOI:10.1056/NEJMoa011858 6. Keteyian SJ, Brawner CA, Savage PD, Ehrman JK, Schairer J, Divine G,
et al. Peak aerobic capacity predicts prognosis in patients with coro-nary heart disease. Am Heart J 2008;156(2):292-300. DOI: 10.1016/j. ahj.2008.03.017
7. Atkinson G, Nevill A. Typical error versus limits of agreement. Sports Med 2000;30(5):375-81. DOI: 10.2165/00007256-200030050-00005 8. Atkinson G, Nevill AM. Statistical methods for assessing measurement error (reliability) in variables relevant to sports medicine. Sports Med 1998;26(4):217-38.
9. Hopkins WG, Schabort EJ, Hawley JA. Reliability of power in physical performance tests. Sports Med 2001;31(3):211-34.
10. Kyle SB, Smoak BL, Douglass LW, Deuster PA. Variability of responses across training levels to maximal treadmill exercise. J Appl Physiol (1985) 1989;67(1):160-5. DOI: 10.1152/jappl.1989.67.1.160 11. ACSM. Guidelines for Exercise Testing and Prescription Lippincott
Williams & WilkinS. 2013; 9º Edition.
12. Hopkins WG. Measures of reliability in sports medicine and science. Sports Med 2000;30(1):1-15.
13. Jackson AS, Pollock ML. Generalized equations for predicting body density of men. Br J Nutr 1978;40(3):497-504.
14. Siri WE. The gross composition of the body. Adv Biol Med Phys 1956;4:239-80.
15. Bland JM, Altman DG. Statistical methods for assessing agree-ment between two methods of clinical measureagree-ment. Lancet
■
CONCLUSIONExcellent levels of stability were observed (ICC > 0.97), with small absolute and relative magnitudes of the measurement error; distribution presented a homogeneous
level of variance. There was no influence of the level
of conditioning on the reliability of measurement. We suggest the use of this modality for other studies, namely the maximization of the differences between levels of conditioning (untrained vs. highly trained) in order to evaluate possible differences.
■
AUTHOR PARTICIPATIONAlberto Souza de Sá Filho constructed this article fully in all steps of the research. Sérgio Machado is the research advisor and participated extensively in numerous revisions and adjustments of the document, granting the
final opinion until the moment of submission. Eduardo
Portugal contributed to issues pertaining to research, and extensively revising the document. Wendel Alves and Thiago Miranda participated mainly in the entire process of data
collection, drawing of figures and tables in which it was part of its process of scientific initiation.
Financing and Conflicts of Interest
The present study was not supported by any sources
of funding. We declare there is no conflict of interest
between the parties involved.
■
ACKNOWLEDGEMENTSAlberto Souza Sá Filho is recipient of a grant by CAPES (131248/2015-0).
ANÁLISE DE CONFIABILIDADE DA VELOCIDADE PICO EM TESTE DE ESFORÇO PROGRESSIVO MÁ-XIMO: INFLUÊNCIA DO NÍVEL DE TREINAMENTO
OBJETIVO: Determinar a confiabilidade (estabilida -de) da medida de velocidade de pico (VPico) derivada do teste incremental de esforço progressivo máximo, bem como
estabelecer a possível influência do nível de treinamento
sobre estas respostas.
MÉTODO: Trinta e oito voluntários fizeram duas
visitas ao centro de treinamento com intervalo de três a cinco dias. Na primeira visita os voluntários assinaram um termo de consentimento, tiveram suas medidas antropométricas registradas e realizaram a primeira sessão de corrida progressiva máxima. Na segunda visita o teste progressivo máximo foi novamente realizado. O protocolo consistiu em incrementos de 0,5 km.h-1 a cada min iniciando
1986;1(8476):307-10. DOI:10.1016/S0140-6736(86)90837-8 16. Balmer J, Davison RC, Bird SR. Peak power predicts performance power
during an outdoor 16.1-km cycling time trial. Med Sci Sports Exerc 2000;32(8):1485-90. DOI:10.1097/00005768-200008000-00018 17. Wehbe GM, Gabbett TJ, Hartwig TB, McLellan CP. Reliability of a Cycle
Ergometer Peak Power Test in Running-based Team Sport Athle-tes: A Technical Report. J Strength Cond Res 2015;29(7):2050-5. DOI:10.1519/JSC.0000000000000814
18. Balmer J, Davison RC, Bird SR. Reliability of an air-braked ergometer to record peak power during a maximal cycling test. Med Sci Sports Exerc 2000;32(10):1790-3.
19. Harling SA, Tong RJ, Mickleborough TD. The oxygen uptake response running to exhaustion at peak treadmill speed. Med Sci Sports Exerc
2003;35(4):663-8. DOI:10.1249/01.MSS.0000058434.53664.EC 20. Billat VL, Hill DW, Pinoteau J, Petit B, Koralsztein JP. Effect of protocol
on determination of velocity at VO2 max and on its time to exhaus-tion. Arch Physiol Biochem 1996;104(3):313-21. DOI:10.1076/ apab.104.3.313.12908
21. Lindsay FH, Hawley JA, Myburgh KH, Schomer HH, Noakes TD, Dennis SC. Improved athletic performance in highly trained cyclists after interval training. Med Sci Sports Exerc 1996;28(11):1427-34. DOI: DOI:10.1097/00005768-199611000-00013