online | memorias.ioc.fiocruz.br
A method for estimating the deforestation timeline
in rural settlements in a scenario of malaria transmission
in frontier expansion in the Amazon Region
Roberto Cardoso Ilacqua1, Leonardo Suveges Moreira Chaves2, Eduardo Sterlino Bergo3,
Jan E Conn4,5, Maria Anice Mubeb Sallum2, Gabriel Zorello Laporta1,6/+
1Faculdade de Medicina do ABC, Setor de Pós-Graduação, Pesquisa e Inovação, Santo André, SP, Brasil 2Universidade de São Paulo, Faculdade de Saúde Pública, Departamento de Epidemiologia, São Paulo, SP, Brasil 3Secretaria de Estado da Saúde de São Paulo, Superintendência de Controle de Endemias, Araraquara, SP, Brasil 4The Wadsworth Center, New York State Department of Health, Slingerlands, NY, USA
5University at Albany, State University of New York, Department of Biomedical Sciences, School of Public Health, Albany, NY, USA 6Universidade Federal do ABC, Centro de Engenharia, Modelagem e Ciências Sociais Aplicadas, Santo André, SP, Brasil
The Malaria Frontier Hypothesis (MFH) is the current model for predicting malaria emergence in the Brazilian Ama-zon. It has two important dimensions, ‘settlement time’ and ‘malaria incidence’, and its prediction are: malaria incidence peaks five years after the initiation of human settlement and declines towards zero after an estimated 10 years. Although MFH is currently accepted, it has been challenged recently. Herein, we described a novel method for estimating settlement timeline by using remote sensing technology integrated in an open-software geographic information system. Surprisingly, we found that of the majority of the rural settlements with high malaria incidence are more than 10 years old.
Key words: geographic information system - remote sensing technologies - malaria
doi: 10.1590/0074-02760170522 Financial support: CNPq, FAPESP.
RCI was supported by CNPq (process n. 143217/2016-0); GZL is supported by FAPESP and Biota-FAPESP Program (process n. 2014/09774-1). This work was partially funded by the National Institutes of Health (NIH) 1 R01 AI110112-01A1 (to JEC and MAMS).
+ Corresponding author: [email protected] Received 30 November 2017
Accepted 29 May 2018
Malaria was in the elimination phase in some en-demic areas of the Amazon River Basin until 2017, when it re-emerged as a significant threat.(1) This disease is
a continuous threat to public health, especially in mu-nicipalities where the control program has been either reduced or discontinued for any length of time. This re-emergence scenario is more challenging because the potential for malaria transmission usually remains high due to environmental, social and economic determinants in the Amazon that favour the occurrence of the mos-quito vectors and Plasmodium transmission. Approxi-mately 128 thousand new malaria cases were reported in the Amazonian Region in 2016. The malaria incidence increased by 51% in 2017, up to 190 thousand new ma-laria cases. Of these, at least 127 thousand occurred in rural settlements or regions.(1)
The model for assessing the emergence of malaria in rural settlements is known as the Malaria Frontier Hy-pothesis (MFH).(2) This model represents the temporal
relationship between the colonization of a given area of Amazon forest and the emergence of the dynamics of malaria transmission.(3) The MFH predicts that in rural
settlements malaria incidence will peak at the beginning
of the colonization process; then stabilize before reach-ing a low incidence rate usually ten years after the onset of colonization.(4) The underlying mechanisms proposed
for this pattern are chiefly related to improvements in both family income and community infrastructure over time that, in older settlements, could diminish or elimi-nate human-vector contact and improve access to ma-laria commodities, including health facilities, diagnostic tests and antimalarial drugs.(4) Moreover, further studies
have shown that host-parasite interactions can be modi-fied depending on the time of colonization.(5,6) The
lat-ter authors found that pioneer settlers have no immunity against malarial parasites, whereas older settlers can have partial immunity because of previous plasmodial infections. In other words, time of colonization can be either a risk or protection factor for malaria in rural set-tlements in the frontier expansion of the Amazon.
In contrast to the MFH, studies by Barros et al.(7)
and Barros and Honório(8) found that old settlements are
equally or more likely to have high malaria incidence (e.g., high parasite index) compared with a region that was recently inhabited. In this scenario, MFH can be a poor predictor of the dynamics of malaria transmission in the Amazon. Considering that the major goal of the United Nations Sustainable Development Agenda(9) is
the elimination of Plasmodium falciparum malaria in 2030, it is imperative to know whether current available models can accurately predict the emergence of malaria.
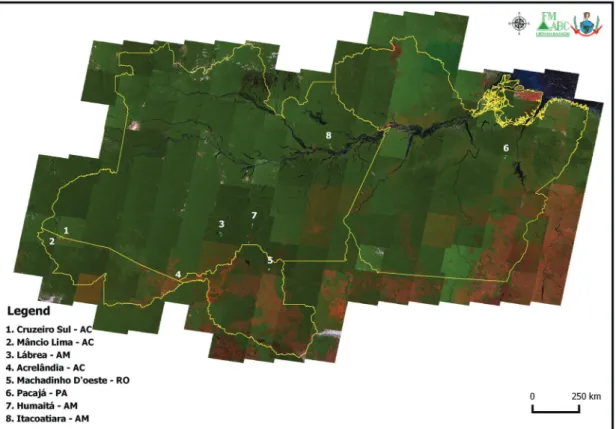
Fig. 1: study area. Sampled localities and landscapes in 2015-16, Amazon. The background is a RGB mosaic made from remote sensing images in 2011. Source: USGS, Landsat Project. Software: QGIS v. 2.16.2.
approximately 5-km2. Five-km2 is the approximate size
of settler property within a forested matrix with potential larval habitats for malarial vectors and, ultimately, repre-sents the spatial scale of the phenomenon of interest, i.e., the scenario of malaria transmission (e.g., landscape ecol-ogy textbook by Turner et al.(10)). Furthermore, deforested
patches of this size have been shown recently to be signif-icant drivers of malaria incidence across the Amazon(11).
We expected that all rural Amazonian settlements having high malaria incidence between 2015 and 2016 would be recently invaded (i.e., colonized) landscapes. However, we found the opposite: high incidences of malaria usually occurred in landscapes in which colonization and thus changes in natural landscapes had begun in the 1970s.
The localities were selected because of high annual parasite index (API ≥ 50) in 2015 or 2016 (Fig. 1). We selected 5-km2 landscapes, sorting them by forest cover
category as follows: open areas (0-30%), moderately de-graded (30-50%) and preserved (50-100%), having one replicate per category, totalling six landscapes per local-ity. A spatiotemporal regression model for the analysis of each landscape was conducted to estimate time of colonization. We assumed that 10% depletion of forest cover of a given landscape was indicative of the begin-ning of a human colonization process. Thus, we applied the 90% forest cover threshold for determining the start of colonization (t0 - starting time).
For the spatiotemporal regression model, we em-ployed the geographic information system QGis v. 2.16.2 Nodebo (www.qgis.org) and the Landsat satellite imag-ery database (www.landsatlook.usgs.gov). Through the LandsatLook digital interface we accessed all the avail-able databases of the Landsat satellites (Landsat 1-8). We
acquired and used in this study imagery from Multispec-tral Scanner (MSS) 1972-1981, Thematic Mapper (TM) 1982-2011 and Operational Land Imager (OLI) 2013-2017 sensors. We used a combination of three bands (in-frared, red, green), which showed a false colour effect in the landscape (Fig. 2). Next, the image was classified with the help of the Semi-Automatic Classification (SCP) plugin in the QGis (www.qgis.org). With this plugin we were able to perform a supervised classification with the satellite images as follows: preserved forest, dark green; exposed soil, yellow; urban soil, pink; rivers and lakes, blue; and unclassified sites, black (Fig. 2).
For estimating the forest cover (%) in each landscape, we quantified the number of pixels classified as ‘forest’ divided by the total, times 100. This quantification was performed through two other plugins (Zonal Statistics and Group Stats), also available in the QGis. More infor-mation about the protocol of remote sensing methods for land use-land cover classification herein applied can be found in the Supplementary data - Protocol.
We repeated the same method of supervised classifi-cation per landscape in each locality in different years, going back from 2015 or 2016 (tn - current time) to the year that each landscape forest cover reached the limiting threshold (> 90%) that represented the beginning of colo-nization. We then divided the landscapes into two catego-ries: new settlement (≤ 10 years), and old settlement (> 10 years). This categorization was based on the prediction of the MFH, which states that new settlements are more like-ly to have high malaria incidence than old ones. Because all these landscapes were chosen in localities with a high annual parasite index for malaria (API ≥ 50), we expected to find more landscapes in the ‘new settlement’ category.
The results of the temporal regression per locality are depicted as follows: Cruzeiro do Sul-AC (Fig. 3), Mâncio Lima-AC (Fig. 4), Lábrea-AM (Fig. 5), Acrelândia-AC (Fig. 6), Machadinho d’Oeste-AM (Fig. 7), Pacajá-PA (Fig. 8), Humaitá-AM (Fig. 9), and Itacoatiara-AM (Fig. 10).
Out of 48 landscapes studied, eight (16.67%) were categorized as ‘new settlements’ with time of coloniza-tion ≤ 10 years, while the remaining 40 (86.33%) cor-responded to ‘old settlements’ (time of colonization > 10 years). A test of independence for a potential asso-ciation between settlement age and parasite index was performed for the 48 malaria landscapes. The outcome of this test was statistically insignificant, and does not support the prediction that malaria incidence peaks more generally in recently invaded rural settlements of the Brazilian Amazon (Table). Therefore, we propose an alternative model based on the forest fringe model (Bar-ros et al.(7); Barros and Honório(8)). The main
assump-tion of the alternative model is that landscape variables (e.g., fragmentation thresholds) govern the dynamics of malaria transmission in the Amazon. According to the forest fringe model, malaria emergence is most likely to happen when the landscape is fragmented, because this scenario provides larval habitats in forest patches near anthropogenic areas where vector-host contact oc-curs. Through logical deduction, malaria prevention
would be possible based on landscape thresholds, as follows: either the forest environment is preserved (> 90% forest cover) or it is efficiently transformed into an urban/rural area (< 10% forest cover) with essential in-frastructure. But, at one extreme, Brazil’s Forest Code is not respected(12) and at the other, the anthropogenic
matrix is not adequately improved(13), leaving most
hu-man settlements comprised of fragmented landscapes (70-30% forest cover) where malaria emergence will be a perennial challenge for public health. Landscape thresholds for malaria emergence can be of practical value in malaria control and elimination scenarios.
Nevertheless, this study has some limitations. One is related to the spatial resolution (~ 60-m) of multispectral scanner satellite imagery obtained in 1972-1981. The use of those images with a resolution that is lower than that of recent images might have caused inaccurate estimations of forest cover. Although we were not able to identify the scale of this inaccuracy, we believe that it could range between 5-20%. Qualitatively speaking, the conclusions would be similar, because we had access to higher-resolution themat-ic mapper images (30-m), from 1982 on. The second limi-tation concerns human mobility.(14) Migratory waves
aug-ment both susceptible and infectious hosts, thus increasing malarial transmission.(15) However, considerations of such
data were beyond the scope of the present study.
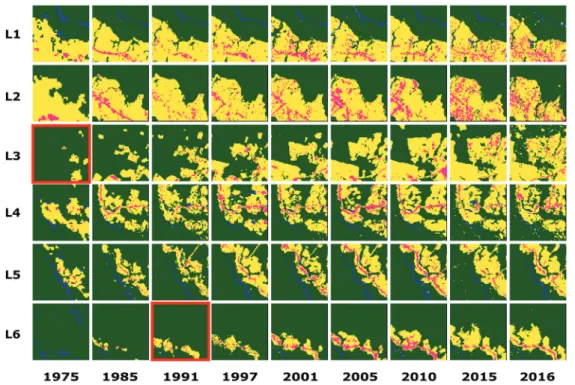
Fig. 5: Lábrea-AM. Temporal evolution of loss of forest cover. Each landscape (L1-L6) is 5-km2. Parasite index for malaria in July/15: L1, 447.9; L2, 447.9; L3, 173.5; L4, 173.5; L5, 447.9; L6, 447.9. Source: Ministry of Health. Software: Inkscape v. 0.48.2. Red borders for pairs of location and time represent when and where the threshold of forest coverage < 90% was reached.
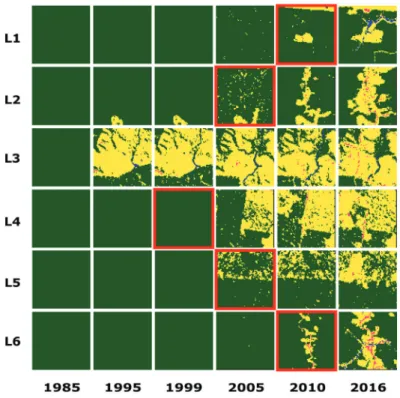
Fig. 7: Machadinho d’Oeste-RO. Temporal evolution of loss of forest cover. Each landscape (L1-L6) is 5-km2. Parasite index for malaria in October/15: L1, 185.2; L2, 150; L3, 150; L4, 150; L5, 230.8; L6, 185.2. Source: Ministry of Health. Software: Inkscape v. 0.48.2. Red borders for pairs of location and time represent when and where the threshold of forest coverage < 90% was reached.
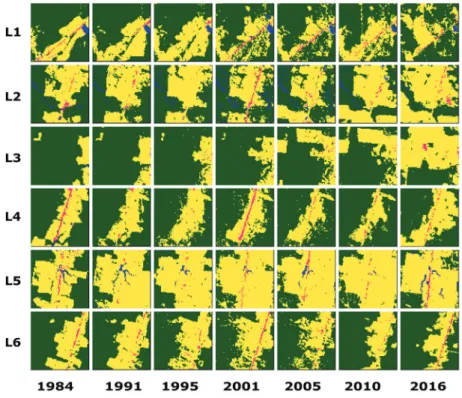
Fig. 10: Itacoatiara-AM. Temporal evolution of loss of forest cover. Each landscape (L1-L6) is 5-km2. Parasite index for malaria in November/16: L1-L6, > 50. Source: Ministry of Health. Software: Inkscape v. 0.48.2. Red borders for pairs of location and time represent when and where the threshold of forest coverage < 90% was reached.
TABLE
Contingency matrix 2 by 2 with Parasite Index for Malaria vs. Settlement Time in landscape (n = 48)
Settlement time
Parasite index for malaria
≥ 50 cases per 1,000 < 50 cases per 1,000
New (≤ 10 years) 8 0
Old (> 10 years) 29 11
Fisher’s exact test for count data: alternative hypothesis, new settlements are associated with higher malaria incidence (malaria frontier hypothesis). Decision: accept the null hypothesis (there is no association); p-value = 0.1704.
ACKNOWLEDGEMENTS
To Rodrigo Daminello Raimundo for helping with the de-velopment of the scientific method herein shown.
AUTHORS’ CONTRIBUTION
MAMS, JEC and GZL - Original idea; ESB, MAMS, LSMC and GZL - landscapes selection; RCI and GZL - study design; RCI - data analysis and figures production; GZL - data analysis supervision and results interpretation; RCI, GZL, MAMS and JEC - scientific writing. All authors approved the final version.
REFERENCES
1. MS - Ministério da Saúde [database on the Internet]. Malária. Situa-ção epidemiológica - Dados. 2018. Available from: http://portalms. saude.gov.br/saude-de-a-z/malaria/situacao-epidemiologica-dados.
2. Sawyer DR. Malaria on the Amazon frontier: economic and social aspects of transmission and control. Southeast Asian J Trop Med Public Health. 1986; 17(3): 342-5.
3. Singer BH, de Castro MC. Agricultural colonization and malaria on the Amazon frontier. Ann NY Acad Sci. 2001; 954(1): 184-222.
4. Castro MC, Monte-Mór RL, Sawyer DO, Singer BH. Malaria risk on the Amazon frontier. Proc Natl Acad Sci USA. 2006; 103(7): 2452-7.
5. Silva NS, Silva-Nunes M, Malafronte RS, Menezes MJ, D’Arcadia RR, Komatsu NT, et al. Epidemiology and control of frontier ma-laria in Brazil: lessons from community-based studies in rural Amazonia. Trans R Soc Trop Med Hyg. 2010; 104(5): 343-50.
6. Silva-Nunes M, Codeço CT, Malafronte RS, Silva NS, Juncansen C, Muniz PT, et al. Malaria on the Amazonian frontier: transmis-sion dynamics, risk factors, spatial distribution, and prospects for control. Am J Trop Med Hyg. 2008; 79(4): 624-35.
7. Barros FS, Honório NA. Deforestation and malaria on the Amazon frontier: larval clustering of Anopheles darlingi (Diptera: Culi-cidae) determines focal distribution of malaria. Am J Trop Med Hyg. 2015; 93(5): 939-53.
8. Barros FS, Arruda ME, Gurgel HC, Honório NA. Spatial clustering and longitudinal variation of Anopheles darlingi (Diptera: Cu-licidae) larvae in a river of the Amazon: the importance of the forest fringe and of obstructions to flow in frontier malaria. Bull Entomol Res. 2011; 101(6): 643-58.
9. UN - United Nations [homepage on the Internet]. New York: the 2030 agenda for sustainable development. 2015. Available from: https:// sustainabledevelopment.un.org/post2015/transformingourworld.
10. Turner MG, Gardner RH, O’Neil RV. Landscape ecology in theo-ry and practice: pattern and process. New York: Springer-Verlag; 2001. 401 pp.
11. Chaves LSM, Conn JE, López RVM, Sallum MAM. Abundance of impacted forest patches less than 5 km2 is a key driver of the inci-dence of malaria in Amazonian Brazil. Sci Rep. 2018; 8(1): 7077.
12. Azevedo AA, Rajão R, Costa MA, Stabile MCC, Macedo MN, dos Reis TNP, et al. Limits of Brazil’s Forest Code as a means to end il-legal deforestation. Proc Natl Acad Sci USA. 2017; 114(29): 7653-8.
13. Ribeiro MR, de Abreu LC, Laporta GZ. Drinking water and rural schools in the Western Amazon: an environmental intervention study. PeerJ Preprints. 2018; 6: e26475v1.
14. Lana RM, Gomes MFDC, Lima TFM, Honório NA, Codeço CT. The introduction of dengue follows transportation infrastructure changes in the state of Acre, Brazil: a network-based analysis. PLoS Negl Trop Dis. 2017; 11(11): e0006070.