Printed version ISSN 0001-3765 / Online version ISSN 1678-2690 http://dx.doi.org/10.1590/0001-3765201820180099
www.scielo.br/aabc | www.fb.com/aabcjournal
Agronomic performance and genetic divergence between genotypes of
Manihot esculenta
JOÃO ANTONIO D. GILES1
, GLEISON OLIOSI1
, WEVERTON P. RODRIGUES2 , HEDER BRAUN3
, ANA I. RIBEIRO-BARROS4,5
and FÁBIO L. PARTELLI1
1
Departmento de Ciências Agrárias e Biológicas, Centro Universitário Norte do Espírito Santo, Universidade Federal do Espírito Santo/UFES, Rod. BR 101, Km 60, Litorâneo, 29932-540 São Mateus, ES, Brazil
2
Centro de Ciências e Tecnologias Agropecuárias, Universidade Estadual Norte Fluminense-Darcy Ribeiro, Av. Alberto Lamego, 2000, 28013-602 Campos dos Goytacazes, RJ, Brazil 3
Departamento de Fitotecnia e Fitossanidade, Universidade Estadual do Maranhão, Cidade Universitária Paulo VI, Caixa Postal 09, 65055-098 São Luíz, MA, Brazil 4
Grupo Interações Planta-Ambiente & Biodiversidade/PlantStress&Biodiversity, Centro de Investigação em Agronomia, Alimentos, Ambiente e Paisagem/LEAF, Departamento de Recursos Naturais, Ambiente e Território/DRAT, Instituto Superior de Agronomia/ISA, Universidade de Lisboa/ULisboa, Qta. Marquês, Av. República, 2784-505 Oeiras, Portugal
5
GeoBioTec, Fac. Ciências Tecnologia/FCT, Universidade Nova de Lisboa/UNL, 2829-516 Caparica, Portugal
Manuscript received on February 2, 2018; accepted for publication on May 21, 2018
ABSTRACT
The morphoagronomic characterization of 12 genotypes of M. esculenta was performed during the 2013/2014 and 2014/2015 crop years. The 12 genotypes were planted in a randomized block design, with four replicates per genotype. Number of tuberous roots per plant, weight of tuberous roots, root yield, total
plant weight, harvest index, plant height, height of first branch, number of shoots, stem diameter, number
of buds, leaf dry weight and petiole length were evaluated. Genotypes “Camuquem” and “Goiás” were the most productive, and “Amarela” and “Gema de Ovo” were the most divergent. Seventy percent of genetic diversity was due to petiole length (22.86%), root yield (19.20%), weight of tuberous roots (14.89%) and number of buds (13.72%). Overall, the present results indicate a broad genetic basis for the evaluated
genotypes, so that such genetic variation benefits the plant breeding for future scenarios Further studies
of the evaluated genotypes should be performed under environmental limitations, using biochemical and molecular tools to identify markers for genetic improvement.
Key words: Cassava, plant breeding, dissimilarity, multivariate analysis.
Correspondence to: Fábio Luiz Partelli E-mail: [email protected]
INTRODUCTION
The genus Manihot belongs to the family Euphorbiaceae and includes 98 species. It is native to the American continent, being distributed from the USA to Argentina (Rogers and Appan 1973). Brazil is considered its main diversity center,
possessing at least 78 species, approximately 80%
of the total number of species (Nassar 2000, Reflora
2017). M. esculenta ssp. is its only domesticated species (Brown et al. 2013).
it is grown as subsistence crop (Pootakham et al. 2014, Silva et al. 2014a, Vidal et al. 2015, Schmitz et al. 2016, Boas et al. 2017, Morais et al. 2017). Cassava is also an important raw material for starch extraction, which has several applications in the food, chemical, cosmetic and pharmaceutical industries. In 2014, 268.28 million tons of cassava were produced globally, grown on 23.87 million hectares, with an average yield of 11.24 t ha-1 (FAO 2017). In Brazil, 1.5 million hectares were occupied by cassava plantations, and 23.1 million tons of cassava root were harvested in 2015, with an average yield of 15.2 t ha-1, 35% higher than the global productivity (IBGE 2016).
Cassava is a diploid (2n=36 chromosomes) and monoicous species, with predominantly allogamous fertilization, making it highly heterozygotic (Pootakhan et al. 2014) and giving it high genetic diversity, even though it propagates vegetatively (Costa et al. 2013, Silva et al. 2014a).
It can therefore adapt to different edaphoclimatic
conditions, such as drought and low-fertility soils (Vidal et al. 2015, Schmitz et al. 2016). Because of these characteristics, cassava cultivation is attractive to farmers with limited resources. Small-farm cultivation is of great importance to the conservation of genetic resources used in improvement programmes (Silva et al. 2014a, Delaquis et al. 2018).
Knowing and characterizing the genetic variability of a given population, manifested through morphological and agronomic traits, is fundamental to guide its conservation and management and to help improvement programmes by identifying superior genotypes that are better adapted to new production systems (Dias et al. 2015, Zerbielli et al. 2016). Multivariate statistics allows for the simultaneous integration of data for multiple traits and has been widely used to quantify genetic divergence in several crops, such as cassava (Mehouenou et al. 2016, Moura et al. 2016, Ortiz
et al. 2016, Agre et al. 2017), coffee (Dalcomo et
al. 2015, Rodrigues et al. 2016, Machado et al. 2017), jabuticaba (Zerbielli et al. 2016), banana (Koukouma et al. 2016), sorghum (Almeida Filho et al. 2016), soybean (Ferreira Júnior et al. 2015) and many others. The aim of the present study was to evaluate the genetic divergence of 12 genotypes of M. esculenta based on their morphoagronomic characterization.
MATERIALS AND METHODS
PLANT MATERIAL AND EXPERIMENTAL DESIGN The experiment was conducted during the 2013/2014 and 2014/2015 crop years, in the municipality of Vila Valério, state of Espírito Santo (ES), Brazil (latitude 18° 57’ 01’’ S, longitude 40° 18’ 35” W; 140 m altitude; 23 °C mean annual temperature). The region’s climate is Aw according
to the Köppen climate classification, tropical with
hot and humid summers and dry winters (Alvares et al. 2013), and a mean annual rainfall of 1200 mm (ANA 2015).
Twelve genotypes of M. esculenta were evaluated (Table I). The genotypes were obtained from the germplasm bank of Embrapa Cassava and Fruticulture (Embrapa Mandioca e Fruticultura) and regional farmers. The 12 genotypes were planted in a randomized block design, with four replicates per genotype. The experimental units consisted of four rows with seven plants. The two lateral rows and the two plants in each end of the central rows were used as the border.
ground to the first branch; number of shoots (NS),
measured by counting the number of shoots in each plant; stem diameter (SD, mm), measured at 20 cm from the ground using a digital calliper; number of buds (NB), measured in a 20 cm segment in the middle third of the stem; leaf dry weight (LDW, g), measured after placing the leaves in forced-air circulation oven at 60 °C until constant weight was achieved, using an analytical balance; and petiole length (PL, cm), measured in fully developed leaves using a graduated ruler. NTR, WTR and RY refer to the mean of the two plantations; the remaining traits (morphological) were only evaluated in the second plantation.
STATISTICAL ANALYSIS
Analysis of variance (ANOVA) was performed, and homogeneity of variance was tested using the F test. Means were grouped using the Scott-Knott test (p<0.05). Genetic divergence was analysed using the generalized Mahalanobis distance (D2). Genotype cluster analysis was performed using Tocher’s optimization method and the hierarchical method unweighted pair group method using arithmetic averages (UPGMA), with the generalized Mahalanobis distance as the dissimilarity measure. The relative contribution of each trait to genetic divergence between M. esculenta genotypes was evaluated using Singh’s method (Singh 1981). All statistical analyses were performed using Genes software (Cruz 2013).
RESULTS AND DISCUSSION
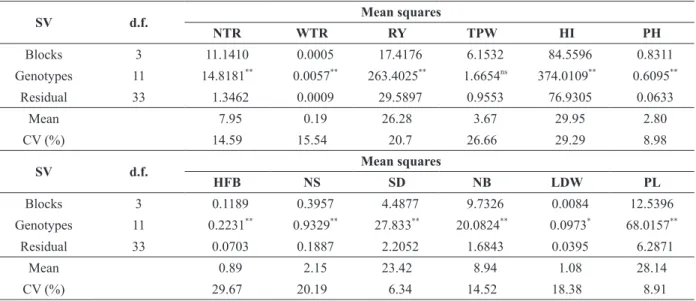
Except for TPW, all morphoagronomic traits evaluated differed according to M. esculenta genotype (Table II). This shows the genetic heterogeneity of the studied M. esculenta population, which is important to genetic divergence analyses and favorable to genetic improvement because it indicates the possibility of identifying superior and divergent individuals.
et al. 2007, Partelli et al. 2010). Lime application was not necessary. Fertilization was applied at planting, with the equivalent of 330 kg ha-1 single superphosphate and 100 kg ha-1 potassium chloride. Cover fertilizations were performed 50 days after planting with application of 65 kg ha-1 urea. Basic management practices were performed during cultivation, especially during the initial stage, such as manual weeding, sprinkler irrigation and plant health control.
MORPHOAGRONOMIC CHARACTERIZATION The plants in the useful area were collected 12 months after planting, and the following morphoagronomic traits were evaluated: number of tuberous roots per plant (NTR); weight of tuberous roots (WTR, kg), calculated as the ratio between total root weight and number of roots; root yield (RY, t ha-1), calculated by multiplying the weight of root per plant and the number of plants per hectare; total plant weight (TPW, kg), calculated as the sum of root weight, stump weight and shoot weight for each plant; harvest index (HI, %), calculated as the ratio between WTR and TPW; plant height (PH, m), measured from the ground to the terminal bud;
height of first branch (HFB, m), measured from the
TABLE I
Evaluated Manihot esculenta genotypes, in a municipality located in the north of the state of Espírito Santo, Brazil.
Identification Name Identification Name
1 Gema de
Ovo 7 Saracura
2 Eucalipto 8 São
Rafael
3 Camuquem 9 Cacau
4 Aipim do
Sol 10 Amarela
5 Paraguai 11 Goiás
6 Cacauzinho 12 Cassava
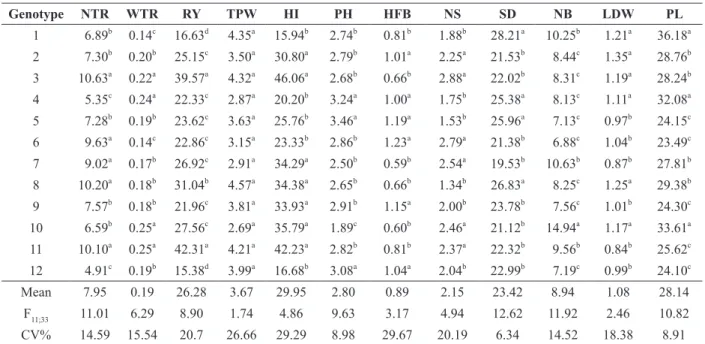
Most traits presented a low (CV<10%) or medium coefficient of variation (CV<20%) (Pimentel-Gomes 2009), indicating good experimental accuracy (Cruz et al. 2014). The Scott-Knott test for morphoagronomic traits grouped the genotypes into up to four groups (Table III).
Three groups were formed for NTR and WTR. NTR varied between 4.91 and 10.63 (mean=7.95 kg), and WTR between 0.14 and 0.25 kg (mean=0.19 kg). The group with the highest NTR was formed
by five genotypes (3, 8, 11, 6 and 7), all presenting
NTR higher than 9.02, with a mean of 9.92 roots per plant. The group with highest WTR was formed by four genotypes (10, 11, 4 and 3), of which only two were also included in the group with highest NTR, and one belonged to the group with lowest NTR. The same was observed for the group with the highest mean NTR, indicating no correlation between these traits.
The highest variability was observed for root yield (RY), which varied between 15.38 and 42.31 t ha-1
, and the genotypes were divided into four
groups. The group with the highest mean RY was composed of genotypes 11 and 3 and presented a mean RY of 40.94 t ha-1, 55.78% higher than the overall mean (26.28 t ha-1) (Table III). This indicates that the most productive plants presented a higher number of tuberous roots and root weight. On the other hand, the lowest RY was observed for genotypes 1 (16.63 t ha-1) and 12 (15.38 t ha-1). Previous studies also observed a positive correlation between RY and number of roots per plant (Rós and São João 2016, Tumuhimbise et al. 2015, Silva et al. 2016).
HI is the ratio between WTR and TPW. HI varied between 15.94 and 46.06 (mean 29.95), and only two groups were formed for this trait. The group presenting the highest HI was formed by seven genotypes (3, 11, 10, 8, 7, 9 and 2), all with HI higher than 30.8. HI higher than 50% is considered ideal. However, varieties with higher HI do not always present higher root production because plants with both low root and low shoot production also present high HI (Silva et al. 2002, Gomes et al. TABLE II
Summary of variance analysis for 12 morphoagronomic traits evaluated for 12 genotypes of Manihot esculenta. Vila Valério, Espírito Santo, Brazil.
SV d.f. Mean squares
NTR WTR RY TPW HI PH
Blocks 3 11.1410 00.0005 017.4176 06.1532 084.5596 00.8311
Genotypes 11 14.8181**
00.0057**
263.4025**
01.6654ns
374.0109**
00.6095**
Residual 33 01.3462 00.0009 029.5897 00.9553 076.9305 00.0633
Mean 07.95 00.19 26.28 03.67 029.95 02.80
CV (%) 14.59 15.54 020.7 26.66 029.29 08.98
SV d.f. Mean squares
HFB NS SD NB LDW PL
Blocks 3 00.1189 00.3957 04.4877 09.7326 00.0084 12.5396
Genotypes 11 00.2231**
00.9329**
27.833**
20.0824**
00.0973*
68.0157**
Residual 33 00.0703 00.1887 02.2052 01.6843 00.0395 06.2871
Mean 00.89 02.15 23.42 08.94 01.08 28.14
CV (%) 29.67 20.19 06.34 14.52 18.38 08.91
ns , **
and *: not significant, significant at p≤0.01, and significant at p≤0.05, respectively, according to the F test. SV: Source of Variation; d.f.: degrees of freedom; CV: Coefficient of Variation; NTR: number of tuberous roots per plant; WTR: weight of
tuberous roots; RY: root yield; TPW: total plant weight; HI: harvest index; PH: plant height; HFB: height of first branch; NS:
2007). In fact, genotype 9 presented relatively high HI but low root and shoot production. Lower HI is usually due to diversion of carbohydrates from roots to the emission of new shoots.
Three groups were formed for plant height (PH), which ranged between 1.89 m (genotype 10) and 3.46 m (genotype 5). The group with the highest PH was formed by genotypes 5, 4 and 12. The second group was formed by 8 genotypes, with PH between 2.50 and 2.91 m. The third group was formed only by genotype 10. The ideal height for cassava plants has
not been established. Taller plants may be beneficial
for some crop management practices, but they are also more prone to stalk lodging. On the other hand, investment in shoot growth may compromise root production by unbalancing sink-source relationships (Lambers et al. 2008), thereby compromising the production of tuberous roots (Gomes et al. 2007) and resulting in lower HI. In fact, the three genotypes that formed the group with higher PH (genotypes 5,
4 and 12) presented lower-than-average productivity and lower HI.
Two groups were formed for HFB. The group with the highest HFB was formed by genotypes 6, 5, 9, 12, 2 and 4, with a mean HFB of 1.10 m. The second group was also formed by six genotypes (1, 11, 3, 8, 10 and 7) and presented a mean HFB of 0.69 m. In general, higher HFB tends to facilitate crop management practices, especially those related to harvest and weed management and intercropping (Vidigal Filho et al. 2000, Gomes et al. 2007).
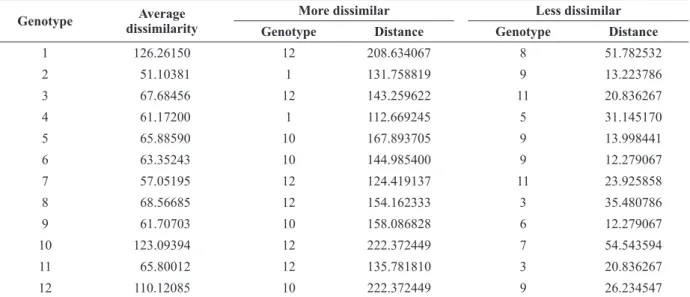
The maximum and minimum dissimilarity for each of the 12 genotypes of M. esculenta, based on the generalized Mahalanobis distance (D2), varied between 12.279 and 222.372, indicating wide genetic diversity between individuals (Table IV).
The genetic divergence analysis, based on the generalized Mahalanobis distance (D2), showed lower dissimilarity between genotypes 6 and 9 (12.28) and genotypes 2 and 9 (13.22) and higher dissimilarity between genotypes 10 and 12 (222.37) TABLE III
Morphoagronomic traits evaluated in 12 genotypes of Manihot esculenta. Vila Valério, Espírito Santo, Brazil.
Genotype NTR WTR RY TPW HI PH HFB NS SD NB LDW PL
1 06.89b 0.14c 16.63d 4.35a 15.94b 2.74b 0.81b 1.88b 28.21a 10.25b 1.21a 36.18a 2 07.30b
0.20b 25.15c 3.50a 30.80a 2.79b 1.01a 2.25a 21.53b
08.44c
1.35a
28.76b 3 10.63a
0.22a 39.57a 4.32a 46.06a 2.68b 0.66b 2.88a 22.02b
08.31c
1.19a
28.24b 4 05.35c
0.24a 22.33c 2.87a 20.20b 3.24a 1.00a 1.75b 25.38a
08.13c
1.11a
32.08a 5 07.28b
0.19b 23.62c 3.63a 25.76b 3.46a 1.19a 1.53b 25.96a
07.13c
0.97b
24.15c 6 09.63a 0.14c 22.86c 3.15a 23.33b 2.86b 1.23a 2.79a 21.38b 06.88c 1.04b 23.49c 7 09.02a
0.17b 26.92c 2.91a 34.29a 2.50b 0.59b 2.54a 19.53b 10.63b 0.87b 27.81b 8 10.20a
0.18b 31.04b 4.57a 34.38a 2.65b 0.66b 1.34b 26.83a
08.25c
1.25a
29.38b 9 07.57b 0.18b 21.96c 3.81a 33.93a 2.91b 1.15a 2.00b 23.78b 07.56c 1.01b 24.30c 10 06.59b
0.25a 27.56c 2.69a 35.79a 1.89c 0.60b 2.46a 21.12b 14.94a 1.17a 33.61a 11 10.10a
0.25a 42.31a 4.21a 42.23a 2.82b 0.81b 2.37a 22.32b
09.56b
0.84b
25.62c 12 04.91c
0.19b 15.38d 3.99a 16.68b 3.08a 1.04a 2.04b 22.99b
07.19c
0.99b
24.10c
Mean 7.95 0.19 26.28 3.67 29.95 2.80 0.89 2.15 23.42 8.94 1.08 28.14
F11;33 11.01 6.29 8.90 1.74 4.86 9.63 3.17 4.94 12.62 11.92 2.46 10.82
CV% 14.59 15.54 20.7 26.66 29.29 8.98 29.67 20.19 6.34 14.52 18.38 8.91
Means followed by the same letter within the same column belong to the same group, according to the Scott-Knott test, at p≤05.
NTR: number of tuberous roots per plant; WTR: weight of tuberous roots (kg); RY: root yield (t ha-1
); TPW: total plant weight (kg);
HI: harvest index; PH: plant height (m); HFB: height of first branch (m); NS: number of shoots; SD: stem diameter (mm); NB:
and genotypes 1 and 12 (208.63). These genotype combinations should result in higher heterosis and therefore in a higher probability of recovering superior genotypes in segregating generations (Falconer 1983).
Grouping by the Tocher ’s optimization method is based on group formation and uses the generalized Mahalanobis distance (D2) as a measure of genetic dissimilarity. This method grouped the
12 genotypes into four different groups (Table V).
This shows the genetic variability between the evaluated genotypes because this method tries to minimize the distance within groups and maximize the distance between groups.
Four different groups were formed by Tocher’s
method, with group III (genotype 10) and group IV (genotype 1) being formed by only one genotype (Table V). The fact that these genotypes were grouped alone indicates that they were more
divergent. The first group was formed by half of
the genotypes evaluated (5, 9, 12, 4, 2 and 6), and the second by four genotypes (3, 11, 7 and 8). Nick et al. (2010) studied 100 subsamples of cassava and
Zuin et al. (2009) 43 cassava accessions collected in the northwest region of the state of Paraná, and both observed the formation of nine groups. Those
authors reported that the first group included more
than half of the studied population, similarly to the present study.
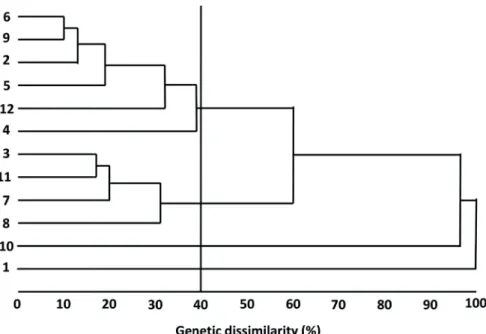
Grouping by UPGMA was performed using the generalized Mahalanobis distance (D2) as the genetic dissimilarity measure, and a dendrogram was constructed showing the genetic distance between the studied genotypes. An upper threshold TABLE IV
Mean, maximumand minimum dissimilarity for 12 genotypes of Manihot esculenta based on the generalized Mahalanobis distance (D2
), considering 12 morphoagronomic traits1
. Vila Valério, Espírito Santo, Brazil. Genotype Average
dissimilarity
More dissimilar Less dissimilar
Genotype Distance Genotype Distance
1 126.26150 12 208.634067 8 51.782532
2 051.10381 1 131.758819 9 13.223786
3 067.68456 12 143.259622 11 20.836267
4 061.17200 1 112.669245 5 31.145170
5 065.88590 10 167.893705 9 13.998441
6 063.35243 10 144.985400 9 12.279067
7 057.05195 12 124.419137 11 23.925858
8 068.56685 12 154.162333 3 35.480786
9 061.70703 10 158.086828 6 12.279067
10 123.09394 12 222.372449 7 54.543594
11 065.80012 12 135.781810 3 20.836267
12 110.12085 10 222.372449 9 26.234547
1
Number of tuberous roots per plant; mean tuberous root weight; root yield; total plant weight; harvest index; plant height; height
of first branch; number of shoots; stem diameter; number of buds; leaf dry weight; petiole length.
TABLE V
Grouping by the Tocher method, based on the generalized Mahalanobis distance (D2), of 12 genotypes of Manihot esculenta, considering 12 morphoagronomic traits1
. Vila Valério, Espírito Santo, Brazil.
Groups Genotypes
1 5 9 12 4 2 6
2 3 11 7 8
3 10
4 1
1
of 40% dissimilarity between genotypes was established for genotypes to be included in the
same group. Four groups were formed using this method (Figure 1).
The groups formed by UPGMA were similar to those formed using Tocher’s method. Zuin et
al. (2009) observed a similar grouping of cassava accessions using Tocher’s method and hierarchical neighbor joining, with an upper threshold of 70% dissimilarity between genotypes. Similar grouping
using optimization and hierarchical methods was
also reported for robusta coff ee (Coff ea canephora) (Covre et al. 2016), bean (Phaseolus vulgaris) (Gonçalves et al. 2016), peach trees (Prunus persica)
(Silva et al. 2014b), and Byrsonima dealbata (Lourenço et al. 2013). It should be highlighted that all genotypes constituting the most divergent pairs based on the generalized Mahalanobis distance (D2
)
(Table IV) were placed into four diff erent groups by
both Tocher’s optimization method (Table V) and UPGMA when the upper threshold of dissimilarity
between genotypes was set at 40% (Figure 1).
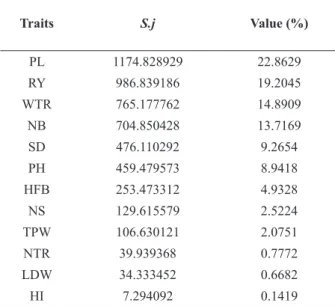
The relative contributions of the 12 morphoagronomic traits to the genetic distance between the 12 genotypes of M. esculenta, analysed using the Singh method (1981), varied between 0.14% and 22.86% (Table VI).
The traits that most contributed to genetic divergence between genotypes were PL (22.86%), RY (19.20%), average WTR (14.89%) and NB (13.72%), together being responsible for approximately 70.64% of the genetic divergence between genotypes. Zuin et al. (2009) also observed PL (18.04%) to be one of the traits that most contributed to genetic divergence between table cassava accessions. On the other hand, HI (0.14%), average LDW (0.67%) and NTR (0.77%) were the traits that least contributed to genetic divergence. However, their omission from the analysis resulted
in signifi cant changes to grouping, indicating that
trait omission is not desirable.
CONCLUSIONS
There is considerable genetic divergence between the M. esculenta genotypes evaluated, indicating Figure 1 - Dendrogram showing genetic dissimilarity between 12 genotypes of Manihot
esculenta, determined by UPGMA, based on the generalized Mahalanobis distance (D2 ),
considering 12 morphoagronomic traits. Note: cophenetic correlation coeffi cient (CCC):
that this population can be potentially used in future genetic improvement programmes. Genotypes “Camuquem” and “Goiás” were the most productive, and genotypes “Amarela” and “Gema de Ovo” were the most divergent. The genotypes were similarly grouped into four groups by Tocher’s optimization and hierarchical UPGMA. Of the analysed traits, PL, RY, WTR
and NB were the most efficient in explaining the
dissimilarity between genotypes. Future studies should evaluate the studied genotypes under
different environmental conditions (e.g., drought
and salinity) and identify molecular markers for the selection of elite genotypes.
ACKNOWLEDGMENTS
The authors would like to thank the Fundação de Amparo à Pesquisa e Inovação do Espírito Santo (FAPES), Conselho Nacional de Desenvolvimento
Científico e Tecnológico (CNPq), and Coordenação
de Aperfeiçoamento de Pessoal de Nível Superior
(CAPES) for financial support.
REFERENCES
AGRE AP, BHATTACHARJEE R, DANSI A, LOPEZ-LAVALLE LAB, DANSI M AND SANNI A. 2017. Assessment of cassava (Manihot esculenta Crantz) diversity, loss of landraces and farmers preference criteria in southern Benin using farmers’ participatory approach. Genet Resour Crop Ev 64: 307-320.
ALMEIDA FILHO JE, TARDIN FD, GUIMARÃES JFR, RESENDE MDV, SILVA FF, SIMEONE ML, MENEZES CB AND QUEIROZ VAV. 2016. Multi-trait BLUP model indicates sorghum hybrids with genetic potential for agronomic and nutritional traits. Genet and Mol Res 15: 1-9.
ALVARES CA, STAPE JL, SENTELHAS PC, GONÇALVES JLM AND SPAROVEK G. 2013. Köppen’s climate classification map for Brazil. Meteorol Z 22: 711-728. ANA - AGÊNCIA NACIONAL DE ÁGUAS. 2015. A bacia
do Rio Doce: características da bacia. Disponível em <http://www.ana.gov.br/cbhriodoce/bacia/caracterizacao. asp#clima> Acessado em 19 de março de 2015.
BOAS SAV, OLIVEIRA SAS, BRAGANÇA CAD, RAMOS JB AND OLIVEIRA EJ. 2017. Survey of fungi associated with cassava root rot from different producing regions in Brazil. Sci Agr 74: 60-67.
BROWN CH, CLEMENT CR, EPPS P, LUEDELING E AND WICHMANN S. 2013. The Paleobiolinguistics of Domesticated Manioc (Manihot esculenta). Ethnobiol Lett 4: 61-70.
COSTA TR, VIDIGAL FILHO OS, VIDIGAL MCG, GALVÁN MZ, LACANALLO GF, SILVA LI AND KVITSCHAL MV. 2013. Genetic diversity and population structure of sweet cassava using simple sequence repeat (SSR) molecular markers. Afr J Biotechnol 12: 1040-1048. COVRE AM, CANAL L, PARTELLI FL, ALEXANDRE RS,
FERREIRA A AND VIEIRA HD. 2016. Development of clonal seedlings of promising Conilon coffee (Coffea canephora) genotypes. Aust J Crop Sci 10: 385-392. CRUZ CD. 2013. GENES: A software package for analysis in
experimental statistics and quantitative genetics. Acta Sci-Agron 35: 271-276.
CRUZ CD, CARNEIRO PCS AND REGAZZI AJ. 2014. Modelos biométricos aplicados ao melhoramento genético, Viçosa: Universidade Federal de Viçosa, 668 p.
DALCOMO JM, VIEIRA HD, FERREIRA A, LIMA WL, FERRÃO RG, FONSECA AFA, FERRÃO MAG AND PARTELLI FL. 2015. Evaluation of genetic divergence among clones of conilon coffee after scheduled cycle pruning. Genet and Mol Res 14: 15417-15426.
TABLE VI
Relative contributions of 12 morphoagronomic traits to genetic divergence between 12 genotypes of Manihot esculenta, according to the Singh method (1981), based on
the generalized Mahalanobis distance (D2
). Vila Valério, Espírito Santo, Brazil.
Traits S.j Value (%)
PL 1174.828929 22.8629
RY 986.839186 19.2045
WTR 765.177762 14.8909
NB 704.850428 13.7169
SD 476.110292 9.2654
PH 459.479573 8.9418
HFB 253.473312 4.9328
NS 129.615579 2.5224
TPW 106.630121 2.0751
NTR 39.939368 0.7772
LDW 34.333452 0.6682
HI 7.294092 0.1419
PL: petiole length; RY: root yield; WTR: weight of tuberous roots; NB: number of buds; SD: stem diameter; PH: plant
height; HFB: height of first branch; NS: number of shoots;
DELAQUIS E, DE HAAN S AND WYCKHUYS KAG. 2018. On-farm diversity offsets environmental pressures in tropical agro-ecosystems: A synthetic review for cassava-based systems. Agr Ecosyst Environ 251: 226-235. DIAS FTC, BERTINI CHCM, SILVA APM AND
CAVALCANTI JJV. 2015. Variabilidade genética de feijão-caupi de porte ereto e ciclo precoce analisada por marcadores RAPD e ISSR. Rev Cienc Agron 46: 563-572. FALCONER DS. 1983. Introduction to quantitative genetics,
London: Longman, 340 p.
FAO - FOOD AND AGRICULTURE ORGANIZATION OF THE UNITED NATIONS. 2017. Statistics Division. Available at < http://faostat3.fao.org/download/Q/QC/E > Accessed on January 25, 2017.
FERREIRA JÚNIOR JÁ, UNÊDA-TREVISOLI SH, ESPÍNDOLA SMCG, VIANNA VF AND DI MAURO AO. 2015. Diversidade genética em linhagens avançadas de soja oriundas de cruzamentos biparentais, quádruplos e óctuplos. Rev Cienc Agron 46: 339-351.
GOMES CN, CARVALHO SP, JESUS MAS AND CUSTÓDIO TN. 2007. Caracterização morfo agronômica e coeficientes de trilha de caracteres componentes da produção em mandioca. Pesqui Agropecu Bras 42: 1121-1130.
GONÇALVES DL, BARELLI MAA, SANTOS PRJ, OLIVEIRA TC, SILVA CR, NEVES LG, POLETINE JP AND LUZ PB. 2016. Variabilidade genética de germoplasma tradicional de feijoeiro comum na região de Cáceres-MT. Cienc Rural 46: 100-107.
IBGE - INSTITUTO BRASILEIRO DE GEOGRAFIA E ESTATÍSTICA. 2016. Levantamento Sistemático da Produção Agrícola. Rio de Janeiro: IBGE, 29(11): 86. Disponível em <ftp://ftp.ibge.gov.br/Producao_Agricola/ Levantamento_Sistematico_da_Producao_Agricola_ [mensal]/Fasciculo/lspa_201611.pdf > Acessado em 25 de janeiro de 2017.
KOUKOUMA R, YEDOMONHAN H, DANSI A, ADJATIN A AND AGRE P. 2016. Diversity and management of manana and plantain (Musa spp.) varieties in Togo. Int J Curr Res Biosci Plant Biol 3: 127-138.
LAMBERS H, CHAPIN III FS AND PONS JL. 2008. Plant physiological ecology. New York: Springer-Verlag, 604 p. LOURENÇO IP, FIGUEIREDO RW, ALVES RR, ARAGÃO
FAD AND MOURA CFH. 2013. Caracterização de frutos de genótipos de muricizeiros cultivados no litoral cearense. Rev Cienc Agron 44: 499-504.
MACHADO CMS, PIMENTEL NS, GOLYNSK A, FERREIRA A, VIEIRA HD AND PARTELLI FL. 2017. Genetic diversity among 16 genotypes of Coffea arabica
in the Brazilian cerrado. Genet Mol Res 16: gmr16039794. MEHOUENOU FM, DASSOU A, SANOUSSI F, DANSI A,
ADJATIN A, DANSI M, ASSOGBA P AND AHISSOU H. 2016. Physicochemical characterization of cassava
(Manihot esculenta) elite cultivarsof Southern Benin. Int J Adv Res Biol Sci 3: 190-199.
MORAIS LK, SANTIAGO AD AND CAVALCANTE MHB. 2017. Phenotypic stability in cassava estimated by the AMMI analysis with supplementary genotypes. Crop Br Ap Biotechnol 17: 366-372.
MOURA EF, SOUSA NR, MOURA MF, DIAS MC, SOUZA ED, FARIAS NETO JT AND SAMPAIO JE. 2016. Molecular characterization of accessions of a rare genetic resource: sugary cassava (Manihote suculenta Crantz) from Brazilian Amazon. Genet Resour Crop Ev 63: 583-593.
NASSAR NMA. 2000. Cytogenetics and Evolution of cassava (M. esculenta Crantz). Genet Mol Biol 23: 1003-1014. NICK C, CARVALHO SP, JESUS MAS, CUSTÓDIO TN,
MARIM BG AND ASSIS LHB. 2010. Divergência genética entre subamostras de mandioca. Bragantia 69: 289-298.
ORTIZ AHT, ROCHA VPC, MOIANA LD, VIDIGAL MCG, GALVÁN MZ AND VIDIGAL FILHO OS. 2016. Population Structure and Genetic Diversity in Sweet Cassava Cultivars from Paraná, Brazil. Plant Mol Biol Report 34: 1153-1166.
PARTELLI FL, RAMOS JGA, TAKEUCHI KP AND VIEIRA HD. 2010. Cultivo da mandioca no cerrado goiano. Goiânia: Vieira, 92 p.
PIMENTEL-GOMES P. 2009. Curso de Estatística Experimental. Piracicaba: Fealq, 451 p.
POOTAKHAM W, SHEARMAN JR, AREERATE PR, SONTHIROD C, SANGSRAKRU D, JOMCHAI N, YOOCHA T, TRIWITAYAKORN K, TRAGOONRUNG S AND TANGPHATSORNRUANG S. 2014. Large-Scale SNP Discovery through RNA sequencing and SNP genotyping by targeted enrichment sequencing in cassava (Manihot esculenta Crantz). PLoS ONE 9: 12.
PREZOTTI LC, GOMES JÁ, DADALTO GG AND OLIVEIRA JÁ. 2007. Manual de recomendação de calagem e adubação para o Estado do Espírito Santo - 5ª aproximação. Vitória: SEEA/Incaper/Cedagro, 305 p. REFLORA. 2017. Herbário Virtual. Disponível em <http://
floradobrasil.jbrj.gov.br/reflora/herbarioVirtual/>. Acessado em 15 de fevereiro de 2017.
RODRIGUES WP, VIEIRA HD, TEODORO PE, PARTELLI FL AND BARBOSA DHSG. 2016. Assessment of genetic divergence among coffee genotypes by Ward-MLM procedure in association with mixed models. Genet Mol Res 15: 1-7.
ROGERS DJ AND APPAN SG. 1973. Manihot and
Manihotoides (Euforbiaceae). Flora Neotropica. New York: Hafner, 272 p.
SCHMITZ GJH, ANDRADE JM, VALLE TL, LABATE CA AND NASCIMENTO JRO. 2016. Comparative proteome analysis of the tuberous roots of six cassava (Manihot esculenta) varieties reveals proteins related to phenotypic traits. J Agr Food Chem 64: 3293-3301.
SILVA AMO, SILVA GF, DIAS MC, CLEMENT CR AND SOUSA NR. 2014a. Inter-retrotransposon-amplified polymorphism markers for germplasm characterization in
Manihote sculenta (Euphorbiaceae). Genet Mol Res 13: 3800-3804.
SILVA JOC, CREMASCO JPG, MATIAS RGP, SILVA DFF, SALAZAR AH AND BRUCKNER CH. 2014b. Divergência genética entre populações de pessegueiro baseada em características da planta e do fruto. Cienc Rural 44: 1770-1775.
SILVA RM, FARALDO MFI, ANDO A AND VEASEY EA. 2002. Variabilidade genética de etnovariedades de mandioca. In: Cereda MP (Ed), Cultura de tuberosas amiláceas Latino Americanas, São Paulo: Fundação Cargill, p. 207-242.
SILVA RS, MOURA EF, FARIAS NETO JT AND SAMPAIO JE. 2016. Genetic parameters and agronomic evaluation of cassava genotypes. Pesqui Agropecu Bras 51: 834-841.
SINGH D. 1981. The relative importance of characters affecting genetic divergence. Indian J Genet Plant Br 41: 237-245.
TUMUHIMBISE R, SHANAHAN P, MELIS R AND KAWUKI R. 2015. Genetic variation and association among factors influencing storage root bulking in cassava. J Agr Sci 153: 1267-1280.
VIDAL AM, VIEIRA LJ, FERREIRA CF, SOUZA FVD, SOUZA AS AND LEDO CAS. 2015. Genetic fidelity and variability of micropropagated cassava plants (Manihote sculenta Crantz) evaluated using ISSR markers. Genet Mol Res 14: 7759-7770.
VIDIGAL FILHO OS, PEQUENO MG, SCAPIM CA, VIDIGAL MCG, MAIA RR, SAGRILO E, SIMON GA AND LIMA RS. 2000. Avaliação de cultivares de mandioca na região noroeste do Paraná. Bragantia 59: 69-75. ZERBIELLI L, NIENOW AA, DALACORTE L, JACOBS
R AND DARONCH T. 2016. Diversidade físico-química dos frutos de jabuticabeiras em um sítio de ocorrência natural. Rev Bras Frut 38: 107-116.