http://dx.doi.org/10.1590/S1678-9946201860077
1Universidade de São Paulo, Faculdade de Medicina, Departamento de Moléstias Infecciosas, São Paulo, São Paulo, Brazil
2Universidade de São Paulo, Faculdade de Medicina, Hospital das Clínicas, Laboratório de Parasitologia (LIM 46), São Paulo, São Paulo, Brazil
3Universidade de São Paulo, Faculdade de Medicina, Hospital das Clínicas, Laboratório de Medicina Laboratorial (LIM 03), São Paulo, São Paulo, Brazil
4Universidade de São Paulo, Instituto de Medicina Tropical de São Paulo, São Paulo, São Paulo, Brazil
Correspondence to: Ester Cerdeira
Sabino
Universidade de São Paulo, Instituto de Medicina Tropical de São Paulo, Avenida Dr. Enéas Carvalho de Aguiar, 470, CEP 05403-000, São Paulo, SP, Brazil
E-mail:[email protected]
Received: 17 May 2018
Accepted: 7 November 2018
An alternative storage method for characterization of the intestinal microbiota through next generation sequencing
Roberto Marques Ribeiro1,2, Marcela de Souza-Basqueira1,2, Léa Campos de Oliveira3, Flavia Cristina Salles2, Natalia Bueno Pereira2, Ester Cerdeira Sabino1,2,4
ABSTRACT
Gut microbiota has been the subject of various molecular studies mainly due to its importance and wide-ranging relationships with human hosts. However, the storage of fecal samples prior to DNA extraction is critical when characterizing the composition of intestinal microbiota. Therefore, we aimed to understand the effects of different fecal storage methods to characterize intestinal microbiota using Next Generation Sequencing (NGS) as well as to establish an alternative conservation method of bacterial genetic material in these samples using guanidine. Stool samples from 10 healthy volunteers were collected. Each sample was divided into five aliquots: one aliquot was extracted immediately after collection (fresh) and two aliquots were subjected to freezing at -20 °C or -80 °C and extracted after 48 h. The other two aliquots were stored in guanidine at room temperature or 4 °C and extracted after 48 h. The V4 hypervariable regions of the bacterial and archeal 16S rRNA gene were amplified by PCR and sequenced using an Ion Torrent PGM platform for NGS. The data were analyzed using QIIME software. Statistical significance was determined using a non-parametric Kruskal-Wallis test. A total of 11,494,688 reads with acceptable quality were obtained. Unweighted principal coordinate analysis (PCoA) revealed that the samples were clustered based on the host rather than by the storage group. At the phylum and genus levels, we observed statistically significant differences between two genera, Proteobacteria (p=0.013)
and Suterella (p=0.004), comparing frozen samples with guanidine-stored samples. Our data
suggest that the use of guanidine can preserve bacterial genetic materials as well as freezing, providing additional conveniences.
KEYWORDS: Next Generation Sequencing. Stool storage method. Microbiota. Gut
microbiota
INTRODUCTION
Intestinal microbiota includes roughly 500 different species of bacteria in the human colon; the density of species can reach 1012 cells/mL, and Bacteroides
as well as Firmicutes phyla are the most commonly reported1. There are up to
100 trillion microbes in the gut with a genetic diversity 100-fold greater than that of the human genome2. Because of its enormous complexity, intestinal microbiota
plays a crucial role in the health of the digestive system and the health of the human host via direct impacts on nutrient absorption, pathogen protection, and modulation of the immune system3.
bowel disease7, and obesity8have been described. Intestinal
microbiota, due to their importance and wide-ranging relationships with human hosts, has been the target of several molecular and culture-based studies2. Fecal samples
do not require biopsy and are collected by a non-invasive procedure. These samples contain exfoliated epithelial cells that may include relevant information about the microbiota of the gastrointestinal tract9. Therefore, this study compared
the gut bacteria proportion to determine the best stool storage method for microbiome studies.
MATERIAL AND METHODS
Ethics
Fecal samples were collected from 10 healthy participants between the ages of 23 and 49 (mean age: 36 years; standard deviation: 13.2 years). The majority had at least a bachelor’s degree (70%), and all of the individuals were non-Hispanic caucasians. None of the individuals had used antibiotics for at least a month. All of the procedures involving human subjects were approved by the Internal Review Board of the University of Sao Paulo (Comissao de Etica para Analise de Projetos de Pesquisa – CAPPesq), process Nº 12801. The participants provided written informed consent, which was securely stored in our laboratory according to Brazilian research policies.
Collection and storage of stool samples
We used the Fisherbrand™ Commode Specimen Collection System (ThermoFisher, Waltham, Massachusetts, USA) to collect the stool samples that were processed up to 1 h after collection.
In the laboratory, the samples were weighed and separated into five different aliquots (20 g each). One aliquot was submitted to DNA extraction immediately after collection, and two aliquots were stored at -20 °C and -80 °C and the DNA was extracted after 48 h. The two remaining aliquots were maintained in a 6 M guanidine HCl-0.2 M EDTA solution, one at room temperature (RT) and the other at 4 °C and DNA was extracted after 48 h.
DNA extraction
The genomic DNA extraction was performed using a Power Soil DNA Isolation Kit® (Mobio Laboratories,
Carlsbad, CA, USA) with modifications. This procedure enabled a more efficient extraction of DNA from stool samples in a manner consistent with that performed by the
Human Microbiome Project10. Briefly, the sample tubes
were heated for 10 min at 65 °C, 10 min at 95 °C and then centrifuged for 2 min after the addition of C3 solution. All other steps were performed according to the manufacturer’s instructions.
Library preparation and 16S sequencing
The V4 variable region of the 16S rRNA gene was amplified using the primers 515F (5′-GTGCCAGCM GCCGCGGTAA-3′) and 806R (5′-GGACTACHVGG GTWTCTAAT-3′)11. These primers were designed to
include the adaptor sequences used in the Ion Torrent NGS library preparation protocol containing the barcode sequence on the forward primer. The samples were normalized to 12.5 ng/μL of DNA material per library, and the amplification was performed in Veriti 96-well PCR equipment (ThermoFisher, Waltham, Massachusetts, USA) followed by AMPure XP bead cleanup (Beckman
Coulter Life Sciences, Brea, California, USA). PCR
conditions were 94 °C for 3 min, followed by 40 cycles of denaturation at 94 °C for 30 s, annealing at 58 °C for 30 s and extension at 68 °C for 1 min. PCR products were analyzed by 1.5% agarose gel electrophoresis, stained with ethidium bromide solution and visualized under ultraviolet light. Emulsion PCR was carried out using an Ion PGM™ Template OT2 400 Kit (ThermoFisher, Waltham, Massachusetts, USA) in accordance with the manufacturer’s instructions. Sequencing of the amplified products was carried out using the Ion PGM™ Sequencing 400 Kit in an Ion Torrent TM Personal Genome Machine
(ThermoFisher, Waltham, Massachusetts, USA) using an Ion 318TM chip kit v2 (ThermoFisher, Waltham,
Massachusetts, USA) with 16 libraries per chip. All samples were sequenced once.
Data analysis
Sequences were processed using the latest version of the Ion Torrent server (version 5.0.4). This procedure removes low quality and polyclonal sequences by filtering. The resulting reads were used as an input into the Qiime (Quantitative Insights into Microbial Ecology) software package (version 1.8)12 according to the Brazilian
Microbiome Project13. Reads were grouped into operational
taxonomic units (OTUs) based on 97% identity using UCLUST UPARSE (version 7)14. The representative
sequences were then classified by taxonomy using the Greengenes database version 13.815 as a reference on Qiime.
Statistical analyses
The species richness/diversity lost during storage was assessed by comparing each storage method (i.e., -80 °C, -20 °C, guanidine +4 °C and guanidine RT) with the control (fresh sample). For the alpha diversity, we used pairwise comparisons for observed OTUs, the Shannon diversity index, the Chao1 richness estimate and Simpson’s diversity index. For beta diversity, we calculated weighted and unweighted Unifrac distance matrices.
To describe the microbial populations among the five storage groups, samples were combined according to the type of extraction method (using 13,000 reads for each sample). Then, the proportion of each taxonomic group was analyzed using the non-parametric Kruskal-Wallis test. All analyses were performed using the GraphPad Prism 6 statistical software (Company, Location). A p-value of <0.05 (pc) was considered statistically significant after the Bonferroni correction for multiple tests.
RESULTS
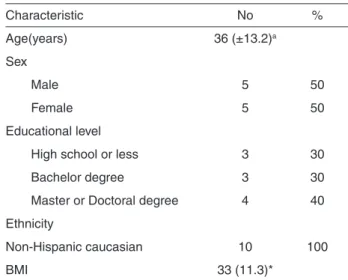
Participants were healthy adults with age varying from 23 to 49 years old and a mean age of 36 (standard deviation, 13.2) years. The majority had at least a bachelor degree (70%) and was non-Hispanic caucasians (100%). No participants had used antibiotics in the month before the fecal sample collection (Table 1). A total of 11,494,688 reads with acceptable quality were obtained after the application of filters using the Torrent Browser software, generating an average of 229,894 reads (45,343+-±29,381 [mean+-SD] sequences per sample).
The number of sequence reads did not differ significantly as a function of the collection method (Table 2; p = 0.825).
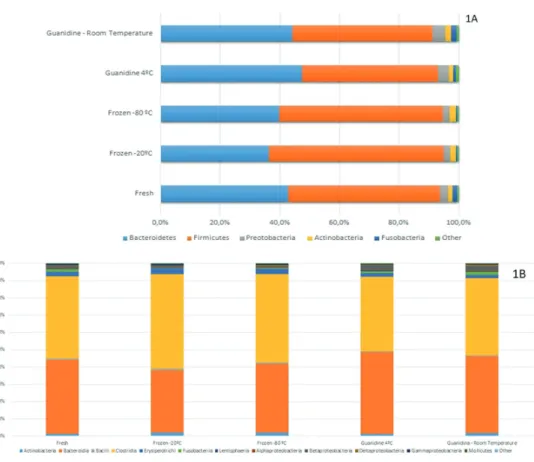
Regarding the five main phyla, Bacteroidetes and
Firmicutes were the most representative. The proportion
of Bacteroidetes observed among fresh samples was 42%,
and in samples subjected to freezing at -20 °C and -80 °C 36% and 39% Bacteroidetes, respectively (Figure 1A). The
Proteobacteria phylum exhibited significant differences
in proportion as a function of storage (p=0.019), but these differences did not persist after the Bonferroni correction (pc=0.095). Similar trends were observed comparing frozen samples with stored guanidine ones (Supplementary Table 1).
Clostridia (48%) and Bacteroidia (42%) were the
most common classes (Figure 1B), but there were no significant differences between them (p=0.512 and 0.630, respectively). Despite its low frequency, Betaproteobacteria showed statistically significant results (pc=0.048), however, no significant differences were observed when groups were compared separately (Supplementary Table 2).
At the family level, Bacteroidaceae (31%),
Lachnospiraceae (23%), and Ruminococcaceae (19%)
were the most prevalent (Figure 1C) but did not exhibit statistically significant differences between groups (Supplementary Table 3).
The genera Bacteroides, Faecalibacterium, Prevotella,
and Ruminococcus were the most common (Figure 1D).
Only the genus Suterella exhibited a statistically significant difference (pc=0.108) as a function of storage conditions (Supplementary Table 4).
The alpha diversity indices, Chao1 richness estimate, observed species richness, and Shannon and Simpson diversity indices was used to determine whether alterations in microbial diversity occurred because of different fecal storage conditions. The rarefaction graph of the observed species indicated that the number of analyzed readings in the microbiota did not facilitate complete determination of the existing diversity. However, the slope of the curve was
Table 2 - Filtered sequence reads according to the fecal samples storage method
Storage method Filtered sequence reads (mean+-SD)*
Method 1: fresh 49.864 (32.347)
Method 2: -20ºC 40.876 (32.721)
Method 3: -80ºC 50.399 (28.807)
Method 4: guanidine 4ºC 40.356 (22.015)
Method 5: guandine RT 45.222 (28.178)
RT: room temperature; *Kruskal-Wallis test (p=0.825)
Table 1 - Descriptive statistics of study participants (n = 10)
Characteristic No %
Age(years) 36 (±13.2)a
Sex
Male 5 50
Female 5 50
Educational level
High school or less 3 30
Bachelor degree 3 30
Master or Doctoral degree 4 40
Ethnicity
Non-Hispanic caucasian 10 100
BMI 33 (11.3)*
*Data are expressed as mean (standard deviation). BMI: body
modified at the point related to the approximate number of 1,000 reads (Figure 2). In summary, the alpha diversity analysis did not exhibit significant differences between storage groups (Table 3).
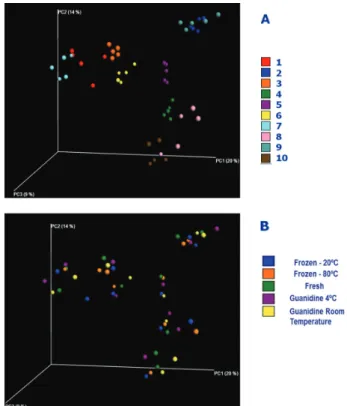
Diversity analysis of the intestinal microbiota was related to different taxonomic units and their phylogenetic relationships (Unifrac weighted) as a function of storage conditions. Unifrac wnweighted via principal coordinate analysis (PCoA) was not considered. The variation explained by the variables in the various axes of PCoA associated with the unweighted Unifrac analyses was less than 20%. However, even with this low variation, one could see that the samples were grouped according to the individuals (Figure 3A). All five samples from the one individual clustering were more closely related than the other samples from the same storage group (Figure 3B).
When we considered the relative abundance of OTUs from the comparative diversity analysis of the samples via the unbalanced Unifrac method, we noted a higher variation of results than among the ones based on the unweighted Unifrac method. The variation explained in the several axes of the main coordinate graph was 51% in the PC1 axis and 14% in the PC2 axis. However, the samples were grouped with greater proximity based on the individuals analyzed rather than with samples from the same storage group (data not shown).
DISCUSSION
There were no differences between the storage protocols and the overall microbiota composition. Our results showed no differences among the relative abundance of the bacteria when comparing fresh, frozen at -20 °C or -80 °C, and samples stored in guanidine at 4 °C and at RT. However, differences were observed between samples from different individuals rather than different stool storage methods.
Bacterial abundances were evaluated for each sample. When the relative abundance of the phylum Proteobacteria and the family Alcaligenaceae were evaluated for all conditions,there was no differencebetween fresh samples and samples stored in guanidine solution at either RT or at 4 °C for 48 h. However, there were differences in the relative abundance between frozen samples and samples
Table 3 - Alpha-Diversity estimation of fresh samples: -20 ºC frozen; -80 ºC frozen; guanidine at 4 °C and guanidine at room temperature
Fresh Frozen - 20ºC Frozen - 80ºC Guanidine 4ºC Guanidine room
temperature p-value
Chao1 richness estimate 302 331 318 318 325 0.996
Shannon index 5.26 5.33 5.32 5.21 5.32 0.988
Simpson's diversity index 0.93 0.93 0.93 0.93 0.94 0.916
Number of observed species 241 258 258 244 257 0.901
Figure 2 - Alpha Rarefaction Index - Number of observed
species graph.
Figure 3 - PCoA analysis based on unweighted UniFrac
stored in guanidine solution. Studies have shown that despite a low prevalence in the gut, an increase in the phylum Proteobacteria may be associated with dysbiosis, i.e., a higher risk of developing diseases16. Therefore, it
is important not to underestimate the prevalence of these bacteria.
Higher but not significant levels of Firmicutes were noted in samples stored for 48 h at -20 °C and -80 °C compared to fresh samples. This result supports the findings of previous studies that demonstrated a higher proportion
of Firmicutes in frozen samples compared to fresh ones17.
Samples stored in guanidine for 48 h had lower levels of phylum Firmicutes than those found in fresh samples; however, the differences were not statistically significant.
The bacterial diversity related to alpha and beta diversity analysis after 48 h of storage showed no significant differences compared to fresh samples. Previously, studies using the pyro-sequencing technique and the Illumina MiSeq platform demonstrated that frozen samples were grouped based on the volunteers rather than on the storage protocol17,18.
Here, we propose an alternative method to maintain the microbiota DNA integrity using a solution of 6 M guanidine/ EDTA19,20as RNA later21 and other preservative buffers are
cost prohibitive for field studies.The guanidine method , along with other alternative ones including OMNIgene, GUT, Tris-EDTA22, ethanol and lyophilization23, makes
these studies feasible.
Several reports have indicated the importance of conservation and storage of samples for evaluation of fecal microbiota21,24,25. It is widely accepted that immediate
processing or freezing of stool samples are the best way to maintain bacterial DNA integrity26. Immediate freezing at
-20 °C or below has been considered the gold standard for microbiome preservation27. This approach is not feasible
in many field studies, however, storing samples at RT for long periods of time may alter microbiota composition28.
Alternative storage conditions, which keep bacterial DNA intact, are imperative for microbiota studies through Next Generation Sequencing. Recent studies28,29 have
shown that test cards for fecal occult blood screening may be a good alternative for stool sample conservation. Vlčková et al.21 showed that ethanol is a good alternative
for Enterobacteriaceae preservation. However, the use of ethanol in microbiota studies must be carefully evaluated because certain types of bacteria can be sensitive to ethanol. Although preservative buffers may alter fecal microbiota22,
they should be considered in field studies30 when freezing of
samples is not feasible. A sample stored at RT prior to DNA extraction may also exhibit degradation and altered relative bacterial abundances at the time of analysis25. As noted by
Kia et al.31, sample integrity can be preserved for years if
they are appropriately stored after DNA extraction. Besides immediately frozen samples, another alternative would be to homogenize the samples prior to DNA extraction, which may also improve the quality of microbiome analysis32.
Several studies have demonstrated the importance of samples conservation and storage procedures to evaluate fecal microbiota. A study using 16S rRNA gene pyrolysis technology revealed that the phylogenetic structure of feces microbiota does not change significantly when samples are stored at various temperatures over 3-14 days31. However,
this study did not include samples obtained immediately after defecation. Therefore, it is possible that the intestinal microbiota has quickly degraded and consequently maintained this composition over this time. In another study using pyrosequencing, stool samples stored at -80 °C for six months exhibited microbial compositions and diversities more similar to those of samples processed within 30 min after defecation33.
The use of chemical preservatives, as proposed here, should be evaluated for each application because different bacteria may exhibit different levels of sensitivity to these preservatives.
Although our study only assessed storage conditions of fecal samples over a short period of time, other studies have examined samples over longer time periods and found no significant changes in intestinal microbiota17,34. However,
we expect to continue to study these fecal samples for months and even years as a function of storage methods using the next-generation Ion Torrent PGM sequencing platform. This work will answer questions about long-term storage.
One of the possible limitations of our study is that participants were healthy. Therefore, we could not asses the effect of highly dysbiotic microbiota on different collection methods. In contrast, previous studies have included patients with irritable bowel syndrome and inflammatory bowel disease35,36. In general, even in these studies, differences
were not observed between different groups; this finding was independent of the collection material. The number of studied individuals may have also contributed to the fact that no statistically significant differences were observed. Even using rarefaction plots, we were unable to reach all OTUs in the samples after more than 13,000 reads. The Shannon index exhibited low variability in the estimated diversity among the samples analyzed in the different storage conditions, probably contributing to the lack of discriminatory power of the rarefaction plots.
the analyzed samples. A study by Cardona et al.25 showed
degradation of fecal sample DNA after storage at RT for 3 h. We were unable to examine this specific point because our samples were stored at RT for no more than 30 min. In contrast, Guo et al.37 reported no difference in alpha
diversity for stool storage at RT up to 2 h, and Shaw et al.38
also showed significant changes in the microbial community after only 2 days of storage at RT. Differences in extraction methods may alter DNA yields, independent of the sample type (fresh or frozen). Furthermore, storage conditions may adversely affect the main phyla, which are frequently used as biomarkers of gut microbiota24. The bacterial region,
as well as the methods used to detect them, is also very important. The 16S bacterial RNA gene has been used to determine bacterial microbiota39 and the V4 region of the
16S gene, used in this study, is commonly sequenced to identify bacterial species40 due to its highly conserved and
hypervariable regions, which confers a signature sequence that is species-specific.
Prior studies used methods ranging from simple amplification of the 16S RNA gene by PCR to Next Generation Sequencing, which we also used. Semiconductor sequencing has known limitations, including pairing errors and homopolymer detection. These limitations must be taken into account depending on the type of study that has been performed41,42. A number of approaches, including
optimization of the bioinformatics pipeline and increased depth of coverage, are generally used in analyses based on this type of method that seek to overcome the shortcomings of the Ion Torrent platform43. In addition, this study only
evaluated the bacterial 16S rRNA gene. Future studies, including those focusing on shotgun sequencing, should consider the effect of collection methods on the analyses.
Our results suggest that guanidine can conserve fecal samples for microbiome studies if freezing is not possible or is troublesome. Using guanidine for the collection and storage of stool samples in microbiome studies allows researchers to avoid using dry ice in the field, also reducing the need of -20 °C and -80 °C freezers. Room-temperature storage can remove possible interferers, such as problems associated with freezing/thawing cycles. Finally, this type of sample collection can enable collaborative studies that span laboratories across different geographic locations. These studies might reduce the effects of sample collection and could reduce the associated costs.
ETHICAL APPROVAL AND CONSENT
Samples were obtained from volunteers after signing a written informed consent, according to recommendations of the hospital´s Internal Review Board (Comissão de Etica
para Analise de Projetos de Pesquisa – CAPPesq), process Nº 12801.
CONFLICT OF INTERESTS
The authors declare that they have no conflict of interests.
FUNDING
This study was supported by Fundação Faculdade de Medicina (FFM) under the Laboratory of Medical Investigation (LIM 46) resources.
AUTHORS’ CONTRIBUTIONS
Conceptualization: RMR, ECS. Formal analysis: RMR, MS-B. Funding acquisition: ECS. Investigation: RMR, LCO, FCS, NBP, MS-B. Methodology: RMR, LCO, FCS, NBP, MS. Supervision: ECS. Visualization: RMR, MS-B, LCO, ECS. Writing – original draft: RMR. Writing – review & editing: all. All authors read and approved the final manuscript.
ACKNOWLEDGMENTS
We thank Luiz Nali, Paulo Urbano, and Felipe Scassi for their help during the sample collection period, Ricardo Dalla Costa for assistance with the Ion Torrent library preparation and sequencing, and Dr. Rajan Jayant for the English correction.
REFERENCES
1. Bäckhed F, Fraser CM, Ringel Y, Sanders ME, Sartor RB, Sherman PM, et al. Defining a healthy human gut microbiome: current concepts, future directions, and clinical applications. Cell Host Microbe. 2012;12:611-22.
2. Dave M, Higgins PD, Middha S, Rioux KP. The human gut microbiome: current knowledge, challenges, and future directions. Transl Res. 2012;160:246-57.
3. Francino MP. Early development of the gut microbiota and immune health. Pathogens. 2014;3:769-90.
4. Gangarapu V, Yıldız K, Ince AT, Baysal B. Role of gut microbiota: obesity and NAFLD. Turk J Gastroenterol. 2014;25:133-40.
5. Gülden E, Wong FS, Wen L. The gut microbiota and type 1 diabetes. Clin Immunol. 2015;159:143-53
6. Hur KY, Lee MS. Gut microbiota and metabolic disorders. Diabetes Metab J. 2015;39:198-203.
8. Cox LM, Blaser MJ. Pathways in microbe-induced obesity. Cell Metab. 2013;17:883-94.
9. Li K, Bihan M, Yooseph S, Methé BA. Analyses of the microbial diversity across the human microbiome. PLoS One. 2012;7:e32118.
10. McInnes P, Cutting M, coordination. Manual of procedures for human microbiome project: core microbiome sampling, protocol A, HMP protocol # 07-001, version number: 12.0. [cited 2018 Nov 6]. Available from: https://www.ncbi.nlm. nih.gov/projects/gap/cgi-bin/GetPdf.cgi?id=phd003190.2.
11. Caporaso JG, Lauber CL, Walters WA, Berg-Lyons D, Huntley J, Fierer N, et al. Ultra-high-throughput microbial community analysis on the Illumina HiSeq and MiSeq platforms. ISME J. 2012;6:1621-4.
12. Caporaso JG, Kuczynski J, Stombaugh J, Bittinger K, Bushman FD, Costello EK, et al. QIIME allows analysis of high-throughput community sequencing data. Nat Methods. 2010;7:335-6.
13. Pylro VS, Roesch LF, Morais DK, Clark IM, Hirsch PR, Tótola MR. Data analysis for 16S microbial profiling from different benchtop sequencing platforms. J Microbiol Methods. 2014;107:30-7.
14. Edgar RC. UPARSE: highly accurate OTU sequences from microbial amplicon reads. Nat Methods. 2013;10:996-8.
15. DeSantis TZ, Hugenholtz P, Larsen N, Rojas M, Brodie EL, Keller K, et al. Greengenes, a chimera-checked 16S rRNA gene database and workbench compatible with ARB. Appl Environ Microbiol. 2006;72:5069-72.
16. Shin NR, Whon TW, Bae JW. Proteobacteria: microbial signature of dysbiosis in gut microbiota. Trends Biotechnol. 2015;33:496-503.
17. Fouhy F, Deane J, Rea MC, O’Sullivan Ó, Ross RP, O’Callaghan G, et al. The effects of freezing on faecal microbiota as determined using MiSeq sequencing and culture-based investigations. PLoS One. 2015;10:e0119355.
18. Wu GD, Lewis JD, Hoffmann C, Chen YY, Knight R, Bittinger K, et al. Sampling and pyrosequencing methods for characterizing bacterial communities in the human gut using 16S sequence tags. BMC Microbiol. 2010;10:206.
19. Dorn PL, Selgean S, Guillot M. Simplified method for preservation and polymerase chain reaction-amplification of Trypanosoma cruzi DNA in human blood. Mem Inst Oswaldo Cruz. 1997;92:253-5.
20 Avila HA, Pereira JB, Thiemann O, De Paiva E, DeGrave W, Morel CM, et al. Detection of Trypanosoma cruzi in blood specimens of chronic chagasic patients by polymerase chain reaction amplification of kinetoplast minicircle DNA: comparison with serology and xenodiagnosis. J Clin Microbiol. 1993;31: 2421-6.
21. Vl ková K, Mrázek J, Kope ný J, Petrželková KJ. Evaluation of different storage methods to characterize the fecal bacterial
communities of captive western lowland gorillas (Gorilla gorilla gorilla). J Microbiol Methods. 2012;91:45-51.
22. Choo JM, Leong LE, Rogers GB. Sample storage conditions significantly influence faecal microbiome profiles. Sci Rep. 2015;5:16350.
23. Blekhman R, Tang K, Archie EA, Barreiro LB, Johnson ZP, Wilson ME, et al. Common methods for fecal sample storage in field studies yield consistent signatures of individual identity in microbiome sequencing data. Sci Rep. 2016;6:31519.
24. Bahl MI, Bergström A, Licht TR. Freezing fecal samples prior to DNA extraction affects the Firmicutes to Bacteroidetes ratio determined by downstream quantitative PCR analysis. FEMS Microbiol Lett. 2012;329:193-7.
25. Cardona S, Eck A, Cassellas M, Gallart M, Alastrue C, Dore J, et al. Storage conditions of intestinal microbiota matter in metagenomic analysis. BMC Microbiol. 2012;12:158.
26. Costea PI, Zeller G, Sunagawa S, Pelletier E, Alberti A, Levenez F, et al. Towards standards for human fecal sample processing in metagenomic studies. Nat Biotechnol. 2017;35:1069-76.
27. Vogtmann E, Goedert JJ. Epidemiologic studies of the human microbiome and cancer. Br J Cancer. 2016;114:237-42.
28. Röder B, Frühwirth K, Vogl C, Wagner M, Rossmanith P. Impact of long-term storage on stability of standard DNA for nucleic acid-based methods. J Clin Microbiol. 2010;48:4260-2.
29. Dominianni C, Wu J, Hayes RB, Ahn J. Comparison of methods for fecal microbiome biospecimen collection. BMC Microbiol. 2014;14:103.
30. Klymiuk I, Bambach I, Patra V, Trajanoski S, Wolf P. 16S based microbiome analysis from healthy subjects’ skin swabs stored for different storage periods reveal phylum to genus level changes. Front Microbiol. 2016;7:2012.
31. Kia E, Wagner Mackenzie B, Middleton D, Lau A, Waite DW, Lewis G, et al. Integrity of the human faecal microbiota following long-term sample storage. PLoS One. 2016;11:e0163666.
32. Gorzelak MA, Gill SK, Tasnim N, Ahmadi-Vand Z, Jay M, Gibson DL. Methods for improving human gut microbiome data by reducing variability through sample processing and storage of stool. PLoS One. 2015;10:e0134802.
33. Lauber CL, Zhou N, Gordon JI, Knight R, Fierer N. Effect of storage conditions on the assessment of bacterial community structure in soil and human-associated samples. FEMS Microbiol Lett. 2010;307:80-6.
34. Carroll IM, Ringel-Kulka T, Siddle JP, Klaenhammer TR, Ringel Y. Characterization of the fecal microbiota using high-throughput sequencing reveals a stable microbial community during storage. PLoS One. 2012;7;e46953.
35. Kostic AD, Xavier RJ, Gevers D. The microbiome in inflammatory bowel disease: current status and the future ahead. Gastroenterology. 2014;146:1489-99.
fecal microbiota composition in healthy and diseased subjects. PLoS One. 2015;10: e0126685.
37. Guo Y, Li SH, Kuang YS, He JR, Lu JH, Luo BJ, et al. Effect of short-term room temperature storage on the microbial community in infant fecal samples. Sci Rep. 2016;6:26648.
38. Shaw AG, Sim K, Powell E, Cornwell E, Cramer T, McClure ZE, et al. Latitude in sample handling and storage for infant faecal microbiota studies: the elephant in the room? Microbiome. 2016;4:40.
39. Tannock GW. Analysis of the intestinal microflora using molecular methods. Eur J Clin Nutr. 2002;56 Suppl 4:S44-9.
40. Wang Q, Garrity GM, Tiedje JM, Cole JR. Naive Bayesian classifier for rapid assignment of rRNA sequences into the new bacterial taxonomy. Appl Environ Microbiol. 2007;73:5261-7.
41. Salipante SJ, Kawashima T, Rosenthal C, Hoogestraat DR, Cummings LA, Sengupta DJ, et al. Performance comparison of Illumina and ion torrent next-generation sequencing platforms for 16S rRNA-based bacterial community profiling. Appl Environ Microbiol. 2014;80:7583-91.
42. Panek M, ip i Paljetak H, Bareši A, Peri M, Matijaši M, Lojki I, et al. Methodology challenges in studying human gut microbiota : effects of collection, storage, DNA extraction and next generation sequencing technologies. Sci Rep. 2018;8:5143.
43. Loman NJ, Misra RV, Dallman TJ, Constantinidou C, Gharbia SE, Wain J, et al. Performance comparison of benchtop high-throughput sequencing platforms. Nat Biotechnol. 2012;30:434-9.
Supplementary Table 1 – Relative abundance of Phila observed in fresh samples: frozen at – 20 ºC; - 80 ºC; guanidine at 4 ºC and guanidine at room temperature
Fresh %
-20 ºC %
-80 ºC %
Guanidine 4 ºC %
Guanidine room temperature
%
p value pc
Bacteroidetes 42.80 36.20 39.80 47.30 44.20 0.630
Firmicutes 50.80 58.80 54.90 45.60 47.10 0.447
Preotobacteria 2.80 2.20 2.20 3.80 4.30 0.019 0.095
Fusobacteria 1.60 0.40 0.50 1.10 1.70 0.935
Actinobacteria 1.40 2.00 2.10 1.30 2.00 0.631
Outros 0.60 0.40 0.50 0.90 0.70
p: p value obtained from Kruskal Wallis test; pc: p value corrected by Bonferroni for multiple tests.
Supplementary Table 2 – Relative abundance of main Classes observed in fresh samples:frozen at -20 ºC; -80 ºC; guanidine at 4 ºC and guanidine at room temperature
Fresh %
-20 ºC %
-80 ºC %
Guanidine 4 ºC %
Guanidine room temperature
%
p value pc
Clostridia 47.66 54.65 51.18 43.01 44.58 0.512
Bacteroidia 42.79 36.17 39.76 47.32 44.16 0.630
Erysipelotrichi 2.53 3.26 3.05 2.01 1.91 0.337
Betaproteobacteria 1.64 0.81 0.91 2.81 2.83 0.004 0.044
Fusobacteriia 1.61 0.39 0.52 1.14 1.65 0.975
Gammaproteobacteria 0.71 0.88 0.75 0.36 0.53 0.893
Bacilli 0.64 0.86 0.71 0.59 0.57 0.789
Mollicutes 0.35 0.37 0.33 0.41 0.33 0.970
Deltaproteobacteria 0.28 0.33 0.43 0.38 0.63 0.687
Alphaproteobacteria 0.20 0.15 0.12 0.28 0.35 0.837
Lentisphaeria 0.12 0.01 0.01 0.33 0.38 0.116
Outros 1.47 2.12 2.23 1.36 2.08
Supplementary Table 3 - Relative abundance of main Families observed in fresh samples: frozen at -20 ºC; -80 ºC; guanidine at 4 ºC and guanidine at room temperature
Fresh %
-20 ºC %
-80 ºC %
Guanidine 4 ºC
%
Guanidine room temperature
%
p value pc
Bacteroidaceae 31.36 27.55 29.75 33.85 32.64 0.895
Lachnospiraceae 23.50 29.77 28.40 17.04 19.11 0.213
Ruminococcaceae 18.76 18.22 16.55 20.62 19.74 0.930
Prevotellaceae 6.85 4.49 4.42 8.43 6.55 0.999
Erysipelotrichaceae 2.53 3.26 3.05 2.01 1.91 0.337
Paraprevotellaceae 1.70 1.54 2.63 1.71 1.70 0.984
Alcaligenaceae 1.63 0.80 0.90 2.80 2.82 0.003 0.054
Bifidobacteriaceae 1.35 1.95 2.00 1.22 1.90 0.968
Porphyromonadaceae 0.89 0.82 1.06 0.74 0.75 0.560
Odoribacteraceae 0.85 0.67 0.66 1.01 1.15 0.293
Clostridiaceae 0.83 0.83 0.62 0.58 0.45 0.907
Veillonellaceae 0.83 1.50 1.24 0.67 0.52 0.609
Enterobacteriaceae 0.57 0.77 0.66 0.26 0.42 0.859
Rikenellaceae 0.45 0.39 0.49 0.55 0.49 0.971
Barnesiellaceae 0.39 0.36 0.38 0.56 0.46 0.807
Streptococcaceae 0.35 0.55 0.46 0.25 0.29 0.521
Desulfovibrionaceae 0.28 0.33 0.43 0.38 0.63 0.687
Christensenellaceae 0.11 0.10 0.12 0.07 0.11 0.941
Outros 6.77 6.10 6.18 7.25 8.36
Supplementary Table 4-Relative abundance of main Genera observed in fresh samples: frozen at – 20 ºC; - 80 ºC;guanidine at 4 ºC and guanidine at room temperature
Fresh %
-20 ºC %
-80 ºC %
Guanidine 4 ºC
%
Guanidine room temperature
%
p value pc
Bacteroides 31.36 27.55 29.75 33.85 32.63 0.630
Faecalibacterium 8.86 6.87 6.45 10.93 9.84 0.305
Prevotella 8.19 5.64 6.63 9.89 7.91 0.999
Ruminococcus 5.65 6.64 5.47 3.31 4.12 0.897
Blautia 3.92 5.86 5.47 2.56 3.39 0.336
Coprococcus 2.05 2.34 2.26 1.43 1.39 0.230
Roseburia 1.98 2.39 2.31 1.69 1.45 0.992
Lachnospira 1.70 1.31 1.23 1.35 1.47 0.585
Sutterella 1.63 0.80 0.90 2.80 2.82 0.001 0.111
Fusobacterium 1.61 0.39 0.52 1.14 1.65 0.935
Bifidobacterium 1.35 1.95 2.00 1.22 1.90 0.971
Dorea 0.92 1.40 1.26 0.74 0.87 0.259
Parabacteroides 0.89 0.82 1.06 0.74 0.75 0.560
Dialister 0.66 1.27 1.05 0.59 0.38 0.893
Eubacterium 0.60 0.45 0.38 0.46 0.41 0.496
Odoribacter 0.50 0.38 0.40 0.68 0.73 0.191
Oscillospira 0.47 0.43 0.48 0.46 0.70 0.834
Catenibacterium 0.35 0.40 0.23 0.18 0.24 0.974
Butyricimonas 0.35 0.29 0.26 0.33 0.41 0.421
Paraprevotella 0.35 0.38 0.41 0.24 0.32 0.957
Streptococcus 0.33 0.52 0.44 0.23 0.27 0.478
Anaerostipes 0.21 0.17 0.17 0.18 0.16 0.974
Bilophila 0.17 0.22 0.31 0.19 0.35 0.644
Lactobacillus 0.17 0.13 0.09 0.21 0.12 0.938
Haemophilus 0.14 0.08 0.08 0.07 0.07 0.979
Desulfovibrio 0.11 0.10 0.12 0.18 0.28 0.942
Others 25.48 31.22 30.27 24.35 25.37