1. INTRODUCTION
This document describes the activities carried out in 2004 in the frame of the Contract of Associated Laboratory on Plasma Physics and Engineering, signed on November 23rd 2001 between “Instituto Superior Técnico” (IST) and “Fundação para a Ciência e a Tecnologia” (FCT). These activities are inserted in two thematic areas:
• Controlled Nuclear Fusion;
• Technologies of Plasmas and High-Power Lasers, and have been performed by staff of two Research Units of IST:
¾ Centro de Fusão Nuclear (CFN); ¾ Centro de Física dos Plasmas (CFP).
The CFN research staff has been organized in four scientific groups:
o Group of Experimental Physics (Head: Carlos Varandas);
o Group of Microwave Diagnostics (Head: Maria Emilia Manso);
o Group of Theory and Modelling (Head: Fernando Serra);
o Group of Control and Data Acquisition (Head: Jorge Sousa)
which carried out in 2004 the following projects1: Tokamak ISTTOK (Figure 1.1);
Participation in the Collective Use of the JET Facilities by the EFDA Associates;
Participation in the ASDEX-UPGRADE Programme; Participation in the TJ-II Programme;
Participation in the MAST Programme; Participation in the TCV Programme;
Participation in the ITER Project (Figure 1.2);
Figure 1.2 – The tokamak ITER
Other Activities on Theory and Modeling;
Other Activities on Control, Data Acquisition and Signal Processing.
Figure 1.1 – The tokamak ISTTOK
1
The CFP research staff has been organized in three scientific groups:
o Group of Lasers and Plasmas (Head: José Tito Mendonça);
o Group of Space Plasmas (Head: Armando Brinca); o Group of Gas Discharges and Gaseous Electronics
(Head: Carlos Matos Ferreira).
which performed activities in the following research lines: Ultra high power, ultra-short lasers2
(Figure 1.3); Theory and simulation on extreme plasma physics2
; Studies on complex and space plasmas;
Space plasma physics
Environmental Plasma Engineering (Figure 1.4); Modelling of plasma reactors.
The research and development activities carried out in the frame of these projects are described in detail in chapters 2 to 13, which also present the main scientific and technical results. Chapter 14 describes other activities and chapter 15 contains the list of publications.
Figure 1.3 – Ultra-short laser system
Figure 1.4 – Surface wave sustained discharge
2
2. TOKAMAK ISTTOK
H. Fernandes, C. Silva and C.A.F. Varandas (Heads), M.P. Alonso, B.B. Carvalho, I. Carvalho, P. Carvalho, R. Coelho, J. Ferreira, H. Figueiredo, J. Fortunato, R. Gomes, I. Nedzelskij, A. Neto, T. Pereira, V. Plyusnin, A. Soares, Y. Tashev, D. Valcárcel.
2.1. INTRODUCTION
ISTTOK is a small-size (R=46 cm, a=8.5 cm), large-aspect-ratio, low magnetic field (0.46 T) limiter tokamak with an iron core transformer (flux swing of 0.22 Vs), equipped with a distributed VME control and data acquisition system. Its low temperature (150 eV) low density (8x10¹⁸ m-3) plasmas are diagnosed by electric and magnetic probes, a microwave interferometer, a heavy ion beam diagnostic, a Thomson Scattering system and spectroscopic diagnostics.
The main objectives of this project are: (i) the development of new diagnostic and control and data acquisition systems; (ii) testing of new operation scenarios (liquid metal limiter and alternating plasma current); (iii) study of the influence of external applied signals on the plasma confinement and stability; and (iv) education and training on tokamak physics and engineering.
This project included in 2004 work in the following research lines:
• Testing of the liquid metal limiter concept; • Diagnostics;
• Control and data acquisition; • Plasma physics studies.
2.2. TESTING OF THE LIQUID METAL LIMITER CONCEPT
IST/CFN has proceeded with the collaboration with the Association EURATOM/University of Latvia on the testing of the liquid metal limiter concept.
The liquid metal loop experimental rig has been commissioned in the ISTTOK Laboratory. Tests of this experimental apparatus have begun. A controlled heating system, using a Dallas DS80-C400 microprocessor with Ethernet connection and Java based technology, has been designed, implemented and tested, intended to ensure a 60 ºC stable temperature in the main liquid metal loop. A device to introduce oxide-free Gallium in the main loop for compatibility with UHV operation has been implemented and tested (Figure 2.1). The Gallium cleaning system has been tested. A heating backup system designed to keep Ga in the lower part of the loop always above the melting point has been implemented. A free expansion tank, where Gallium could be stored for long periods, has been designed, implemented and tested (Figure 2.2).
One Portuguese Researcher has participated in Riga in an experimental campaign, aiming at testing a new fast frame camera and studying the jet stability with several diameter nozzles (1.5, 1.8, 2.1 and 2.4 mm).
Figure 2.1 - System designed to introduce oxide-free Gallium in the main reservoir.
2.3. DIAGNOSTICS 2.3.1. Introduction
A new diagnostic for magnetohydrodynamic (MHD) studies has been implemented using signals from a set of 12 equally spaced Mirnov coils. A new Gundestrup probe for flow measurements has been developed, giving particular attention to the materials used in its construction. The time-of-flight technique for plasma potential measurements by the heavy ion beam diagnostic with a multiple cell array detector has been optimized. The possibility of using this diagnostic for zonal flows studies has been theoretically evaluated. The design of a soft X-ray tomography diagnostic based on commercial CCD cameras has started. The emissive electrode used in biasing experiments has been optimized, aiming at easy replacement of the emitter material and operation for longer periods.
Figure 2.2 - Gallium store tank
Figure 2.3 - Jet image obtained with the fast frame camera
2.3.2 Diagnostic for MHD studies
This diagnostic uses signals from a set of twelve equally spaced Mirnov coils, originally designed for plasma shape and position equilibrium determination (Figure 2.4). The data acquisition and processing system is based on a locally-developed galvanic isolated, 8 channel, fast PCI
transient recorder module, with a 2 MSPS sampling rate, 14 bit resolution and a total memory of 256 MWords. This module includes a Digital Signal Processor (DSP) and a Field Programmable Gate Array (FPGA), allowing real-time determination of MHD modes using advanced identification algorithms, in a sub-millisecond cycle time.
Preliminary data analysis indicates the presence of rotating modes with dominant m=3 poloidal mode number with frequencies of the order of 100 kHz (about 480 times smaller than characteristic toroidal Alfven time).
Figure 2.4 - Schematic drawing of the ISTTOK poloidal layout, showing magnetic probe positions.
2.3.3. Gundestrup probe
A new Gundestrup probe has been developed, giving particular attention to the materials used in its construction, aiming at its operation in fusion plasmas. Copper and quartz have been replaced respectively by molybdenum and boron nitride.
The probe has been successfully operated in a large number of ISTTOK discharges without perturbing the plasma behavior. Furthermore, no significant damage in the probe has been found after its removal from the machine, proving that the new probe design is adequate to be used in the edge of tokamak plasmas.
2.3.4. Plasma potential measurements by heavy ion beam diagnostic with time-of-flight energy analyzer A 4-channel time-of-flight energy analyzer (TOFEA) is being developed for plasma potential profile measurements with the heavy ion beam diagnostic (HIBD). Figure 2.5 presents the picture and schematic illustration of the diagnostic. It is placed inside an auxiliary vacuum chamber attached to a ISTTOK horizontal diagnostic port, and consists of three main parts: (i) a modified multi-channel array detector (MCAD) with TOFEA input slits; (ii) a control module with deflecting cylindrical electrostatic plates and a set of planar alignment electrostatic plates; and (iii) a TOF-path module with “start” and “stop” detectors.
One channel of the data acquisition system (DAS) (Figure 2.6) consists of conditioning electronics and a time-to-amplitude converter (TAC). The DAS is used in successive acquisitions of both “start” and “stop” signals, when they are discriminated inside the time-of-flight of the beam pulse along the TOF-path.
Figure 2.7 presents the plasma potential measured in the central region of the ISTTOK plasma by the HIBD and at plasma periphery by electric probes. Although the sign of the core plasma potential agrees with the neoclassical predictions, its absolute value is approximately 1.5-2 times higher (Φneo ~ - (120-200) V.
The sensitivity of plasma potential measurements by TOFEA has been checked in experiments with limiter biasing.
2.4. CONTROL AND DATA ACQUISITION 2.4.1. Main activities
Software for shared remote data consulting and analysis has started to be developed, aiming at replacing the existing applications based on DOS and allowing data viewing and analysis by any authorized user, from any personal computer, anywhere in the world. The upgrade of the ISTTOK data acquisition system from the former “dbf” files-based system to an Open Source RDBMS PostgreSQL database has begun, by creating a PostgreSQL data mirror in a Linux server, replicating the original data structure and copying the pulse data on a Figure 2.5 - Picture and schematic drawing of the four-channel
TOFEA.
Figure 2.7 - Profile of the plasma potential measured by the TOFEA
daily basis to the new relational database, using script codes written in “Python”. A modular USB controller for low speed (8 kbytes/s) data acquisition has been developed. The system consists of a small printed circuit board that incorporates 8 I/O lines, 8 open collector lines for power control (500 mA each), I2C bus, as well as 4 analog lines (12 bit of maximum resolution). A library of functions in C language has been also developed to be used with this interface, which allows a quick and simple implementation in slow control and data acquisition systems. A cooperative multi-user program has started to be developed in Java to control and launch the ISTTOK discharges, replacing the present DOS shot launcher program.
2.4.2. Software for shared remote data consulting and analysis “QueryTOK”
A platform, based on standards like CORBA, XML and JAVA, has been developed allowing accessing to data and its analysis in a straight forth way. Several users may be connected simultaneously to the platform and whenever a user launches his configuration query the resulting data is broadcasted to all users, allowing simultaneous analysis and discussion of results between users (Figure 2.8).
Each user has a collection of profiles where he may store the parameters, equations and macros that he usually requests from the database. These profiles can be stored locally or directly in the database and may be shared between users.
The software is plugin-based, allowing addition of new data viewers and data calculation algorithms without the need of rewriting any code. Data is stored in a SQL database and calculations are made locally or by remote computers, which run an application-server routine waiting for a remote procedure call for heavy calculus computation.
The application-server routine can be designed on any analysis code built on MatLab, Octave, IDL and others.
The entire platform is fully internationalized. Current available languages are Portuguese and English. The addition of a new language is trivial due to the use of JAVA standard internationalization mechanisms through the insertion of new bundles into the distribution. A built-in chat is also available for users to discuss hardware configuration and data analysis.
The platform is distributed using the JAVA Web-start technology, which greatly simplifies the installation process and version renewing.
2.5. PLASMA PHYSICS STUDIES
Following previous studies on the influence of emissive electrode biasing on the plasma confinement and stability, experiments have been made in 2004 aiming at a better characterization of the modifications introduced by the electrostatic polarization at the plasma edge The evolution of the radial electric field (Er) profile has been measured. Figure 2.9 presents the radial profiles of the floating potential and radial electric filed, measured by the rake probe. As the biasing is applied, a large electric field is observed for both polarities, reaching a value of around ±12 kV/m in the region near the limiter, associated with a strong Er shear. Therefore, the velocity shear may be responsible for the observed particle confinement improvement. This is corroborated by probe measurements, which show a decrease of the turbulent particle transport when the bias is applied.
-15 -10 -5 0 5 10 15 Distance to the LCFS (mm) -150 -100 -50 0 50
Floating Potential (V) Vbias=100 V Vbias=0 V Vbias=-200 V -10 -5 0 5 10 15 Distance to the LCFS (mm) -15 -10 -5 0 5 10 15 Electric field (kV/m)
Figure 2.9 - Floating potential and radial electric field radial profiles for positive (Vbias=100 V) and negative (Vbias=-200 V)
emissive electrode biasing. Profiles with no applied voltage are also shown for comparison.
Although the radial electric field induced by emissive electrode biasing is of the same magnitude for both polarities (~12 kV/m), a significant improvement in particle confinement is only observed for negative biasing. In order to understand this different behavior, edge turbulent transport is being investigated. The edge plasma parameters, and in particular the edge density, are characterized by intermittent events (low frequency, large amplitude oscillations). The behaviour of density fluctuations is clearly modified by emissive electrode biasing, being the large-scale transport events reduced for both polarities (Figure 2.10). The different behavior of the particle confinement for positive and negative biasing is possibly related with the large amplitude fluctuations with roughly Gaussian distribution induced by positive biasing. Furthermore, emissive electrode biasing as opposite effects on the low frequency edge fluctuations; at negative bias a reduction is observed for frequency below ~70 kHz, while for positive bias the fluctuations increase in this frequency range. 0 10 20 30 40 50 Isat (mA) 11468 11483 13.8 14.0 14.2 14.4 Time (ms) -4 -2 0 2 4 6 8 Radial Velocity (km/s) 13.8 14.0 14.2 14.4 Time (ms)
Figure 2.10 - Isat and the effective radial velocity in expanded
3. PARTICIPATION IN THE USE OF THE JET FACILITIES BY THE EFDA ASSOCIATES
F. Serra (Head), D. Alves, P. Belo, D. Borba, R. Coelho, S. Cortes, N. Cruz, L. Cupido, L. Fattorini, A. Figueiredo, B. Gonçalves, S. Hacquin, M.E. Manso, L. Meneses, F. Nabais, M.F. Nave, I. Nedzelski, I. Nunes, V. Plyusnin, T. Ribeiro, F. Salzedas, C. Silva, J. Sousa, C. Varandas, P. Varela.
3.1. INTRODUCTION
The Association EURATOM/IST has proceeded with its participation in the collective use of the JET1 Facilities, in the frame of the “European Fusion Development Agreement” (EFDA), through the “JET Operation Contract” and the “JET Implementing Agreement”.
This chapter presents the main activities carried out during this year in the areas of:
• Operation;
• Scientific exploitation; • Performance enhancements; • Management.
3.2. OPERATION
Three members of the IST/CFN staff have been involved in the JET operation: Drs. Sebastien Hacquin and Isabel Nunes have participated in the JET Operation Team, through Secondment Agreements with the Association EURATOM/UKAEA, working respectively in the “Electron Kinetics Group” and “Operation Group”; Mr. Luis Meneses has provided technical support to the operation and maintenance of the KG8 correlation reflectometer.
3.3. SCIENTIFIC EXPLOITATION 3.3.1. Introduction
The participation in the JET 2004 Work Programme had contributions from fifteen scientists to the experimental campaigns C13 and C14 at the JET site (Table 3.1).
The work has been focused on code developments, leading to the following studies and/or tasks in plasma physics and/or engineering mainly related with Task Forces M, D and E: (i) Study of the sawtooth stability in plasmas with counter-NBI; (ii) Expansion of the JET sawtooth database; (iii) Validation of q-profiles in JET optimised shear discharges; (iv) Documentation of JET diagnostics for analysis of fluctuations; (v) Stability domains for the internal kink mode; (vi) Limiter H-mode studies in JET; (vii) Evidence of fast ion redistribution during fishbones from TAE in JET deuterium plasmas; (VIII) Transport studies in Tritium plasmas; (ix) Time–frequency analysis of non-stationary fusion plasma signals by comparison between the Choi–Williams distribution and wavelets; (x) Disruptions and runaway electrons in JET; (xi) Effects of large magnetic islands on particle confinement trace-Tritium studies (TRANSP modelling); (xii) Cross-correlation between parallel and radial fluctuating velocities; (xiii) Design of a new reciprocating probe head; (xiv) Studies of
MHD and turbulence based on microwave reflectometry results.
Name Competence Number
of days
Duarte Borba TFL, MHDAE 47 M. Filomena Nave TSL, SL, MHDAE 52 Paula Belo IEMHDA, CATS 47
Fernando Nabais FPE 47
Vladislav Plyusnin MHDME 33
Carlos Silva KY3 19
Isabel Nunes KG8b 26
Jorge Ferreira PTM 26
Igor Nedzelski KY3 26
Luis Meneses KG8b 12
Ricardo Galvão MHDAE 32 Sebastien Hacquin JOC 20 Table 3.1 – IST/CFN staff envolved in the JET experimental campaigns
3.3.2. Study of the sawtooth stability in plasmas with counter-NBI
During a recent reversed toroidal field (BT) campaign at JET, experiments were performed to investigate the effect on sawteeth of NBI-driven toroidal plasma rotation counter to the direction of the toroidal plasma current (Ip) and BT. A power scan at constant density has permitted comparison of the reverse BT domain with previous experiments with forward field and hence co-rotation. Unlike observations with co-NBI heating where the sawtooth period increases with power, with counter-NBI the sawtooth period was found to decrease to a minimum value (about 1/3 of Ohmic sawtooth periods) at 4 MW (Figure 3.1). The possible reasons why the sawtooth period is shorter with counter-NBI are under investigation. In earlier JET experiments with reversed BT and Ip plasmas this was attributed to changes in the q-profile due to neutral beam current drive (NBCD). Modification in the core current density due to NBCD, jCD, was calculated with the PENCIL code. jCD was larger with counter-injection and increased with the input power (Figure 3.2). PENCIL calculations show that the fast ions pressure increased with power for both the usual and the reversed BT cases. The lack of correlation between the observed sawtooth period and fast ion pressure in the counter-NBI case indicates that the
contribution from the fast particle component cannot explain the observed sawtooth period dependence on PNBI. On the other hand, kinetic effects from trapped thermal ions qualitatively explain the sawtooth observations. The effect of sheared flow on these kinetic effects modifies the stability threshold of the internal kink mode in such a way that the critical beta for instability is much lower for small or reversed toroidal rotation, as observed in the discharges with reversed BT and IP.
1.3 1.4 1.5 1.5 1.6 1.6 1.95 2.00 2.05 Te (k eV) Time Time
Counter - NBI Co - NBI
PNBI = 4MW Ohmic Ohmic PNBI = 1MW PNBI = 1MW PNBI = 4MW JG04.206-7c 1.9 2.0 2.1 2.2 1.9 2.0 2.1 2.2 2.3 2.4 2.6 2.8 3.0 3.2 1s 1s
Figure 3.1 – Central electron temperature traces showing the different sawtooth behaviour for different input powers observed with co and counter NBI.
0 1.5 1.0 0.5 0 1.5 1.0 0.5 0 0.4 0.8 10 5Am -2 10 4Jm -3 ψ ψ Counter-NBI Co-NBI jCD jCD W⊥ W⊥ W|| W|| Wfast Wfast 0 0.4 0.8 1.2 0 -0.4 -0.8 -1.2 0 0.4 0.8 JG04.206-6c 0 0.4 0.8 0 0.4 0.8 PNBI = 4MW PNBI = 1MW PNBI = 4MW PNBI = 1MW
Figure 3.2 – (a) and (b) Profiles of fast ion energy density W//fast
and W⊥fast calculated with the PENCIL code (finite orbit width effects neglected); (c) and (d) Profiles of driven current density (jCD/j0≤10% for co- and counter-NBI).
3.3.3. Expansion of the JET Sawtooth Database
A sawtooth database, initiated during campaigns C1-C4 for the study of sawtooth observations in NBI heated discharges, has been expanded. The database now contains information
on ICRH discharges including recent experiments on grassy sawteeth and some He plasmas. In addition, data from several TFE pedestal and divertor experiments performed during the reversed toroidal field campaign have been included. The database contains average plasma and heating parameters, as well as specific sawtooth characteristics.
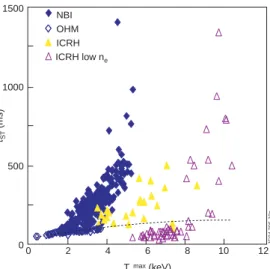
Figure 3.3 shows a comparison of the sawtooth period versus the central electron temperature obtained for NBI heating with the usual JET BT and Ip polarity (co-NBI) and with reversed BT and Ip (counter-NBI). For co-NBI, the sawtooth period scales with Te1.7. This is not found for counter-NBI. The comparison confirms that sawtooth periods are generally smaller with counter-NBI for similar central Te. Therefore tokamak operation with counter-NBI is an effective way to control the sawtooth period in H-mode as well as in L-H-mode plasmas. Figure 3.4 presents a plot of the sawtooth period versus the central electron temperature for NBI as well as ICRH discharges in the normal BT and IP operation. The open triangle symbols correspond to an interesting low density regime with ICRH that shows small sawteeth, referred to as the “grassy” sawtooth. Although auxiliary heating has been associated with sawtooth stabilization leading to large sawtooth periods, these figures clearly show that with either ICRH or with NBI heating there are regimes of operation where sawtooth periods shorter than in Ohmic plasmas can be obtained.
100 0 1000 2 4 6 0 8 log τST (ms) Temax (keV) JG03.550-1c NBI (Normal Bt) :τST ∝ Te1.7 OHM (Normal Bt) :τST ∝ Te0.4 NBI (Normal Bt) OHM (Normal Bt) NBI (Reverse Bt) OHM (Reverse Bt)
Figure 3.3 – A comparison of sawtooth periods with co-NBI (in solid blue kytes) and counter-NBI (red solid squares).
3.3.4. Validation of q-profiles in JET optimised shear discharges
A comparison of values obtained MHD analysis and q-profiles determined from EFIT with MSE measurements was performed for a set of discharges from the Trace Tritium Experiment (TTE). Alfvén Eigenmode (AE) cascades with frequencies ranging from 100-250 kHz can be identified with spectrograms from microwave signals in interferometry mode, as well as from magnetic signals.
0 500 1000 1500 0 2 4 6 8 10 1 Temax (keV) NBI OHM ICRH ICRH low ne 2 τST (ms) JG04.206-10c
Figure 3.4 – A comparison of sawtooth periods in low-density ICRH pulses (open symbols) with observations in high density ICRH plasmas (solid yellow triangles) and NBI heated plasmas (blue solid kites).
In the case of reversed shear plasmas, the Alfvén cascades are used to determine the minimum of the safety factor
(qmin).
The frequency pattern of the AE cascades reflects the time evolution of the Alfvén continuum at the location of
qmin which is linked to the frequency of the eigenmode
located at that surface. Measurements performed using the reflectometer diagnostic were able to detect eigenmodes with high toroidal mode numbers allowing more accurate
determination of the (qmin) than with the magnetic
diagnostic.
Figure 3.5 presents an example of q profile validation for a TTE discharge using MHD mode analysis. For the time shown, the AE analysis revealed a non-integer
qmin~2.7-2.8. A snake with mode number m=3, n=1
indicated the presence of a integer q=3 surface. Figure 3.5 shows EFIT reconstructions of the q-profile with different fitting constraints. The EFIT reconstruction with magnetic data only (curve 1) is monotonic. Only the MSE data detects the current hole, however, the equilibrium reconstruction with MSE constrains shows a very large uncertainty in the plasma core. Clearly the MHD analysis is an important guide in selecting the optimum curvature of the fitted profiles.
3.3.5. Documentation of JET diagnostics for analysis of fluctuations
A set of fast magnetic pick-up coils was designed for high frequency MHD activity studies (up to 500 kHz). determination. A new data collection system (named KC1M) has been commissioned in 2004, allowing the magnetic signals to be recorded at 2 MHz for up to 32 s in each pulse. The system will be be enlarged to 32 magnetic MHD signals and 32 other selectable fast diagnostic signals
in 2005. The ECE, SXR and O-mode reflectometer diagnostic measurements permit the identification of low amplitude, core MHD modes not measured by the external magnetic pick-up coils.
1 2 3 4 5 2.0 2.5 3.0 3.5 4.0 q R (m) JG04.73-11c t = 5.4s snake 1 2 3 AEs qmin Pulse No: 61350
Figure 3.5 - q profile from EFIT with different boundary conditions: (1) magnetics only, (2) and (3) with magnetics and MSE data, fitting MSE data approximately (2) or very closely (3). Indicated in the figure is the estimated qmin from AE
cascade analysis and the radius of q=3 obtained from the snake.
3.3.6. Stability domains for the internal kink mode Fishbone and sawtooth activity are caused by different branches of the solution of the dispersion relation for the internal kink mode. The activity of these instabilities is governed mainly by three parameters, the growth rate of
the ideal internal kink mode, γI =−ωAδWMHD,
the diamagnetic frequency
ω
∗i and the fast ions betaβ
h.Following trends in the space of parameters (γI,ω∗i,βh),
changes on sawtooth or fishbone activity occur when lines separating different stability regions for the internal kink mode are crossed.
To determine the stability domains for each instability in the space of parameters it is necessary to solve the marginal equation corresponding to the dispersion relation for the internal kink mode. The marginal equation produces two solutions if the ideal growth rate
is below a maximum value γI=
γ
M. The diagramcontaining these solutions in the space of parameters is presented in Figure 3.6 (red lines). It includes a
(horizontal brown) line γI =ω*i/2 that indicates when
the kink branch is stabilized by diamagnetic effects and to complete the stability regions, lines traducing resistive
effects (at low values of
γ
I) and finite orbit width effects3.3.6.1. Fishbones cycle
Low-frequency (diamagnetic) fishbones are usually observed for low values of the fast ions beta while high-frequency (precessional) fishbones are observed only for high values of β . For intermediate values of h β no h fishbones are observed since it falls in the stable triangle of Figure 3.6. In recent experiments carried out with low-density plasmas, a new type of fishbones was observed.
h
β
Figure 3.6 - Stability regions for the different branches of the internal kink mode in the space of parameters (the diamagnetic frequency determines the location of the red and brown lines). In the regions labelled with K, I and F the kink, ion and fishbone branches responsible for respectively sawteeth, low-frequency fishbones and high-frequency fishbones are unstables. For γI >γM
the low-frequency and high-frequency branches coalesce (region labelled with C).
These fishbones ranged all the way from high frequencies to low frequencies having characteristics of both diamagnetic and precessional fishbones, reason why were called hybrid fishbones. The fishbone behaviour was also observed to evolve during a sawteeth free period from high-frequency fishbones to low-high-frequency fishbones (Figure 3.7). Each hybrid fishbone corresponds to a single burst (Figure 3.8).
Figure 3.7 - Spectrogram of MHD activity for pulse #54301 showing the evolution of fishbone behaviour between sawtooth crashes. 49.50 49.52 49.54 49.56 49.58 49.60 49.62 time (s) -4000 -2000 0 2000 4000
Figure 3.8 – Bursts of hybrid fishbones
At some point, hybrid fishbones begin chirping down only for a small range of frequencies becoming precessional fishbones and at the same time diamagnetic fishbones appear in the low frequencies. A new stage is reached where low amplitude bursts of both types of fishbones can be observed simultaneously. This occurs just before t=49.8 s. The precessional fishbones progressively disappear until only diamagnetic fishbones remain. A monster sawtooth crash occurs just after t=49.91 s and the fishbone activity is suppressed, but after a short time (t=50.0 s) precessional fishbones reappear.
I
γ
3.3.6.2. Hybrid fishbones generating mechanism
The mechanism that produces this newly observed type of fishbones can be explained using the variational formalism.
The diamagnetic frequency (ω ) is mainly determined ∗i by the radial gradient of the background ions’ pressure, so this means that when sawteeth are stabilized by fast ion effects, both γ and I ω increase. The effect of this ∗i
increase in ω over the stability diagram of Figure 3.9 is ∗i that the brown line (γI=ω∗i 2) drifts upward and at the same time the green line (γI =γM) drifts downward. In these experiments the condition γI<ω∗i 2 was reached first but the system remains in the same region of Figure 3.9 and only precessional fishbones are still observed.
I
γ
βh
Figure 3.9 - Stability regions for the internal kink mode. In the regions labelled with K, I and F the kink, ion and fishbone branches are unstable. In the regions labelled with C:I-F and C:K-F the ion-fishbone and kink fishbone modes are unstable. The cross represents the state of the plasma when hybrid fishbones are observed.
After that, ω continues to increase and at some point the ∗i > condition γI γ ew source of energy rela e M is also reached. When this happens, the fishbone branch coalesces with the ion branch and a new region in the stability diagram is accessed (Figure 3.10).
The ion-fishbone branch is always unstable and, for a given value of ω , behaves like the fishbone branch for h*i igh values of βh and like the ion branch for lower values of βh.
If βh is high enough when a fishbone burst is triggered, it
begins as a precessional burst. During the burst fast particles are expelled from the plasma core and βh decreases
significantly. Thus, it is possible that βh reaches values
small enough for the mode behaviour change to that of a diamagnetic fishbone (Figure 3.10).
The result is that the fishbone that started as a precessional fishbone, accesses a n
ted to the bulk ions, that allows the amplitude of the oscillations to grow again, now with the characteristics of a diamagnetic fishbone with much slower oscillations in B&~θ (Figure 3.11). This mechanism produces hybrid fishbon s which can only be observed when the coalescent ion-fishbone mode is unstable.
Figure 3.10 - Schematic diagram of the solution of the dispersion relation including diamagnetic and fast ion effects. The smaller arrow indicates the evolution of the mode behaviour during a hybrid burst, as fast ions are expelled from the plasma core and βh
decreases. 52.5500 52.5510 52.5520 52.5530 52.5540 52.5550 time (s) -3000 -2000 -1000 0 1000 2000 3000
Figure 3.11 - Temporal evolution of for the hybrid fishbone in pulse #54300.
ra
ET inner wall limited plasmas in
θ
B&
~
3.3.7. Limiter H-mode studies in JET
Confinement transitions with the cha cteristics of H-mode were observed in J
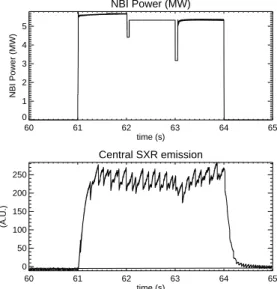
experiments performed at magnetic field of 0.8 T and at a current of 0.9 MA, using 5 MW of auxiliary heating power. The NBI heating is switched on for a period of 3 seconds (Figure 3.12), which is sufficient to achieve quasi steady state, given that both the overall energy confinement time and the beam slowing down time in these discharges are less than 200 ms. During this period several abrupt transitions in confinement are observed, which are characterised by a significant decrease in the alpha emission (Figure 3.13). However, limiter H-modes in JET are short lived (<20ms) and they are terminated by a burst of magnetic fluctuations with very similar characteristics to those of ELMs. The onset of the good confinement period is caused by a reduction in micro-turbulent transport very close to the plasma edge. On the other hand the termination of the period of good confinement has a clear magnetic signature, most likely caused by an edge instability driven by the steep pressure or current profiles. NBI Power (MW) 60 61 62 63 64 65 time (s) 0 1 2 3 4 5 NBI Power (MW) Central SXR emission 60 61 62 63 64 65 time (s) 0 50 100 150 200 250 (A.U.)
Figure 3.12 - Time evolution of NBI power for the limiter discharge #60908 and the central soft x-rays emission showing the Sawtooth.
JET deuterium plasmas AEs were found to be unstable in JET limiter plasmas
NBI. 3.3.8. Evidence of fast ion redistribution during fishbones from TAE in
T
with Bt = 0.8 T and Ip = 0.9 MA. TAEs and large amplitude fishbones were destabilised by 5 MW of TAEs with toroidal mode numbers n=4, 5 and 6 were seen in the absence of fishbones, while n=2 and 3 TAEs appear in the presence of fishbones (Figures 3.14 and 3.15). This observation is consistent with a fishbone localised mainly inside q=1 redistributing fast ions and providing a steeper dpbeam/dr outside q=1. A steeper dpbeam/dr outside q=1 destabilises TAEs with lower n.
D(alpha) light emission 63.15 63.20 63.25 63.30 0.10 0.15 0.20 0.25 0.30 0.35 (A.U)
Line integrated electron density
63.16 63.18 63.20 63.22 63.24 63.26 63.28 time (s) 15 16 17 18 19 x10 18 m -2
Figure 3.13 - D-alpha light emission and edge density (microwave interferometer) evolution during the H-mode transitions.
63.75 63.80 63.85 63.90 63.95 64.00 time (s) 50 60 70 80 90 100 110 frequency (kHz) n=2 n=3 n=4 n=5 n=6 n=7
Time of Fishbone Bursts TAE modes
Figure 3.14 - TAE mode spectrum with different toroidal mode numbers (n), during the fishbone bursts.
ium gas puff was used study the transport of a formance ELMy H-3.3.9. Tritium transport studies
3.3.9.1. Modelling Tritium penetration n recent JET campaigns, “trace” trit I
in high performance discharges, to hydrogen isotope particle in high per mode plasmas.
To model the trace tritium penetration, a 1.5D transport code JETTO was used. Tritium, being a minority species, is considered as low Z impurity for the neo-classical transport. NCLASS code was used for the neo-classical diffusion and convective velocity. For the anomalous particle diffusion the empirical model Bohm/GyroBohm was considered. For the anomalous convective velocity two theory motivated models are used in JETTO. This velocity is dependent on the magnetic shear or/and temperature gradient/Tritium boundary values. 0 20 40 60 80 100 Frequency (kHz) 101 102 103 104 105 Amplitude (A.U.)
Between Fishbones Bursts During Fishbones Bursts
Fishbones Bursts n=2
n=3n=4
n=5 TAE modes
Figure 3.15 - TAE mode spectrum with different toroidal mode numbers (n), during the fishbone bursts and in between the
shbone bursts.
he plasma core, two different time ependent tritium density boundary conditions were used at
the neutron yield reaches its ma
plates. The best we can do i o study
how ith r
mp. The rec fi
To observe the effect of the influx of tritons to its penetration to t
d
the last closed flux surface: (i) a constant value of nT(a) = 5×10¹⁵ m3
; (ii) varying from nT(a) = 5×10¹⁵ m-3 up to nT(a) = 3×10¹⁸ m-3. During the tritium puff this boundary was decreased to its initial value 500 ms after the puff. In these simulations the plasma has been considered to be completely neo-classic without any anomalous contribution.
Figure 3.16 shows the results from the simulation. It is clear that the time between the starting of the gas puffing and the time that
ximum, at the edge and the core channels, is longer for the simulation with non-constant boundary tritium density. The difference in the level of the reaction rate is also obvious for the case with a higher boundary density. The higher the tritium densities at the last closed flux surface, the lower is the out flux of particles (or even reverses the sign of the particle flux from positive to negative), keeping the tritium particles in the plasma core for a longer time.
The recycling (or reflection) coefficient RTT is the
least known parameter, which depends on the status of
the wall and target s t
sensitive is the result of our simulation w espect to a variation between 0≤RTT ≤0.9 that is, R=0.0, R=0.5 and R=0.9. Figure 3.17 presents an increase of the neutron yield in all the plasma with the recycling and a smoothing of the initial ra ycling change the tritium penetration by longer time to peak of the neutron yield and longer decaying time after it reaches its maximum. This is because there is a larger number of tritium particles that return back to the plasma, in other words the tritium stay longer inside of the plasma core. R = 0.5 leads the closet result to the experimental data.
Figure 3.16 - Neutron yields horizontal camera for the edge channel (channel 1) and in the core channel (channel 4) for the two different time evolution of the tritium density at the last closed flux surface: a constant value of nT(a) = 5×10¹⁵ m-3 (in blue) and
varied boundary with the maximum value of nT(a) = 3×10¹⁶ m-3 (in
red), the experimental neutron yield for the pulse no. 61119 (in black).
Figure 3.17 - Neutron yields horizontal camera for the edge channel (channel 1) and in the core channel (channel 4) for the
ree different recycling values: R = 0.0 (in blue), R = 0.5 (in red)
impurities it was shown that the neo-elocity for impurities changes sign e to negative when the edge deuterium
s neo-classical ditional anomalous contribution with
d that the higher is the plasma density the sport is to the neoclassical values. transport for pulses with ICRH
NTM were observed: (i) as a (3,2) tearing mode th
and R = 0.9 (in purple).
3.3.9.2. Transport (i) The ETB In recent work with classical convective v from positiv
density falls below the critical value. To take this effect into account, three different boundary values for the deuterium density have been prescribed. The neo-classical diffusion does not change significantly within the ETB for the different simulations. On the other hand the neo-classical convective velocity changes dramatically with the density gradient. The velocity is positive for the lower density gradient and it becomes negative for the higher density gradients.
(ii) The core
hree di tritium diffusion profile T fferent
and two with ad
different values of the anomalous multipliers of cT = 0.5 and cT = 1.0 were used to study the influence of the anomalous diffusion in the tritium penetration. It was found in the time to peak of the integrated neutron yield. The biggest difference was observed in the core channel. The time difference between the neo-classical diffusion and the highest level of the anomalous diffusion was around ∆t≅200 ms. The neutron yield decay after it reaches the maximum is also faster for the highest diffusion.
(iii)Power deposition. It was foun
closer the tritium tran Nevertheless the tritium
had a higher anomalous contribution than the ones with NBI only. For example, in two consecutive JET pulses #61119 described above (Figure 3.17) and #61118 with 10.5 MW of NBI and 2.5 MW ICRH. The latter pulse had a higher density and lower temperatures but the best values of the anomalous transport coefficients for the particle diffusion and convective velocity were cT = 1.0 and cTq = 1.7 comparatively, with #61119 that was cT = 0.5 and cTq = 0.0. In these simulations only the NBI power deposition was considered. But simulations with the PION code demonstrated that the power is not going all to the electrons but mainly to the ions due to synergy effects. The results for different power deposition profiles are plotted in Figure 3.18 and it clearly indicates that the influence of ICRH should be taken into account, even when the power is low.
3.3.10. Neoclassic Tearing Modes (NTM) in hybrid regime
3.3.10.1. Triggering processes
In JET hybrid scenarios (HS) three types of triggering for the (3,2)
that started during the L-mode phase; (ii) during H-mode and in the presence of (1,1) modes; (iii) spontaneously during H-mode. During the L-mode, the collisionality regime is in the Pfirsch-Schlüter. In this regime the boostrap current is small and so the (3,2) mode can only be current driven and it is therefore probably triggered when the stability parameter ∆’ is positive. The (3,2) mode becomes a NTM after the L to H-mode transition when the bootstrap current is significant. For the spontaneous NTMs, the (3,2) island growth rate was exponential, similar to those observed in low βN plasmas where the onset coincides with the first sawtooth crash after the L to H transition.
Figure 3.18 - a) Power deposition profile used in the simulations; b) the respective results and the experimental neutron yield for the
ulse no. 61118.
either the fishbone nor the sawtooth were bserved and for these pulses q(0) > 1 was assumed. In all these pulses a (3,2) NTM was triggered. In the pulses, in
wh
p
The total number of pulses in the HS database was 48. In half of them n
o
ich the (3,2) NTM was triggered spontaneously the shear is small at q = 1.5. In the other half of the pulses from the HS database (Figure 3.19), the q(0) ≤ 1 was assumed when, at least the fishbone instabilities were observed. In 12 of these pulses the (3,2) NTM was not observed but the sawtooth and the fishbone instabilities were present.
Figure 3.19 - Number of JET pulses in the hybrid scenario database for different types of (3,2) triggering
i) Energy confinement
he (3,2) NTM nset. The decrease in energy confinement is much lower
ent
re (i
In positive shear plasmas a reduction typically of 10-20 % in energy content is observed after t
o
for HS pulses (≤ 5%) the increase of confinem degradation with βN is also lower. A possible explanation is the island width that is in average around 2 to 6 cm.
The island width is proportional to the square root of the magnetic perturbation for a constant shear and radius of the resonance surface. The island width is not only perturbed by the ELMs but also by the (4,3) NTM. Figu 3.20 shows that after the disappearance of (4,3) NTM, the (3,2) NTM grows to a saturated width and the core ion temperature decreases more than the core electron temperature.
Figure 3.20 - Mode amplitude for the (3,2) NTM (blue), the amplitude of the (4,3) NTM for comparison (pink); electron temperature at R = 3.2 (brown); ion temperature at R = 3.14 (green) for the pulse # 60926.
3.3.11. Time–frequency analysis of nonstationary fusion plasma signals: comparison between the Choi –Williams distribution and wavelets
ecently, the Choi–Wil
R liams distribution has been
rons (REs) in large tokamaks.
n JET effectively used to analyze nonstationary phenomena in fusion plasmas for which the spectrogram did not produce the best possible result. In principle, the Choi–Williams distribution is superior to wavelets, as it can yield excellent time–frequency resolution. Here, the advantages of using the Choi–Williams are shown using real fusion plasma signals. The comparison is for phenomena in JET, such as sawtooth (ST) crashes and neoclassical tearing modes (NTM) in discharges with ion cyclotron resonant heating (ICRH), and Alfvén cascades. In Figure 3.21, a ST crash appears as a broadband event at 60.6095 s, along with several modes including the (m =3, n =2) NTM at 5 kHz. In such a dis-charge with low βN and ICRH, NTM may start with, or after
the ST crash. So, good time–resolution is required. The time resolution of the spectrogram is not quite satisfactory, the region around the ST crash appearing blurred. The dependency of the time resolution of the scalogram on frequency is evident. In this case, for which good time resolution is important at all frequencies, the scalogram actually gives a worse representation than the spectrogram. The Choi–Williams distribution represents the modes and the ST crash with better time resolution than the spectrogram and the scalogram, although higher frequency modes appear somewhat masked by artifacts.
Using the Choi–Williams distribution is advantageous if the spectrogram fails to produce acceptable results, as long as the signal structure is not too complex, that is, with too many modes too close together in the time–frequency plane, so that artifacts can be adequately reduced. Wavelets, on the other hand, although sometimes improving upon the spectrogram, are unable to render sharp time–frequency representations as those produced by the Choi–Williams distribution.
3.3.12. Disruptions and runaway electrons in JET Experiments and concurrent numerical modelling provided further contributions to the model for disruption generated runaway elect
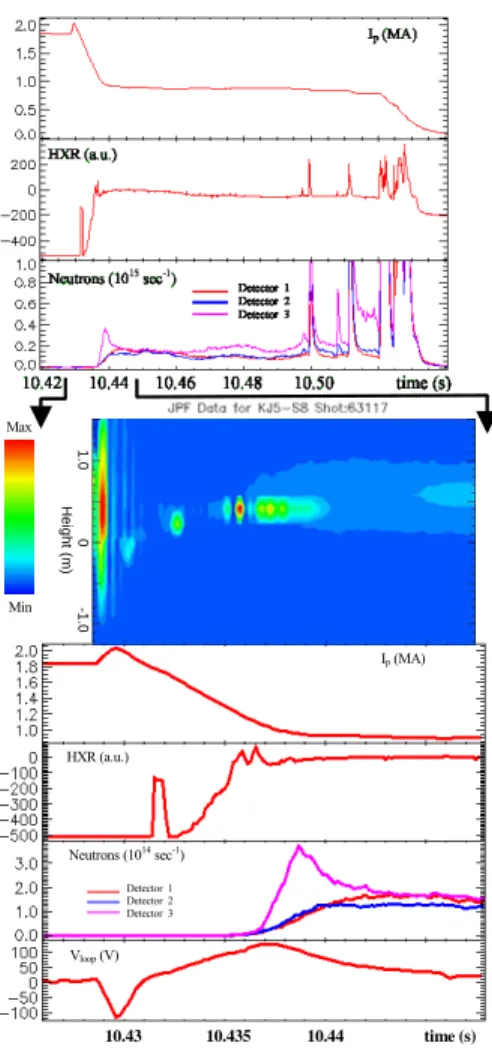
Limiter configuration with low elongated plasmas i enabled more stable behaviour of the runaway beams during and after disruptions resulting in long-lived runaway current plateaux (Figure 3.22). Interacting with cold post-disruption plasma RE beam produces detectable soft X-ray radiation providing information on evolution of runaway current-carrying channel in time and space. This data has been used in numerical modelling of the runaway process during disruptions.
A set of equations for the electron momenta (normalized to mec) together with evolution of runaway electron density
has been solved at the initial conditions being inferred from the experimental data (plasma current, density, etc).
Figure 3.21 - Analysis of a magnetic pickup coil signal (JET pulse 50668), using (a) the spectrogram, (b) the scalogram, and (c) the Choi–Williams distribution.
pre-disruption plasma urrents. Calculations yield the values of post-disruption lectron temperature T ≅ 10-15 eV at given plasma ind
Experimental values of τ (characteristic current decay time) are concentrated in a range between 10 and 20 ms over a wide variation of the
c
e e
uctance Lp ≅ 4.5⋅10-6 H. With these Te values the numerical modelling provided close agreement between evolutions of the measured plasma current in disruption #63117 and total calculated current, which consists of two fractions: calculated runaway current (IRE) and exponentially decayed resistive part (Figure 3.23(a)). Numerical simulations also show that the secondary avalanching process causes the dominating part of the disruption generated runaway electrons (Figure 3.23(b)). Depending on the initial conditions the current densities being inferred from calculated nRE can achieve values up
1 .0 0 -1 .0 He ig h t ( m ) Neutrons (1014 sec-1) 10.43 10.435 10.44 time (s) Ip (MA) HXR (a.u.) Vloop (V) Detector 1 Detector 2 Detector 3 Max Min
Figure 3.22 - Long-lived runaway electron beam generated at disruption #63117. Plasma currents (Ip), photo-neutron emission
eutrons), Hard X-ray (HXR) and loop voltage (Vloop) signals are
tum space and temporal evolution of RE density ave been modelled in assumption that cross-section of RE cur
modelling Th recent JET trace tritium campaign allowed us to study
le (N
compared to the evolution of the soft X-ray emission (in arbitrary units).
The evolution of the test runaway electron in a momen
h
rent-carrying channel might have different size during current quench phase. Increase of RE current (as a result of larger beam cross-section) at other equal initial plasma and runaway generation parameters decreases the maximal RE densities and energies. Note, that close correspondence of the modelled and measured currents in Figure 3.23(a) has been obtained if the evolution of the cross-section size of RE current-carrying channel (as estimated from soft X-ray measurements) has been taken into account.
3.3.13. Effects of large magnetic islands on particle confinement trace-tritium studies–TRANSP
e
the effects of large magnetic islands induced by neo-classical tearing modes (NTMs) on tritium (T) partic transport. These kind of discharges are generally correlated
a
b
Figure 3.23 - Comparison of the measured plasma current to the calculated total current (RE current+plasma resistive current) at exponential decay of the resistive plasma current
e magnetic islands. To quantify these effects transport studies were
eV neutron emissivities obt
with characteristic time 0.01 sec (a). Calculated runaway electron density for primary only and for primary+avalanching mechanisms of runaway electron generation (b).
with an energy confinement degradation which could be related to the flattening the pressure around th
initiated using the suggested method proposed by the Task Force DT (TF-DT). Simulations with TRANSP were carried to estimate the two-dimensional profile of the neutron emissivity and the transport coefficients for neutrals, which are, then, used by the TF-DT to run the transport analysis package UTC. This code computes the T transport diffusion coefficient DT and the relative pinch velocity VT/DT that best fits the experimental observation of the 2.5 MeV (D-D) and 14 MeV (D-T) neutron emission along 19 lines of sight.
Two trace tritium pulses, with and without NTMs have been modeled. Figures 3.24 and 3.25 show two-dimensional profiles of the 14 M
ained by TRANSP for a given test T density profile. Similar simulations were done for each discharge for a set of 20 different T density profiles which are then used by UTC as a function basis for the T density. From the neutron emissivities given by TRANSP as a function of these T density profiles and the observable neutron emission, UTC estimates DT and VT/DT profiles. Preliminary results suggest that the presence of magnetic islands can increase the T diffusion (DT) in the plasma enclosed by the island and could reduce the T pinch velocity in the vicinity of the island (Figure 3.26).
However, since the majority of the 14 MeV neutron emission come from collisions between thermal T and D-beam, a more rigorous study requires further modeling because the effects of the magnetic island on the fast NBI ions were not yet taken into account.
Figure 3.24 - 14 MeV neutron emissivity contours for the pulse #61362 (no NTM) using the given T density profile
Figure 3.25 - 14 MeV neutron emissivity contours for the pulse #61359 (with NTM) using the given T density profile
-8 -12 -4 0 1.0 0.5 1.5 2.0 2.5 Pulse No: 61362 Pulse No: 61359 0 0.2 0.4 0.6 0.8 r/a JG04.207-10c NTM No NTM VT (m/s) DT (m 2/s)
Figure 3.26 – UTC transport results for DT and VT for pulses
#61362 (no NTM, black) and #61359 (with NTM, red)
.3.14. On the cross-correlation between parallel and 3
radial fluctuating velocities
The possible role of turbulence on the momentum re-distribution mechanisms in the plasma boundary region of tokamak plasmas was studied. Plasma profiles in the JET boundary plasma have been obtained using a fast reciprocating probe system that consists of arrays of Langmuir probes allowing the simultaneous investigation of the radial structure of fluctuations and parallel Mach numbers.
The contribution of the Reynolds stress term, d v M<%r %||>/dr , v% and r M%|| being the fluctuating (ExB)
the fluctuating parallel Mach number respectively, provides the mechanism to convert the turbulent scales (high frequency fluctuations) into a mean parallel flow. A comparison between the parallel flow profiles between forward and reversed field discharges is presented in Figure 3.27. In the forward field direction, (ion
radial velocity and
B×∇rB drift direction down towards the divertor), a strong parallel flow is measured at the top of the machine in the direction from the outer to the inner divertor. For reversed field, the measured flow is smaller but approximately symmetric with respect to a symmetry axis given by a positive offset. Figure 3.28 shows radial profiles of <v M%r %| |>obtained in forward and reversed field in the proximity of the LCFS in JET. In the plasma region wher floating potential becomes more negative (which turns out to be very close to the region where the perpendicular velocity shear is developed) there is evidence of significant radial gradients. It should be noted that the quadratic term of fluctuating velocities changes sign when the magnetic field is reversed.
e the 0 10 20 30 -0.1 0.0 0.1 0.2 0.3 0.4 #56843, Forward field #59753, revesed field Mach numbe r r-rLCFS (mm)
Figure 3.27 - Comparison of Mach number profiles between a forward and reversed toroidal field discharges in JET.
in the volution equation of the parallel flow requires a An estimate of the importance of turbulence e
comparison of d v M<%r %||>/dr with the magnitude of the parallel flows dam by different mechanisms. The radial derivative of v Mr ||
ped / driven
<% % > was computed near the shear layer being its value in excess of 5x10³ s-1 both in
forward and reversed field JET tokamak. This result implies that, in the framework of our limited data base, the transport related momentum source (
in the
||
e i r
n m d v v< % % > dr
ysis of force balanc ) will be in the range of 1 – 5 N/m3 in the JET boundary region, comparable with previous anal e which indicate a momentum source at the level of 10 N/m3. Therefore, in the plasma edge, the Reynolds stress seems capable of sustaining a non- negligible parallel velocity.
This mechanism might be an ingredient to explain recent observations in Alcator C-mod showing that the toroidal momentum propagates in from the plasma edge, without any external source involvement. This mechanism can be particularly relevant during the L-H transition where the level of turbulence is mainly reduced near the edge. Then, radial gradients in the level of turbulence might develop, allowing a momentum redistribution (driven by internal-turbulent forces). 0 10 20 30 0 10 20 30 40 50 JET #56843 <M || vr > ( m s -1 ) r-rLCFS (mm) 0 10 20 30 -15 -10 -5 0 <v r M|| > (ms -1 ) r-rLCFS (mm)
JET #59753, Reversed field
0 10 20 30 0 10 20 30 40 50 JET #56843 <M || vr > ( m s -1 ) r-rLCFS (mm) 0 10 20 30 -15 -10 -5 0 <v r M|| > (ms -1 ) r-rLCFS (mm)
JET #59753, Reversed field
Figure 3.28 - Radial profiles of the cross-correlation between parallel and radial fluctuating velocities in JET L-mode plasmas
d
new reciprocating probe head has been designed to study e rather
ence. Both the poloidal and parallel components of the
near the LCFS in forward and reverse field discharges
.3.15. Design of a new reciprocating probe hea 3
A
momentum transport (Figure 3.29). The probe will b
compact allowing the simultaneous measurement of the parallel flow at two radially separated positions, the radial and poloidal velocities and the fluctuations induced particle flux.
Concerning physics goals for the probe, the emphasis will be on the momentum re-distribution mechanisms driven by turbul
momentum can be measured as well as the energy transfer between turbulence and parallel flows. The probe will also allow the continuation of the investigation in the dynamical relation between transport, radial electric fields, parallel flows and gradients.
Figure 3.29 – Schematic illustration of the new turbulent transport probe head
.3.16.1. ELMs studies
eter (KG8b diagnostic) has been carried out. s (which generally probe the
wer hybrid current drive experiments have been urements from the KG8b 3.3.16. Exploitation of the microwave reflectometry systems
3
A study of the ELM activity using an X-mode correlation reflectom
The 76-78 GHz channel
plasma edge region) are quite sensitive to the ELM activity (Figure 3.30). A drop of the signal amplitude as well as a significant increase of the fluctuations of the signal phase is observed during the ELMs. This result highlights that the loss of confinement during the ELMs is coupled with an increase of the turbulence. This is confirmed by the correlation reflectometry measurements on the bottom of the figure, which point out a significant drop of the correlation between the phases of two reflected signals at close frequencies, during the ELMs. 3.3.16.2. Turbulence studies
Spectral broadening induced by parametric instability in lo
studied. Reflectometry meas
diagnostic showed an enhancement of the density fluctuation spectrum in the plasma edge region during the phase of injection of LHCD power. After the LHCD is switched on, a broadening of the spectrum of the reflected signal is observed (Figure 3.31).
Figure 3.30 – Effects of type I ELMs on the X-mode correlation reflectometer data. From the top to the bottom: (a) Emission Dα displaying the ELM occurrence; (b) Amplitude of the reflected signal; (c) Averaged level of phase fluctuations of the reflected signal; (d) Spectrogram of the reflected signal phase; (e) Correlation between the reflected signal phases at two close frequencies (76 and 76.9 GHz)
Figure 3.32 – Reduction of plasma turbulence in the ITB region observed from a reflectometry signal at fixed frequency 39.6 GHz. From the top to the bottom: (a) Raw reflected signal (b) Radial position of the cut-off layer (c) Averaged level of the reflected signal fluctuations (d) Spectrogram of the reflected signal.
3.4. PERFORMANCE ENHANCEMENTS 3.4.1. Introduction
IST/CFN was responsible in 2004 for four tasks of the JET Enhanced Performance Project:
o Mw Access-Project Management and Implemen-tation;
o MPR-Project Design and Procurement Activities2; o TOF-Project Design and Procurement Activities2; o RTP-Development Real-time Test Facility.
Concerning the Mw access – Project: management and implementation, Dr. Luis Cupido has assured the coordination of the project, including the supervision of the commercial contracts. Test and measurement activities of the antenna cluster have been also carried out (Figure 3.33).
Figure 3.31 – Effect of the LHCD reflectometry sig
he link between turbulence and plasma rotation is being inv
heating on a nal
of fixed frequency 76 GHz probing the plasma edge region. T
estigated. A significant reduction of the turbulence was noticed when the cut-off layer of the reflectometry probing signal explores the ITB region associated with large negative poloidal velocity vθ of plasma rotation. The
spectrogram obtained from a sliding FFT of a reflected signal displays a reduction of signal fluctuations when the cut-off layer moves inner in the plasma where the ITB forms (Figure 3.32).
Figure 3.33 – MWA antennas delivered to JET in September 2004.
Regarding the development real-time test facility, transition from the initial design based on a System-On-Chip approach to a PC based system has been made. The schematic and layout design of the waveform generator (WG) PCI module prototype have been performed. One WG prototype board has been assembled and tested. Four final WG modules have been commissioned and tested. Firmware codes have been written for the development of the programmable logic devices, including the design, simulation and test of a CIC interpolator filter and sharpening FIR filter, both programmable in real-time. The low-level Digital Signal Processor (DSP) software has been implemented. A code for interfacing with the ATM real-time network has been developed. A complete PC based system with four waveform generator modules has been assembled. The Linux based control software, the Application Programming Interface (API) and the MDSPlus interface software have been developed.
Concerning the MPR-Project: design and procurement activities and the TOF-Project: design and procurement activities, two prototypes of the time digitizer (TD) module have been assembled and tested (Figure 3.34). A Matlab® data analysis program for automatic detection of functional and performance errors on TR has been developed. Six plus two spare TR boards as well as three TD boards have been assembled and tested at IST and sent to the Swedish EURATOM Association for integration on the MPRu and TOFOR diagnostics. The modules control and test software both for the Windows and Linux OS have been completed. Software and hardware manuals have been finished. IST/CFN staff has collaborate with VR on the integration of the modules in the diagnostics.
3.4.2. Real-time test facility
The test-bench system provides an analogue or digital replica of signals stored in a database, to generate stimulus for real-time control and data acquisition tools under test.
The on-site developed system (Figure 3.35), incorporating four DAC PCI modules, provides 32 analogue channels and one ATM link with the following main characteristics: (i) 32 analogue output channels with 16 bits resolution at up to 50 MSPS sampling rate; (ii) ±10 V output range on 600 Ω output impedance; (iii) 2 GByte of real-time signal storage capacity; (iv) includes four TMS320C6415 DSPs and four XC2V1500 FPGAs for real-time signal processing; (v) one full-duplex ATM optical port with 155 Mbps of transfer rate.
The software developed for the test-bench allows the integration with the JET MDSplus signal database server as well as with the Web server based Level-1 control interface with JET CODAS.
Figure 3.35 - Test-bench system.
4. PARTICIPATION IN THE ASDEX UPGRADE PROGRAMME1
M.E. Manso and F. Serra (Heads), D. Borba, R. Coelho, L. Cupido, L. Fattorini, R. Galvão, S. Graça, L. Meneses, I. Nunes, V. Plyusnin, T. Ribeiro, F. Salzedas, J. Santos, A. Silva, F. Silva, P. Varela.
1 Work carried out in collaboration with the ASDEX-Upgrade Team. Contact Person: G. Conway. 4.1. INTRODUCTION
The Portuguese participation in the ASDEX Upgrade2 (AUG) programme has been mainly focused in two research lines:
• Microwave reflectometry; • MHD, turbulence and transport.
4.2. MICROWAVE REFLECTOMETRY 4.2.1. Introduction
This research line included in 2004 activities on microwave systems and electronics, control and data acquisition, data processing, diagnostic developments, modelling and plasma physics studies.
Concerning microwave systems and electronics, a new active frequency multiplier for the Q-band X-mode channel has been installed. A permanent marker switch has been implemented to provide dynamic calibration curves for all frequency sweeps every shot. All heterodyne channels have been tested and new IF filters with larger bandwidth have been installed for proper fast sweep operation. V-band X-mode channel was upgraded (new mixer and correction of default in antenna). Detailed dynamic frequency calibration circuit using a millimetre wave delay line (Figure 4.1) has been developed, to provide together with frequency markers a very accurate frequency calibration (Figure 4.2). A new in-vessel directional coupler at the Ka-band HFS channel has been installed, replacing the one damage by ECHR operation. New thermal and plasma protection for the waveguides (at LFS access port) were installed to avoid Halo currents in the waveguides. A vacuum window misalignment in the W-band LFS has been repaired.
Regarding control and data acquisition, control software of broadband channels has been optimized. It was modified after the installation of a new RS232 control boards to improve hardware control. New functionalities have been added to the broadband section: (i) new channels have been implemented to measure calibration signals; (ii) a logfile has been introduced to control eventual hardware faults; and (iii) software has been developed to switch on/off remotely each microwave source. Control software for a new “hopping” frequency system is being developed.
Concerning data processing, the burst mode data analysis for automatic density profile evaluation was validated with a 2D FDTD code. Software tools for automatic evaluation of the very edge ne-profile with X-mode have been developed.
Regarding diagnostic developments, a software tool to simulate O/X mode reflectometry has been developed. Results show that toroidal magnetic ripple plays a crucial role in X-mode reflectometry. A correction of the position of first plasma layer (derived from the first X-mode cutoff frequency) of about 1 cm was estimated. The reliability and accuracy of plasma position measurements has been assessed with a dedicated numerical workbench.
Concerning modelling, unidirectional transparent signal injection in electromagnetic codes has been modelled.
Physics studies on the impact of type I and type III ELMs on the plasma edge density, MHD and turbulence were carried out in 2004.
Figure 4.1 – Circuit for detailed dynamic frequency calibration using a millimetre wave delay line
0 200 400 600 800 1000 32 34 36 38 40 42 44 46 48 50
Q band calibration curve and markers
Sample number
F
req. [GHz]
Figure 4.2 – Dynamic frequency calibration curve 4.2.2. Numerical studies for plasma position
In order to test the robustness of position measurements to plasma turbulence, density perturbations were added to the ne-profiles: ∑ = ∆ + = n i i i e r a i k r n ( ) 1 cos( .
ϕ
)δ
(4.1)where ai and ϕi are, respectively, amplitude and phase of
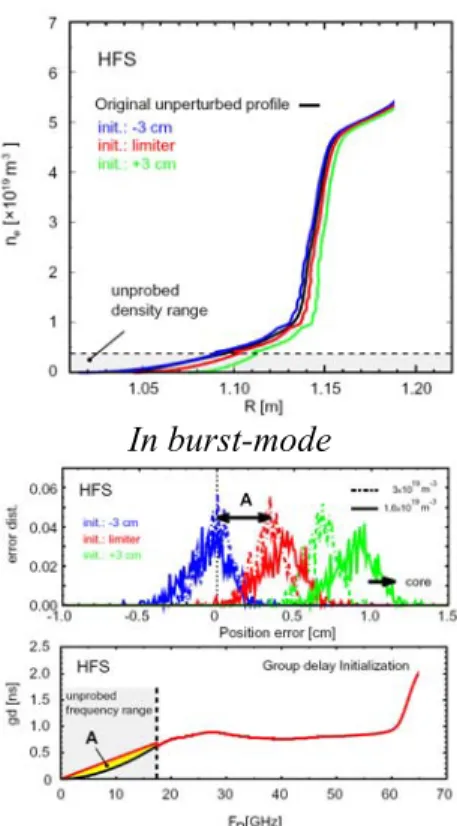
the density fluctuations with a wave number k=i∆k. Three levels of density fluctuations were investigated: rms amplitudes of 1.5%, 3%, and 5% of a density (^nsep=2x10¹⁹ m-3≈ 25% ne_med) slightly above the corrected
separatrix density found for this profile. The rms position errors at densities ne =1, 1.62 and 3x10¹⁹ m-3 were less than
5 mm for single sweep profiles while in burst mode
analysis (grouping of several sweep samples) were significantly reduced errrms<1-2 mm (Figure 4.4). Errors
also diminish for higher densities (ne = 3x10¹⁹ m-3,
errrms<1 mm) with burst mode analysis.
Three initial positions were simulated: the standard limiter, limiter-3 cm, and limiter+3 cm. Figure 4.3 shows the position errors at densities ne=1.6 and 3x10¹⁹m-3 for simulated profiles with 5% turbulence level using burst analysis (8 sweeps). The absolute errors are, in all cases, below 1 cm, and decrease for higher densities. In the LFS the errors are smaller than in the HFS due to the higher proximity to the limiter and to the steepness of the profiles.
4.2.3. Modelling3
A novel numerical signal injection technique has been developed allowing unidirectional injection of a wave in a wave-guiding structure, applicable to 2D finite-difference time-domain electromagnetic codes, both Maxwell and wave-equation. The reflected or backscattered waves (returned) are separated from the probing waves allowing direct access to the information on amplitude and phase of the returned wave (Figure 4.5). It also facilitates the signal processing used to extract the phase derivative (or group delay) when simulating radar systems.
a) b)
c)
Figure 4.3 – Position error for density layers 1.0, 1.6 and 3.0x10¹⁹ m-3 of LFS H-mode profile. Left: position error versus the number of
sweeps per burst. Three layers and three levels of simulated turbulence (1.5%, 3% and 5% of nsep) are considered. On the top right, the
position error distribution at density layer 1.6x10¹⁹ m-3 for 8 sweeps/burst and three levels of turbulence.