Computational tool for the energy efficiency assessment of cheese
industries - Case study of inner region of Portugal
D. Neves1, P.D. Gaspar1*, P.D. Silva1, L.P. Andrade2 and J. Nunes 2
1
University of Beira Interior, Electromechanical Engineering Department, 6200-001 Covilhã, Portugal.
2
Polytechnic Institute of Castelo Branco - School of Agriculture, 6001-909 Castelo Branco, Portugal.
*
Corresponding author: [email protected]
Abstract: Food processing and conservation represent decisive factors for the sustainability of the planet given the significant growth of the world population in the last decades. Therefore, the cooling of any food product has been subject of study and improvement in order to ensure the food supply with good quality and safety. A computational tool for the assessment of the energy performance of cheese industries that use refrigeration systems was developed. It aims to promote the improvement of the energy efficiency of this industrial sector. The computational tool for analysis of the energy profile is based on a set of characteristic parameters used for the development of correlations, including the amount of raw material, annual electrical energy consumption and volume of cold stores. In this paper, the developed computational tool was applied to companies in the dairy sector, specifically to cheese industries, subdivided into industrial and handmade cheese. The results obtained help on the decision making of practice measures for the improvement of the energy efficiency. Keywords: Computational tool, Energy efficiency, cheese industry, Cold storage.
1. Introduction
Worldwide, cheese is a major dairy food product (27%). It is preferred by consumers due to its nutritional value and organoleptic characteristics (wide range of flavours, textures, and forms). There are many types of cheese, with around 500 different varieties, classified into types according to different criteria. According to UN FAO [1], over 20 million metric tons of cheese were produced worldwide in 2011. This value corresponds to a consumption of about three kilograms of cheese per capita per year. The heating and cooling processes during the cheese production are indispensable technologies to ensure both the specific organoleptic characteristics and properties conservation through time. This paper characterizes the production process and the energy consumption of cheese industry in Portugal (31 industries) and discusses the average specific energy consumption (SEC) of electricity and its standard deviation. The average value of this indicator for this sample was 169 kWhe/m3 raw milk (handmade type) to 283 kWhe/m3 raw milk (industrial type).
Electricity consumption is about 63% of the total energy consumption, mainly for energy supply of refrigeration systems. Correlations have been developed that shows the relationships between volume of raw milk and electricity consumption, volume of cold stores, and compressors' nominal power [2]. Food processing and conservation represent decisive factors for the sustainability of the planet given the significant growth of the world population in the last decades. Therefore, the cooling of food products has been subject of study and improvements to ensure the food safety, controlling the quality of the cold during the process
of manufacture and storage. The demand of chilled and frozen food as increased substantially, which leads to new requirements for the efficiency of refrigeration systems [3]. Additionally, energy represents a factor of greatest importance not only for countries’ economy, but also for the well-being of its citizens. In 1971 there was a global electricity consumption of around 439 Mtone, and in 2010 this figure rose to 1536 Mtone [4]. This
increase is related to the population growth, being the industry responsible for about 35,2% of energy consumption worldwide in 2010. The energy consumed globally for the cooling process accounts for 15% of energy consumption worldwide [5]. Thus, it is important to develop studies and tools to improve the efficiency of these processes to improve the sustainability of this industrial sector. However, it should be noted the lack of studies or projects developed in this area, more specifically in the development of computational tools for the analysis of key points related to the cooling processes, such as the level of energy consumption or environmental impact, aiming the operational cost reduction of companies. One of the few studies developed with this objective is presented by Gogou et al. [6]. These authors describe the results of the FRISBEE (Food Refrigeration Innovations for Safety, Consumers Benefit, Environmental impact and Energy) project. It includes a software tool for the evaluation of quality, energy and environmental impact of the European cold chain [7]. In this same context, Foster et al. [8] and Evans et al. [9-10] describe the results of the ICE-E (Improving Cold Storage Equipment in Europe) project where tools were developed with the similar goals as the abovementioned one. This project is specifically related to the reduction of energy consumption and greenhouse gases emission from the refrigeration industry through the application of more efficient equipment and taking into account the energy and environmental standards of the EU [10]. Eden et al. [11] describes the results of the CHILL-ON project focused mainly on the analysis of chilled products quality, mainly fish and birds, using a computational tool, QMRA (Quantitive Microbial Risk Assessment) [12]. Other tool, SLP (Shelf Life Predictor), estimates the risk of pathogens growth based on temperature and chemical and nutritional characteristics of food. Additionally, traceability tools of food products are developed using TTIs (Time Temperature Integrators) combined with RFID (Radio Frequency Identification) technology.
2. Assessment of energy performance in Portuguese industries
The abovementioned research included the development of computational tools aimed to improve the energy efficiency of cold rooms. Although, Portuguese companies had not been included in the databases. In this context, a research was conducted in Portugal for the identification of profiles of energy consumption in the agrifood industry. Additionally, it aimed the promotion and development of actions that contribute to a real improvement of energy efficiency and to the competitiveness of this sector. The work presented in this paper is part of a research activity and its main objective concerns the development of an analysis algorithm and its implementation on a free use computational tool. This tool supports strategic decisions in the companies through the prediction of their energy performance and points practice measure that lead to an effective improvement of energy efficiency. Note that this research instead of performing a general energy characterization of cold stores does it by sector: meat, fish, dairy, horticultural (fruit and vegetables), wine and vineyard and distribution in order to obtain real data that can be inserted in the model/algorithm.
The Portuguese economy is characterized by a large number of small and medium enterprises (around 1112000) that provide employment to about 78.5% of the employed population (data from 2011) [13]. Furthermore, according to the Organization for Economic
Cooperation Development (OECD), Portugal was considered in 2005 as one of the countries whose population had fewer qualifications, being positioned at the same level as Brazil and Turkey. The study surveyed individuals between 25 and 65 years of age belonging to the labour force, and 59% of them had qualifications below the sixth grade. In contrast, Denmark was only 1%. This situation was taken into account in the development of computational tools, given the lack of literary skills of part of the Portuguese population. Thus, the computational tool created is extremely simple, intuitive and easy to understand in order to be accessible to all people in the agrifood industry regardless their qualifications. After an intensive collection of field data on the characteristics of a sample of companies, analytical correlations were developed based on the work of Nunes [14] and Nunes et al. [2, 15-16] to predict the average energy performance in the agrifood industry in Portugal. Correlations were developed making use of statistical tools. Cold stores are responsible for about 60-70% [17] of the total energy consumption in agrifood industry. Thus, the evaluation of the overall energy performance of a company in the agrifood sector provided by the tool regards significantly the electrical consumption of the refrigeration systems. Considering the correlations for different sectors of agrifood industry, the computational tool predicts the energy consumption of a particular company and compares it with the national average. Depending on the results, the tool also provides practice measures to improve the energy efficiency. Thus, it can be used on energy-decision making process. The tool presented in this study considers improvements on the tool developed by Santos et al. [18-19] and Neves et al. [20-22] and it contains the correlations for cheese (handmade and industrial production) industries located in the centre region of Portugal [14].
3. Computational tool for the prediction of energy performance
3.1 Overview
With the purpose of promoting an improvement of the energy performance in agrifood industries that use refrigeration, the computational tool named Cool-OP was developed using Matlab and its GUIDE (Graphical User Interface Design Environment). This performs the analysis of the behaviour of a set of characteristic parameters: amount raw material, annual energy consumption, and volume of cold roons. This computational tool was firstly developed for companies of meat (slaughterhouses, hams and sausages industries) and horticultural (fruit resale and fruit plants) industries, where it was validated with case studies [21-22]. Based on the available correlations for the dairy food sector, this computational was extended to the cheese industries. The GUIDE toolbox allows the creation of multiple windows that graphically illustrate the correlations results. The code was converted to an executable file that can run in any computer. It delivers to the user the current state of a company in terms of energy consumption and suggests practice measure to reduce it. As correlations were developed considering real values collected in companies, the range variation of each parameter to ensure valid predictions is fundamental (see Table 1).
Table 1. Application domain of each of the parameters of the computational tool.
Industry Raw Material [kl] Chambers volume [m3]
Industrial cheesemaking 500-3000 200-5000
3.2 Inputs/Outputs of the computational tool
Initially, a window containing a brief description of the tool is displayed, informing the user about the necessary input data (inputs) to perform the simulation (see Figure 1).
Fig. 1. Cool-OP: Opening window.
In the next menu, the user can select which industry fits the company to be analyzed (see Figure 2-a)), including meat, fish, horticultural (fruit and vegetables) and dairy products. Within each of the different sector there are many subcategories. In the specific case of the cheese sector, there are (1) Industrial cheese making and (2) Handmade cheese as shown in Figure 2-b). Thereafter a window appears to input the annual values of the parameters that characterize the company: amount of raw material [ton or kl], electricity consumption [MWh] and total volume of cold rooms [m3]. Note that it is always possible to return to the previous menu or close the window using the respective buttons for navigation.
a) Menu window. b) Menu window of
Cheese sector.
c) Input window of the company
parameters.
Fig. 2. Cool-OP Windows to input the company parameters.
Any of the subcategories of an industry opens a similar window requesting the same parameters, changing only the title and units (Figure 2-c)). After the correct introduction of the data according to the SI unit system and within the valid variation domain of each parameter, pressing the button "Continue" gives access to the general results that summarize
the current state of energy performance of the company. The results are provided in plots that relate the evaluation parameters of the company with the Portuguese average. All plots have a green shaded zone which represents a 95% confidence interval provided by statistical procedure that determined the correlations. In addition, it is also shown in each plot the percent deviation of the point under consideration (Company point – red dot) in relation to the Portuguese national average (black dot). If the user wants to analyse a particular plot, can press the button above it to open a new and larger window.
4. Case study
4.1 Companies details
To validate the tool two companies in each subcategory of the cheese industries were randomly selected, hereinafter referred as Company A and Company B by reasons of business confidentiality. These companies have not made part of the statistical data used in the development of algorithms.
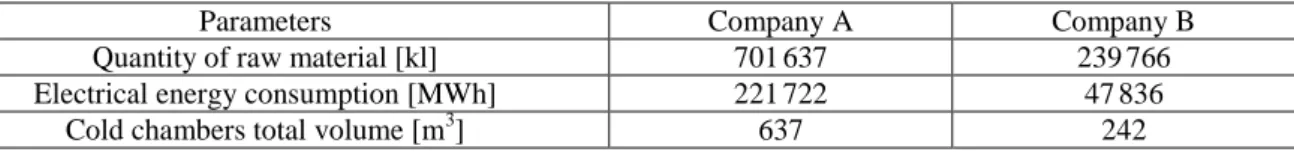
Company A belongs to the industrial cheesemaking type subcategory and it began operating in 2001. It has five cold rooms with a total volume of 637 m3. The cold rooms are built in polyurethane panels with a thickness of 10 cm. The company was four refrigeration systems. The main cold system is a direct circuit system responsible to chill cold rooms n.er 1, 2 and 3, while two air conditioning units are used to chill rooms n.er 4 and 5. The later operates as an indirect circuit with the purpose of chilling the milk. The compressors, Bitzer semi-hermetic type, were built in 1999. During 2010, this company processed about 701637 liters of milk to produce cheese and it consumed 221722 kWh of electrical energy.
Company B operates is a handmade cheese industry and its facilities were built with polyurethane panels with a thickness of 8 cm. It has one room for milk conservation, one room for cheese production, three cold rooms (for different stages of conservation), one room for cheese washing and a dispatch warehouse, among other personnel areas. The cold rooms are also built with 8 cm thickness polyurethane panels and have a total volume of 242 m3. Such as company A, this company has four cooling systems, where two of them are air conditioning units installed inside the rooms for the first and second stage of cheese production. Another cooling system is found outside the facilities and it is a direct-circuit compact unit responsible to chill the cold rooms. The last system is used to chill the milk. After gathering all the data from company B it was concluded that it processed 239766 liters of goat and sheep milk to produce ripened cheese. In order to process such an amount of milk, the electrical energy consumption was around 47836 kWh. The companies’ data is shown in Table 3.
Table 3 – Values of the parameters used to evaluate the companies energy profile.
Parameters Company A Company B
Quantity of raw material [kl] 701637 239766
Electrical energy consumption [MWh] 221722 47836
4.1 Analysis and discussion of results
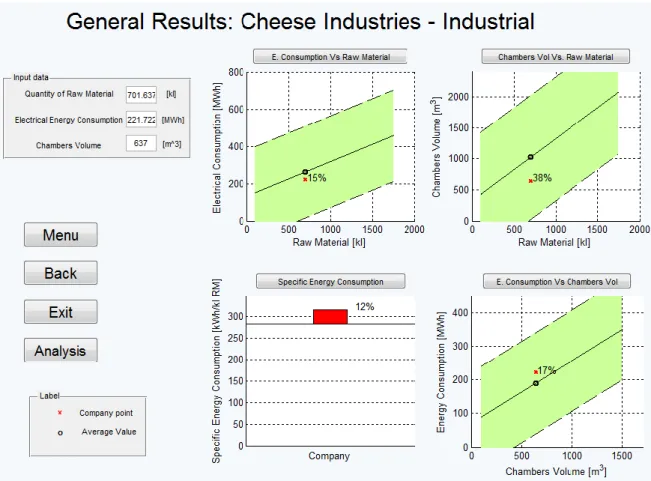
The predictive values of energy performance for company A using Cool-OP are shown in Figure 3. Note that for the first and second plots, which compare the raw material with the electrical energy consumption and volume of cold rooms, both values are under the national average, 15% and 38 % respectively. It is important to point out that all red dots (company performance in relation to the national average) are within the green shade, so the company results fit the predictions. The plot that compares the energy consumption with the volume of cold rooms suggests that the company consumes more 17% energy than the average. From the experimental study developed in the company, this value can be justified due to an undersized nominal power of compressors. This conditions leads to difficulties in achieving the desired environmental conditions in curing rooms, forcing a longer operating time of compressors resulting in higher energy consumption. As result, the Specific Energy Consumption (SEC) of the company is 12% above the average (third plot of Figure 3).
Fig. 3. Simulation results for company A.
Besides this simulation, measurements of electrical energy consumption were carried out using energy analyzers to determine the major energy consumers. The results obtained are shown in Table 4. The cooling systems is the major consumer of electricity, thus if greater energy savings are to be achieved, attention should be focused in these systems. The model results allow the user to conclude that this company carries its activity within the expected parameters for its sector. However its performance can be improved specially through the reduction of energy consumption.
Table 4. Distribution of energy consumption in company A.
Operation Electrical Energy consumption [kWh] Percentage value [%]
Milk recovery 2381 1
Coagulation/curd 2207 1
Forming and press 9760 4
Ripening/cooling process 148499 67
Packaging and dispatch 3223 2
Compressed air 14616 7
Lighting 7953 4
Water treatment 4392 2
Auxiliary services 28692 12
The SEC of this company is 315 kWh/kl. Although the energy consumption versus the raw material shows a value under the average, the comparison of the volume of cold rooms for that amount of raw material increases 17% above the average value. In fact, during the field work several weaknesses were identified, some related to construction aspects and other related to the lack of equipment maintenance. Besides that, it is important to highlight the inappropriate location of the refrigeration equipment, construction of facilities with reduced protection against external heat, and undersized nominal power of the compressors.
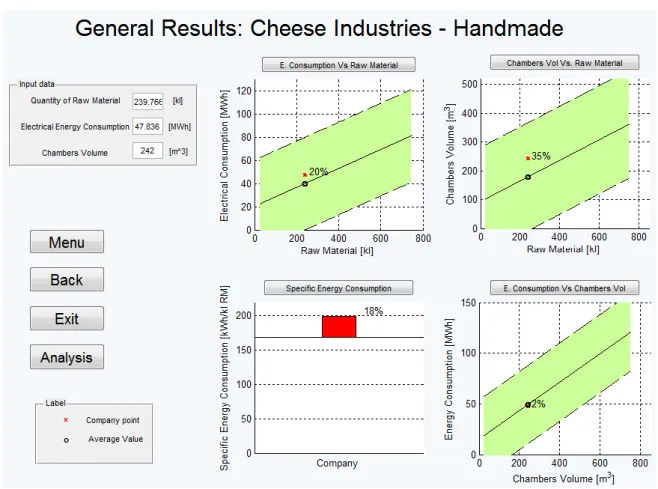
In the case study of company B (handmade cheese sector), the prediction values are within the confidence interval (see Figure 4).
The first plot shows an electrical energy consumption higher than expected in 20% for the same raw material. Considering the actual energy consumption, the company should process about 300000 liters of milk. The value in the second plot, which relates the volume of cold rooms with the raw material amount is 35% above average. Comparing the energy consumption in relation to the volume of cold rooms, it is predicted a similar value to the national average (2% under). The third and more conclusive plot shows a SEC of company B 18% above the average which suggest that there is a big potential for energy savings.
Analysing the overall results it can be concluded that the proposed model is able to predict the energy performance of handcraft cheesemaking. This company consumes electrical energy above average to perform its activities. As before, measurements of the energy consumption per equipment were performed in the company facilities in order to determine the major consumers so that actions can be taken to reduce the total amount of energy consumed. In Table 5 are shown the results of the measurements.
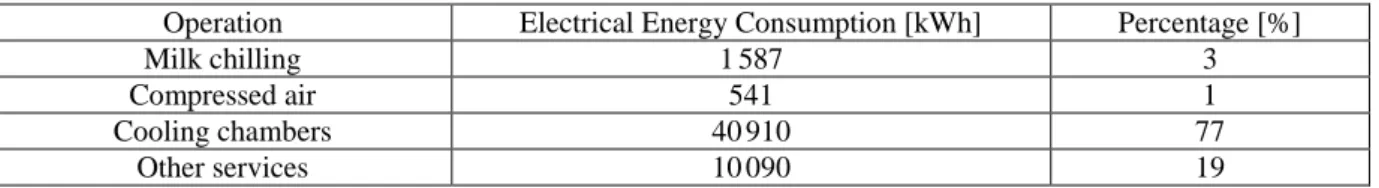
Table 5. Distribution of energy consumption in company B.
Operation Electrical Energy Consumption [kWh] Percentage [%]
Milk chilling 1587 3
Compressed air 541 1
Cooling chambers 40910 77
Other services 10090 19
Once again, the equipment responsible to keep the cold stores within the necessary temperature conditions represents the main consumer of energy in the company (77%). To achieve a more competitive SEC, some actions should be taken to reduce the overall energy consumption of the company such as: implementing a system to ventilate the area where the compressors are located since the measured temperature in this room reach a maximum of 49ºC; the walls of the cold rooms should have a higher thickness to reduce the thermal load by conduction; the access corridor to the cold rooms also needs insulation improvements and, if possible, some air conditioning system should be applied (temperatures of 28ºC were measured in this area); once the doors of the cold rooms are constantly being opened allowing the entrance of hot air into the rooms, curtains or other sealing equipment should be an option to consider; and a maintenance plan for cold systems should be fulfilled.
It is noteworthy that these conclusions are indicative and allow managers of agrifood companies to be aware about the positioning of their company in relation to the national average in terms of energy efficiency. However, any change in the company or in the processes should be based on a detailed in-situ study about the energy consumption of different devices that are part of the production and cooling processes, taking into account the various inefficiencies that may exist. So, the developed tool will aid in the analysis of energy performance, but the user must have the sensitivity to identify possible problems of technical origin on the company facilities. Nevertheless, the results obtained by the computational tool for the prediction of the energy performance of cheese production companies are in line with the failures or inefficiencies detected in the field work.
Conclusions
This paper presents a newer version of the computation tool for the prediction of the energy performance aimed to the dairy food sector, specifically for the cheese industries. The main workflow of the tool is presented. In order to demonstrate its applicability, a case study of two randomly selected companies, one in each subcategory, was presented. From the graphical analysis of predicted results, some conclusions about the positioning of the company's performance relative to the national average are presented. The Cool-OP computational tool allows to perform an evaluation of the energy performance of companies in the agrifood sector comparing parameters such raw materials processed, energy consumption and volume of cold rooms with the national averages so that the user has the ability to conclude which are the possible weaknesses or strengths of its company. The plot of specific energy consumption is very conclusive since it relates the energy consumption per ton or kl of raw material. However it should be mentioned that the developed tool only aids in the analysis of the energy performance, so it is necessary that the user has sensitivity to identify possible problems of technical origin on the company facilities. Thus, the analysis does not eliminate the need for a more detailed study to determine the particular conditions that can be improved. This conclusion arises from the comparison of results obtained from the simulations and results from audits to the respective companies, where the energy measurements were made. It became clear that they had adequate working conditions and a proper maintenance of the equipment, but some technical details concerning the nominal power of compressors, insulation thickness of cold rooms, and thermal sealing devices may improve the energy efficiency. The current state of computational tool allows the user to manually enter the annual data of energy consumption, raw material processed and volume of cold rooms. With these performance predictions, the user can decide how to improve the energy performance of his company. The practical application of this tool demonstrates its usefulness in helping decision-making in the implementation practice measures for the improvement of energy efficiency. This tool includes other correlations for other sectors of agrifood industry, such as meat, fish, horticultural, vine and wine and distribution. Moreover, taking into account the sector in which it the company under analysis belongs, will provide automatic suggestions for the improvement of energy performance. Changing the linear correlation values, this tool can be used in any country, since the production process and storage conditions may differ depending on the food product.
Acknowledgments
This work is part of the anchor project "InovEnergy – Eficiência Energética no Sector Agroindustrial" inserted in the Plan of Action of InovCluster. The study was funded by the National Strategic Reference Framework (QREN 2007-2013) - Operational Programme for Competitiveness Factors, 01/SIAC/2011, Ref: 18642.
References
1. FAO, Food Outlook - Biannual report on global food markets, Food and Agriculture Organization of the United Nations (FAO), June, 2013.
2. J. Nunes, P.D. Silva and L.A. Andrade, Energetic efficiency evaluation in refrigeration systems of meat industries, 23rd International Congress of Refrigeration - ICR 2011, August 21 - 26, Prague, Czech Republic, 2011.
3. O. Laguerre, H.M. Hoang and D. Flick, Experimental investigation and modelling in the food cold chain: Thermal and quality evolution, Trends Food Sci Tech 29 (2013) 87-97.
4. IEA, 2012 Key World Energy Statistics, International Energy Agency (IEA), 2012.
5. A.C. Pachai, From Candle to table – cooling and freezing of food, 2nd IIR International
Conference on Sustainability and the Cold Chain (ICCC 2013), Paris, France, 2013.
6. E. Gogou, G. Katsaros, E. Derens, L. Li, G. Alvarez and P. Taoukis, Development and applications of the European Cold Chain Database as a tool for cold chain management, 2nd
IIR Int. Conference on Sustainability and the Cold Chain (ICCC 2013), Paris, France, 2013. 7. V. Stahl, G. Alvarez, E. Derens, H.M. Hoang, A. Lintz et al., An essential part of the frisbee
software tool: Identification and validation of models quantifying the impact of the cold chain on the RTE pork products, ICCC 2013, Paris, France, 2013.
8. A. Foster, C. Zilio, M. Corradi, L. Reinholdt and J.A. Evans, Freely available cold store energy models, ICCC 2013, Paris, France, 2013.
9. J.A. Evans, E.C. Hammond, A.J. Gigiel, A.M. Foster, L. Reinholdt et al., Assessment of methods to reduce energy consumption of food cold stores, Appl Therm Eng 62(2) (2014) 697-705.
10. J.A. Evans, A.M. Foster, J.-M. Huet, L. Reinholdt, K. Fikkin et al., Specific energy consumption values for various refrigerated cold stores, Energ Buildings 74 (2013) 141-151.
11. M. Eden and C. Colmer, Improved Cold Chain Management: efficiency and food safety through international project results, Food Safety and Tecnhology 24(1) (2010) 30-32.
12. C. Olmer, M. Kuck, M. Lohmann and M. Bunke, Novel Technologies to improve safety and transparency of the chilled food supply chain, Innovation in the nordic marine sector, 2009.
13. IAPMEI, SMEs in numbers, (accessed in 18/02/14).
14. J. Nunes, Energetic efficiency evaluation in refrigeration systems of agrifood industries in the Beira Interior region, PhD Thesis, University of Beira Interior, Covilhã, Portugal, 2014.
15. J. Nunes, P.D. Silva, L.P. Andrade and P.D. Gaspar, Characterization of specific energy consumption of electricity of portuguese sausages industry, Energy Quest 2014, 2014.
16. J. Nunes, P.D. Silva, L.P. Andrade, P.D. Gaspar and L.C. Domingues, Energetic evaluation of refrigeration systems of horticultural industries in Portugal, 3rd IIR International
Conference on Sustainability and Cold Chain (ICCC 2014), London, UK, June 23-25, 2014. 17. J.A. Evans, E.C. Hammond, A.J. Gigiel, L. Reinholdt, K. Fikiin and C. Zilio, Improving the
energy performance of cold stores, ICCC 2013, Paris, France, April 2-4, 2013.
18. R. Santos, J. Nunes, P.D. Silva, P.D. Gaspar and L.P. Andrade, Ferramenta computacional de análise e simulação do desempenho de unidades de conservação de carne através de frio industrial, VI Congreso Ibérico y IV Congreso Iberoamericano de Ciencias y Técnicas del
Frío (CYTEF-2012), Madrid, Spain, February, 2012.
19. R. Santos, J. Nunes, P.D. Silva, P.D. Gaspar and L.P. Andrade, Computational tool for the analysis and simulation of cold room performance in perishable products industry, 2nd IIR
Int Conference on Sustainability and the Cold Chain (ICCC 2013), Paris, France, 2013. 20. D. Neves, P.D. Gaspar, P.D. Silva, J. Nunes and L.P. Andrade, Cool-OP: Cooling
Optimization Program – Ferramenta computacional para avaliação da eficiência energética de empresas de frio industrial no sector alimentar, International Conference on Engineering,
ICEUBI 2013, University of Beira Interior, Covilhã, Portugal, November 28-30, 2013. 21. D. Neves, P.D. Gaspar, P.D. Silva and J. Nunes, Predictive evaluation of the energy
efficiency of Portuguese industrial companies in the meat food sector, Advances in
Engineering Software. (submitted)
22. D. Neves, P.D. Gaspar, P.D. Silva, J. Nunes and L.P. Andrade, Computational tool for the energy performance assessment of horticultural industries – Case study of industries in the centre inner region of Portugal, 14th International Conference on Computational Science