Biological variation in temporary streams: understanding
river patches at different scales for monitoring and
management applications
Katarzyna Krystyna Sroczyńska
Ph.D in Marine, Earth and Environmental Sciences Speciality in Freshwater Science
Thesis supervised by:
Dr. Luís Chícharo Faculty of Science and Technology, Campus of Gambelas, University of Algarve 8005-139, Faro, Portugal
Dr. Adrianna Wojtal-Frankiewicz Department of Applied Ecology, Faculty of Biology and Environmental Protection, University of Łódź, 90-237 Łódź, 12/16 Banacha Str., Poland
Faro
2017
Biological variation in temporary streams: understanding
river patches at different scales for monitoring and
management applications
Katarzyna Krystyna Sroczyńska
Ph.D in Marine, Earth and Environmental Sciences Speciality in Freshwater Science
Thesis supervised by:
Dr. Luís Chícharo Faculty of Science and Technology, Campus of Gambelas, University of Algarve 8005-139, Faro, Portugal
Dr. Adrianna Wojtal-Frankiewicz Department of Applied Ecology, Faculty of Biology and Environmental Protection, University of Łódź, 90-237 Łódź, 12/16 Banacha Str., Poland
Biological variation in temporary streams: understanding river patches at different scales for monitoring and management applications
Declaração de autoria de trabalho
Declaro ser a autora deste trabalho, que é original e inédito. Autores e trabalhos consultados estão devidamente citados no texto e constam da listagem de referências incluído “A Universidade do Algarve tem o direito, perpétuo e sem limites geográficos, de arquivar e publicitar este trabalho através de exemplares impressos reproduzidos em papel ou de forma digital, ou por qualquer outro meio conhecido ou que venha a ser inventado, de o divulger através de repositórios científicos e de admitir a sua cópia e distribuição com objeticos educacionais ou de investigação, não comerciais, desde que seja dado crédito ao autor e editor.”
Acknowledgements
Following work would not be possible without the help of wonderful persons that I was lucky to meet during this PhD project. I would like to thank my supervisors Luís Chícharo and Adrianna Wojtal-Frankiewicz. Luís Chícharo was always supporting me in technical issues, taking care that I make a right progress and providing me with the best solutions. Adrianna Wojtal-Frankiewicz was inspiring me by giving me great ideas and advices, but also a lot of mental support. Here I would also like to thank to Pedro Range, who was co-author of all the publications, which make the large part of thesis. Pedro was always available to help me and provided me a great guidance through the duration of the project. The whole experimental work and sampling would not be possible without great dedication of my friend Marilia Claro. At the University of Algarve I also wanted to thank you people who directly worked with me: Joana Cruz, Alexandra Chícharo, Francisco Leitão, Renata Gonçalves and Radhouan Ben-Hamadou.
My great thanks also go to Professor Tomasz Boski, who inspired me to work with isotopes and provided me a contact to José Antonio González-Pérez from IRNAS-CSIC, in Seville. José Antonio supported me with all the technical issues related to isotopes and her technician Alba Carmona Navarro greatly helped me with the sample analysis.
I would also like to mention Maria Schröder, Samantha Hughes and Simone, Varandas who were the first people to teach me how to identify macroinvertebrates.
Essential role in designing the metabolic chambers had Kasia Wasiak who shared a lot of knowledge and experiences with me related to benthic community metabolism. My gratitude also goes to Victor García López, Carlos Sanchez Ureña and Almudena López
Fernández who gave me hand in the field, spending many hours measuring benthic
metabolism.
I‘m also thankful to my friends from Laboratório de Análises Quimicas (LAQ): Paulo Zaragosa Pedro, Marta Ribeiro e Bruno García who dedicated their time to teach me and greatly help me in sample analysis.
I also wanted to thank you people from U.S. especially Michael Vanni and his wife - Maria González who received me so well in their lab at Miami University and made my time in U.S. unforgettable. Here my deepest thanks also go to Tanner Williamson, who provided me with a lot of guidance and support during my stay in U.S.
Finally I would like to acknowledge the financial support from the IMPACT project funded by Foundation for Science and Technology (FCT) of Portugal (ERA-IWRM/0003/2009).
At the end I wanted to thank you my precious friends whose mental support was priceless: Asia Włodarczyk, my cousin - Zuza Piechocka, my family, Vitor, Necas, Jennifer Taylor and Bogna Jacniacka among others.
Summary
Biota and ecological processes are highly complex and vary at every scale. This underscores the importance of employing a multi-scale design to adequately understand these processes and complex relationships in riverine ecosystems. In addition, there is a strong need to develop appropriately scaled indicators of river ecosystem health that include this biotic complexity in a manageable fashion. Unfortunately, currently available indicators are either too complex or do not adequately capture the highly variable changes to the ecosystem. Patches are good templates for various ecological processes and because they are considered to be stable over the spatial and temporal scales, they can be used as functional filters of important processes in streams.
The aim of this thesis is to employ patch theory and multi-scale approach to develop structural and functional indicators of the ecosystem health at the patch level and evaluate in which of the scales these indicators are of the highest relevance for the patch. The system at which these indicators were tested consists of headwater intermittent streams within a Mediterranean catchment. Three scales were considered: reach scale, stream scale and catchment scale.
According to the results patch as a source of variation was not well explained by the structural measures of benthic communities at catchment scale. This was related to the effect of occurrence of a strong environmental filter (mainly altitude and its association with conductivity and temperature), which limited distribution of biota and constrained the occurrences of certain species at the smaller scales. Also, these filters were demonstrated to act indirectly through patterns in habitat formation and availability. Patch investigated at the reach scale provided slightly more predictable unit of species organization, nonetheless, still benthic communities of some of the patch types overlapped. Instead, the most consistent measures of ecosystem health that could be applied to studying patches were the metabolism measurements at the reach scale and the isotopic signatures at the stream scale. Next step forward would be to establish reference values for these two approaches for undisturbed systems, and subsequently to incorporate these measures into biomonitoring guidelines.
Following disturbance, patches have been shown to be the most appropriate unit used when evaluating biotic recovery. As such, this study represents an important step
towards development of better biomonitoring tools as well as evaluation of the restoration effort.
Keywords: spatial scale; macroinvertebrate assemblages; intermittent streams; functional indicators
Resumo
Os processos biológicos e ecológicos nas ribeiras são altamente complexos e variam em diferentes escalas espaciais e temporais. Assim, a análise dos processos e relações ecológicas ribeirinhos requer uma abordagem multi-escalas que permita capturar a variabilidade efetiva do sistema. Para tal, é necessário desenvolver indicadores que sejam representativos dessa variabilidade e complexidade. Os indicadores disponíveis são demasiado complexos ou não capturam de forma adequada as alterações, altamente variáveis, no ecossistema. Assim, o objectivo deste trabalho foi propor vários indicadores (estruturais e funcionais), nas três escalas espaciais (secção do rio; ribeira e bacia hidrográfica) num sistema de ribeiras intermitentes da bacia Mediterrânica do Algarve. Estes indicadores foram avaliados em áreas de consideradas unidades representativas (habitats) dos processos que ocorrem a nível geral, da ribeira.
Analisaram-se indicadores estruturais: variação das comunidades bentônicas de macroinvertebrados e indicadores funcionais: metabolismo do ecossistema, assinaturas isotópicas e avaliação da reciclagem dos nutrientes. Para analisar os dados foram usadas várias metodologias estatísticas como analises univariadas e multivariadas, ”Indicator value analysis” e “self organizing maps”.
Os resultados evidenciaram que a avaliação do metabolismo do ecossistema pode ser usado para caracterizar habitats na escala da secção do rio enquanto que as assinaturas isotópicas caracterizaram melhor os habitats à escala da ribeira. O terceiro indicador: reciclagem dos nutrientes foi altamente correlacionado com tipo de espécie analisado. Sendo assim, este indicador pode ser utilizado sobretudo em sistemas onde existam variações significativas nas comunidades bentônicas. Por outro lado, os indicadores estruturais revelaram não ser bons indicadores da variação entre os habitats, já que as comunidades foram estruturadas sobretudo devido à influência da altitude e a sua associação com a condutividade e temperatura.
Este estudo contribuiu para a caracterização dos ecossistemas das ribeiras do Algarve e para o desenvolvimento de metodologias mais representativas a utilizar em programas de biomonitorização em ribeiras intermitentes mediterrânicas.
Palavras chaves: Escala espacial; Comunidades de macroinvertebrados; Ribeiras temporárias; Indicadores funcionais
Table of contents
Acknowledgements IV Summary VI Resumo VIII Table of contents X Chapter 1. 1.1. General Introduction 11.1.1. Macroinvertebrate assemblage structure 2
1.1.2. Functional measures (rate of production and respiration) 4
1.1.3. Functional measures (Stable isotopes) 4
1.1.4. Stoichiometry of benthic animals and their food sources 5
1.2 Specificity of Temporary streams 6
1.3. Objective of the thesis 9
1.4. Structure of the thesis and specific objectives of each chapter 9
Chapter 2.
2.1. Introduction 12
2.2. Methods 15
2.2.1. Study area 15
2.2.2. Macroinvertebrate sampling and criteria for candidate
indicator species determination 15
2.2.3. Criteria for candidate indicator species 17
2.2.4. Environmental variables 18
2.2.5. Data analysis 19
2.3. Results 20
2.3.1. SOM partitioning 20
2.3.2. Environmental variables 22
2.3.3. Indicator species analysis 24
2.3.4. Conceptual classes 26
2.4. Discussion 29
2.4.1. Indicator species 32
2.5. Summary and implications for biomonitoring 35
Chapter 3.
3.1. Introduction 38
3.2. Methods 41
3.2.2. Sampling methods 42
3.2.3. Laboratory methods 42
3.2.4. Data Analysis 43
3.3. Results 44
3.3.1. Community structure 44
3.3.2. Diversity and water quality indices 49
3.4. Discussion 51 Chapter 4. 4.1. Introduction 58 4.2. Methods 59 4.2.1. Indicator Value 60 4.3. Results 62 4.3.1. Physico-chemical parameters 62 4.3.2. Community descriptors 63
4.3.3. Indicator Species analysis 66
4.4. Discussion 67 Chapter 5. 5.1. Introduction 72 5.2. Methods 74 5.2.1. Study site 74 5.2.2. Experimental procedure 76 5.2.3. Data Analysis 81 5.3. Results 82 5.3.1. Benthic metabolism 82 5.3.2. Environmental variables 83
5.3.3. Relationship between benthic metabolism and habitat characteristics 84
5.4. Discussion 86 5.4.1. Primary Production 86 5.4.2. Community Respiration 88 5.5. Conclusions 89 Chapter 6. 6.1. Introduction 92 6.2. Methods 94 6.2.1. Study site 94
6.2.4. Nutrient Analysis 99
6.2.5. Statistical analysis 99
6.3. Results 101
6.3.1. Environmental parameters 101
6.3.2. Stable isotope signatures of basal resources (δ15N and δ13C ) 101 6.3.3. Stable isotope signatures of consumers (15N and δ13C) 103 6.3.4. δ15N and δ13C of consumers and their food 106
6.3.5. FFG and Site interaction 109
6.4. Discussion 109
6.4.1. Food source for aquatic consumers 109
6.4.2. Site differences in periphyton 111
6.4.3. FFGs and Site interaction 112
Chapter 7.
7.1. Introduction 118
7.2. Methods 120
7.2.1. Study Site 120
7.2.2. Excretion experiment 122
7.2.3. Macroinvertebrates and habitat sampling 122
7.2.4. Sample processing 122
7.2.5. Statistical analysis 123
7.3. Results 125
7.3.1. Among site differences in periphyton quality and quantity 125 7.3.2. Interaction effect of site and taxonomical group on excretion rates 126 7.3.3. Relationships between food source and body content in regard to site 128 7.3.4. Among taxa differences in elemental composition and excretion 129
7.4.5. Aggregated nutrient excretion 132
7.4. Discussion 133
7.4.1. Aggregated nutrient excretion 135
Chapter 8.
8.1 Discussion 137
8.1.1. Macroinvertebrate assemblage structure 137
8.2. Functional measures (rate of production and respiration) 140
8.1.2. Functional measures (Stable isotopes) 141
8.1.3. Nutrient cycling by animals 143
8.2. Testing the RCC theory and food web structure on small headwater
intermittent streams 144
References 152
Chapter 1
1.1. General introduction
Streams and rivers are heterogeneous environments shaped by geological and hydrological processes acting at both spatial and temporal scales (Elosegi et al. 2010; Poff and Ward 1989; Vinson and Hawkins 1998). These processes directly contribute to changes in channel morphology and formation of visually distinct patches within the stream channel (Armitage et al. 1995; Gasith and Resh 1999). Patch is considered an area of the stream visually distinct from its surroundings (Forman and Godron 1986). Individual patches can be characterized by their hydrological gradient (such as rapid riffles or lentic, depositional pools) or type of substrate such as mineral (ranging from bedrock and large boulders to fine sediments); organic (i.e. woody debris or macrophytes) or a mixture of both (i.e. epilithic algae growing on mineral substrates). Such patches, commonly defined as habitats (and alternately referred either as patches or habitats, in the current work) have physical uniformity, are influenced by the similar set of environmental conditions, and constitute “unique functional processes zones” (Vannote et al. 1980). In classical ecological studies, patch is considered as a template, which is meaningful for the species patterns and ecological processes acting at spatial and temporal scales (Southwood 1977). Therefore, patches can be viewed as integrated (by space and time) units of river channel, at which important processes occur. This is why habitat is considered by many authors as the most appropriate scale to study heterogeneity of lotic ecosystems and key biological processes in streams and rivers (Stanford et al. 2005; Whited et al. 2007). Pringle et al. (1980) in his patch dynamics concept emphasize the importance of studying patches in lotic ecology for better understating of the overall spatial complexity of the ecosystem function. Viewing rivers as a mosaic of patches reduces intricacy of processes and patterns to a single dimension, which allows for better insight into their ecology, factors which regulate them, as well as allows for the link to broader range of ecosystems processes and application in management, restoration efforts and biomonitoring. For example, partitioning of stream into separate units allows validating major ecological theories such as River Continuum Concept (RCC), or Nutrient Spiralling (NS). Additionally, understanding of the processes occurring at the patch scale allows to better predict the consequences of disturbances to the ecosystems on broader scales (according to shifting habitat mosaic concept, introduced by Stanford et al. 2005).
Water Framework Directive (WFD) obligates the members of the European Community to preserve and improve the status of aquatic ecosystems by monitoring and assessing water quality using biological indicators of the ecosystem health. Based on the previously introduced patch approach, human-induced disturbances to the ecosystems as well as measures of restoration success are often assessed by changes to benthic habitats, thereby considered as different patches (Armitage and Pardo 1995). However, the ecological relevance of a patch depends on the processes considered and the scale of the observation (Cortes et al. 2009). Scales that are the most relevant to a group of studied organisms or processes are those with the highest ecological importance.
As noted by Naura et al. (2011): ”the identification of causal relationships between habitat features, processes and communities, and the scale at which those should be assessed are two major issues in designing monitoring and management programmes”. And therefore as reported by Cortes et al. (2009): “selection of appropriate scales for habitat characterization and associated metrics to describe biologically relevant responses to stressors are fundamental considerations” in the framework of WFD and other management and river restoration programs. Then, the general aim of the current work is to apply multi-scale approach to investigate patches as templates for various processes, which are of the ecological focus from the river management and the biomonitoring perspective.
The following section presents the important ecological processes and indicators of ecosystem health most commonly used in the investigation of patches as a source of variation.
1.1.1. Macroinvertebrate assemblage structure
Majority of studies which assess the river health use the response of benthic fauna, at different habitats, as a proxy to detect changes in riverine ecosystems. This is based on the assumption that abiotic factors which influence the habitat template, will determine macroinvertebrate communities found there. However, the effectiveness of macroinvertebrates as descriptors of habitats was demonstrated to differ, depending on the scale of the observation. In general, studies on structural dynamics of biota demonstrated strong influence of habitat characteristic on abundance, diversity and the trophic structure of macroinvertebrate assemblages (Brown 2003; Beisel et al. 2000;
Pardo and Armitage 1997). This is not surprising, as most of the taxa are sensitive to a wide array of habitat conditions such as: type of food available, current velocity, substrate type and stability, range of dissolved oxygen, among others (Downes et al. 1993; Douglas and Lake 1994). These habitat specific preferences impel them to be confined to particular habitats within a river reach. Habitat type and heterogeneity are regarded as good predictors of species assemblages, abundance and diversity at the reach scale (Pardo and Armitage 1997; Boyero et al. 2003a; Richards et al. 1996, 1997). However, at the larger scale habitat and heterogeneity are not good predictors of species assemblages (Boyero, 2003b; Heino et al. 2003). Weak concordance found among macroinvertebrate assemblages and their habitats at larger scales is because of the hierarchical scale dependence, where larger scale variables control habitats and processes at local scales (Feminella 2000; Rabeni and Doisy 2000; Frissell et al. 1986). For example, geological characteristics of the river basin, such as altitude, slope, and river channel morphology exert control on the grain size distribution and hydrological regime, which, in turn affect patch structure and arrangement within a river channel. In addition local variables such as predation or competition can vary over few meters, having direct or indirect control on small scale variation among species assemblages (Menge and Olson, 1990). From the biomonitoring perspective, this has large implications because it demonstrates that catchment-scale factors might obscure important effects of local disturbance on the structure of biota (Richards et al. 1997). Hence, catchment scale properties will have direct or indirect influence on patch properties expressed at smaller scales (Richards et al.1997) and further, can mask important features of habitat in organizing stream assemblages. Consequently, in order to explain at what scale the stratification by patch is useful to understand dynamics of macroinvertebrate assemblages, one should a priori identify main drivers of patch structuration and species occurrences at the catchment scale (Hawkins et al. 2000; Heino et al. 2002, 2003). However, even then, patches might not guarantee to be sensitive descriptors of species assemblages. Knowledge about macroinvertebrate arrangements in the context of patches is undeniably important component of the ecosystem health. Nonetheless, high spatial variability in patterns of macroinvertebrate distribution and weak correlation with local factors may limit their role of structural indicators of how the system works.
1.1.2. Functional measures (rate of production and respiration)
Recently, several studies have drawn attention that using only a structural organization of biota, as indicators of ecosystem health (without considering also its functional role) contribute little to ecosystem functioning and therefore should not be used as the only indicator in assessment of the ecological status of the water bodies (Brooks et al. 2002; Bunn and Davis, 2000). As a response to these issues, the 5th European Water Framework Directive requires additional incorporation of the ecosystem processes in stream assessment protocols. Recently, functional measures have received considerable attention due to their sensitivity in response to environmental change (Bunn et al.1999; Fellows et al. 2006; Young et al. 2008). One of the most conspicuous descriptors of the ecosystem-level processes is the measure of community primary production and respiration. Few studies that measured patch specific benthic metabolism demonstrated differences in community production and respiration among different stream habitats. Gonzales et al. (2014) demonstrated high spatial variation in metabolism within a stream, related to presence of different geomorphic units, bed materials and type of transient storage. Based on these recent findings, patch-specific benthic metabolism can represent more accurate alternative indicator of changes in water quality than structural measures of benthic communities. In addition, patches viewed as distinct metabolic entities allow validating important concepts of ecosystem processes, such as river continuum concept (Bott et al. 1985). Further, by upscaling patch specific benthic metabolism to the entire reach or stream it would be possible to predict whole stream carbon budgets. However, contradictory studies also demonstrated that the information about the autotrophy or heterotrophy of the ecosystem solely is not a reliable indicator of the ecosystem health under different type of disturbances (Bunn et al. 1999; Death et al. 2009). Hence, it remains unclear wherever primary production is an efficient indicator of an ecosystem health.
1.1.3. Functional measures (Stable isotopes)
Another functional measure for assessing the ecosystem health is the use of stable isotopes, mainly C and N. The use of stable isotopes is based on the assumption that habitats and consumers of anthropogenically-disturbed ecosystems will have more distinct isotopic signatures than their counterparts in reference sites. Stable isotopes
1999); sewage impacts (Di Lascio et al. 2013), agricultural land use; anthropogenic nitrogen deposition (Holtgrieve et al. 2011); wastewater effects (Morrisey et al. 2013); nutrient enrichment (Bergfur et al. 2009), among others. Additionally, measurements of carbon and nitrogen isotopic signatures at sites, with variable human impact might provide an early warning of potential disturbance problems. Only recently, isotopes were also used as an excellent tool for retesting the River Continuum Concept (Pingram et al. 2012). This was achieved by measuring isotopic signatures of invertebrates along the river longitudinal gradient (Rosi-Marshall et al. 2016). However, many studies on stable isotopes demonstrated high overlap among basal food sources and consumers, obscuring the clear effect of the disturbance on consumers and their habitats (Bergfur et al. 2009). The main source of variability among isotopic signatures is associated with high interspecific variability in consumers, as well as in their patchy food resources among and within the same rivers (Dodds et al. 2014; Lorrain et al. 2002).
1.1.4. Stoichiometry of benthic animals and their food sources
Nutrient excretion and elemental composition of consumers and their resources are not a direct indicator of the ecosystem health. However, such knowledge, especially in the context of producer/consumer interactions, is important to identify the consequences of nutrient enrichment to the ecosystem on the ecological patterns and processes in streams (Bowman et al. 2005). The extent to which benthic macroinvertebrates supply nutrients to the aquatic ecosystem depends on their own body stoichiometry and their food composition (Elser and Urabe 1999). This relationship was modelled by Sterner (1990) based on mass-balance equations under the assumption that animals are homeostatic in maintaining their internal nutrient composition. Therefore any producer-consumer nutrient imbalance might alter the availability of nutrients to primary producers. Studies investigating the overall supply and availability of elements to the stream biota are influenced by the heterogeneity of the in-stream habitats (Meyer et al. 1988). For example, exclusion of essential habitats, such as leaf litter, from the stream might have enormous ecosystem-level consequences because physical nature of substratum affects resource availability to consumers (Wallace et al. 1997). Because excretion rate is taxa and feeding group specific, from stoichiometry approach we would expect differences in excretion rates between communities with different species assemblages (taxa and
and quantity of resources. Further, we will expect that patchy distribution and abundance of benthic species in the river bottom will create spatial variation in nutrient dynamics within the same stream. Such knowledge of how patches are important to the ecosystem from the nutrient supply perspective might greatly enhance the restoration programs targeted to maintain the biotic integrity in the stream. However, the magnitude of this variation will depend on how patches differ as descriptors of the community assemblages and at what scale of observation these differences in nutrient supply variation among patches are the most apparent. Although such knowledge should be a prerequisite in designing restoration programs, only few studies investigated the role of patch (in this case riffle/pool) in spatial variability of nutrients supply (McIntyre et al. 2008) and few more investigate the variability in macroinvertebrate biomass in total nutrient availability (Benstead et al. 2010; McManamay et al. 2011).
1.2. Specificity of Temporary streams
Temporary streams are channels, which maintain water flow only seasonally and become dry when the flow ceases during dry periods (Acuña et al. 2014). Temporary streams are classified as intermittent, when the flow is maintained over some sections in the stream forming a series of disconnected pools. Disconnected pools maintain during the dry periods because of elevated water tables or directly groundwater recharge. Temporary streams are extremely dynamic ecosystems located at the interface of terrestrial and aquatic habitats (Steward et al. 2012). They are important habitats for plants and animals, spots for nutrients and carbon recycling and linking corridors to other perennial water bodies (Arthington et al. 2014; Datry et al. 2014a; Gasith and Resh 1999; Kerezsy et al. 2013; Steward et al. 2012; Williams, 1996). Although temporary streams are widely distributed and ecologically valuable, for long time they were neglected by scientists and their ecology, geography and hydrology represent an understudied area of research in comparison to perennial water courses (Datry et al. 2014). Understanding of most ecosystem processes, including validation of major ecological theories in temporary Mediterranean streams are poor, in comparison to perennial watercourses (Leigh et al. 2015). For example, RCC theory assumes longitudinal change of production, from heterotrophic headwaters which rely on prevalence of terrestrial food sources and corresponding macroinverterate assemblages towards downstream located, higher order streams and large rivers, where autotrophy
dominate and main carbon subsidies are of autochthonous origin (Vannote et al. 1980). However, RCC was developed over large scale ranging from first order streams to large rivers, whereas Mediterranean basins in Portugal, commonly constitute streams from first to third order, all classified as headwater streams. Additionally, terrestrial inputs to Mediterranean streams are less pronounced than in more humid regions and autochthons benthic production is believe to be the primary energy source, even at well-shaded forested streams (Bunn et al. 1999; Douglas et al. 2005; Gasith and Resh, 1999). Therefore, RCC theory might not be so obviously manifested in these streams (Pingram et al. 2012). Further, some authors demonstrated that preferences of macroinvertebrates for specific type of habitat are less exhibited and dominated by the generalist traits in streams with higher frequency and magnitude of disturbance, such as temporary streams (Death and Winterbourn 1995). Such tactic employs lesser selectivity in terms of resource partitioning (Vannucchi et al. 2013). An evidence for such pattern, inferred from stable isotope studies, was demonstrated for higher fish consumers from intermittent sites, where resource availability is seasonally variable, and thus omnivory was promoted as an adaptive strategy to use their resources more efficiently, than their counterparts from perennial sites (Pusey et al. 2010; Douglas et al. 2005). Such generalist tactic may hamper to define the ecological niches for macroinvertebrates in temporary streams and question the use of habitat as an efficient descriptor of taxa assemblages. Additionally, Mediterranean temporary streams are subjected to highly variable hydrological regime, which has large consequences for biota dynamics and patterns. This has further implications for river management and biomonitoring. For this reason, several authors emphasized that temporary streams should be considered separately in biomonitoring (Beche et al. 2006; Mas-Mari et al. 2010; Chakona et al. 2008; Clarke et al. 2010; Argyroudi et al. 2009 Grubbs 2011 Gasith and Resh, 1999; Bonada et al. 2007). Although, large progress has been made in recent years to develop bioassessment tools in Mediterranean basin to address the specificity of this type of ecosystems to biomonitoring protocols and river basin management plans (Acuña et al. 2014; Arthington et al. 2014; Datry et al. 2014b; Feio et al. 2014; Hughes and Malmqvist 2005; Nikolaidis et al. 2013; Prat et al. 2014), still many unresolved issues exist. Mediterranean type of stream has been questioned to not adequately reflect the water quality, based on macroinvertebrate metrics. In Portugal main river typologies were established (INAG, 2008) for macroinvertebrate sampling, however there is a
spectrum of heterogeneity of the Mediterranean temporary streams. Further, little effort is dedicated into investigation of patches in intermittent streams and validating if the patches relevant for biota in perennial streams are of the same importance in temporary watercourses. This has implications on rapid bioassessment programs because techniques and methodologies required by WFD and developed for perennial streams might not be of the same importance in Mediterranean watercourses.
In summary, lack of sufficient knowledge about temporary stream ecology makes their management and protection challenging (Arthington et al. 2014; Leigh et al. 2015). Mediterranean Intermittent streams are particularly vulnerable to any kind of water diversions, impediments and flow regulations, which in turn affect the mechanism of habitat structuration (Gasith & Resh, 1999) and consequently changes in community composition (Datry et al. 2014b). For example, reduction in flow can favour lentic and more tolerant taxa (i.e. Diptera) with decrease abundance of rheophilic (i.e.
Heptagenidae) species (Boulton, 2003). Also, some feeding strategies, such as filter
feeders can be more affected than others (Death, Dewson, & James, 2009). Furthermore, global climate change predicts the increase of the temporality of streams, making them even more vulnerable to degradation in the nearest future. For all these reasons, increasing our knowledge about the ecology of temporary streams and recognize their essential role in the ecosystem function should be a prerequisite for better assessment, management and conservation of these water bodies.
Presented work should contribute to general understanding of the benthic assemblage structures and habitat-related ecological-level processes at temporary streams, at various scales and should lead to the improvement of bio-assessment methods and river management plans for better characterization of patterns and processes as well as protection and restoration of this type of ecosystems.
1.3. Objective of the thesis
The main objectives of the thesis are therefore as following:
1. Test the hypothesis of “landscape filter” and determine major drivers, which shape patches and biota occurrences at catchment scale;
2. Determine patch and stream type as a source of variation in macroinvertebrate distribution at the catchment scale;
3. Determine patch as a source of variation in macroinvertebrate distribution at the reach scale;
4. Determine patch as a source of variation in community production and respiration rates at the reach scale. Examine if patch be considered as a unique metabolic entities and if factors influencing metabolism are patch specific;
5. Determine the importance of different habitat patches in the context of food resources for consumers at the reach and stream scale;
6. Examine patch in the context of potential spatial gradients in nutrient dynamics at the reach and stream scale;
7.Summarize findings in the context of its utility in river management and bioassessemnt programs, and. identify indicators and the appropriate scale at which these indicators should be used for successful river management plans and biomonitoring.
1.4 Structure of the thesis and specific objectives of each chapter
The main body of the thesis is comprised of 6 chapters. Each chapter should respond the above-listed objectives. The second chapter tries to respond the question if catchment scale should be treated as a homogenous unit (scale) or should be subdivided into classes, according to the larger-scale factors, which may limit biota occurrences. The third and fourth chapter introduces the concept of a patch and tries to identify patterns in macroinvertebrates community structure among habitats and family-specific associations to studied habitats. Third chapter investigates the patch-macroinvertebrate relationship at the catchment scale and fourth chapter addresses similar issue, but at the reach scale. These two chapters aim to address the question of what are the factors that
each other, or is there an interaction among them? Fifth chapter investigates the patch in a context of ecosystem-level process, at the reach scale. The main objective of this chapter is to provide an information if patch can be considered as unique metabolic entity. Challenges associated to extrapolation of the metabolism measurements from patches to catchment scale are mainly constrained by the methodologies applied, which are not able to capture the heterogeneity of the reach. For this reason, I also emphasize the methodological part of flow-through chamber to measure metabolism at different spatial units within a stream. Sixth chapter examines if patches can be viewed as distinct food source entities and how do they influence consumer’s signatures and trophic food web. Isotopic signatures of patches and consumers are tested at the same reach and at different streams. The last chapter raises the similar issue as previous chapter, but it considers a patch as a unique entity which might be responsible for variation in nutrients supply to the system. At the end of the thesis the results are summarized and discussed and a separate section is dedicated to the implications that obtained results have on river management and biomonitoring.
Chapter 2
Indicator macroinvertebrate species in a temporary Mediterranean river: recognition of patterns in binary assemblage data with a Kohonen artificial neural network
K. Sroczyńska1, M. Claro2 , A. Kruk3, A. Wojtal-Frankiewicz4, P. Range5 and L. Chícharo1
1 Faculty of Science and Technology, Campus of Gambelas, University of Algarve
8005-139, Faro, Portugal
2 Centro de Ciências do Mar, Universidade do Algarve, Campus de Gambelas 8005-139
Faro, Portugal
3 Department of Ecology and Vertebrate Zoology, Faculty of Biology and
Environmental Protection, University of Łódź, 90-237 Łódź, 12/16 Banacha Str., Poland
4 Department of Applied Ecology, Faculty of Biology and Environmental Protection,
University of Łódź, 90-237 Łódź, 12/16 Banacha Str., Poland
5 Department of Biological and Environmental Sciences, College of Arts and Sciences,
Qatar University, Doha, Qatar
This chapter has been previously published as:
Sroczyńska K, Claro M, Kruk A, Wojtal-Frankiewicz A, Range P and Chícharo L (2017) Indicator macroinvertebrate species in a temporary Mediterranean river: Recognition of patterns in binary assemblage data with a Kohonen artificial neural network.Ecological Indicators, 73: 319-330.
Abstract
Current classifications used in bioassessment programs, as defined by the Water Framework Directive (WFD), do not sufficiently capture the variability present in temporary Mediterranean streams. This may result in inaccurate evaluation of the water quality biological metrics and difficulties in setting reference conditions. The aim of the study was to examine if aquatic invertebrate data of increased taxonomical resolution but expressed on a binary abundance (frequent/rare) scale and referring to good bioindicator species only suffice to indicate clear gradients in water courses with high natural variability such as intermittent Mediterranean streams. Invertebrate samples were collected from 74 sites in the Quarteira River basin, located in southern Portugal. Their classification with the use of a Kohonen artificial neural network (i.e., self-organising map, SOM) resulted in five categories. The variables that drove this categorization were associated primarily with altitude, temperature and conductivity, but also types of substrate, riparian cover and percentage of riffles present. According to the indicator species analysis (ISA), almost all the studied taxa were significantly associated with certain SOM categories except for the category that included sites with disrupted flow regime. The SOM and ISA allowed us to effectively recognize biotic and abiotic patterns. Combined application of both methods may thus greatly enhance the effectiveness and precision of biological surveillance and establish reference sites for specific channel units in streams with high natural variability such as intermittent Mediterranean streams.
2.1. Introduction
Understanding how biotic communities respond to changes in their environment, across various spatial and temporal scales is a principal focus in ecological studies (Poff, 1997). Within the last decade, this knowledge became a prerequisite, as the establishment of the water regulatory acts such as Water Framework Directive (WFD) in Europe, fostered extensive biomonitoring programs, which use aquatic biota, in particular aquatic insects, for the monitoring of human impact. However, most biomonitoring studies are constrained by the natural complexity in macroinvertebrate community patterns, resulting from their diverse traits (Bonada et al. 2007), specific preferences for different type and granulation of substrate, hydrological regimes, ranges
Collier et al., 1998; Cummins and Lauff, 1967; Merrit and Cummins, 1996; Mirra et al., 2014; Pardo and Armitage, 1997; Schröder et al., 2013; Townsend and Hildrew, 1994). In order to address these natural variability in biomonitoring assessment programs several recent river classification systems based on macroinvertebrates were developed (Heino et al. 2003; Johnson et al. 2004; Munne and Prat 2011; Sanchez-Montoya et al. 2007; Verdonschot and Nijboer, 2004).
Classification systems established for Mediterranean regions highlight temporary rivers as the most heterogeneous of all of the Mediterranean river types (Munne and Prat, 2004; Robson et al. 2005; Sanchez-Montoya et al. 2007). Differences in the timing of drying and rewetting in these streams result in sites with contrasting hydrological regimes, i.e. perennial, intermittent (which dry to a series of disconnected pools), or ephemeral (which dry completely)(Gasith and Resh, 1999; Bonada et al. 2007; Gallart et al. 2012). This high diversity of hydrological states and its concomitant influence on habitat structuration results in macroinvertebrate community differences and hamper bioassessment methods and quality metrics to be comparable across various streams (Argyroudi et al. 2009; Beche et al. 2006; Chakona et al. 2008; Mas-Marti et al. 2010; Grubbs 2011; Robson et al. 2005; Watson and Dallas, 2013). High variability obtained in temporary streams also constrains the use of indicator species for defining ecological class boundaries (Sanchez-Montoya 2007). This underscores that the current classification used in WFD bioassessment programs does not sufficiently capture the variability present in temporary streams influenced by Mediterranean climate (Morais et al. 2004; Munne and Prat, 2004).
Furthermore, biomonitoring programs, including rapid bioassessment methods, require cost and time effective strategies. This is the reason why most biomonitoring approaches identify invertebrates up to the family level, instead of the genus or species levels so as to save sample processing time. However, aggregation of species data results in lower taxonomic resolution and consequently a loss of information regarding species responses to environmental factors (Dolédec et al. 2000; Parsons et al. 2003). This is because families contain many species with diverse traits. Imprecise information on the response of macroinvertebrates to environmental filters in a dataset may impede the identification of even the main gradients that influence species occurrences at the catchment scale. Therefore, on the one hand, the importance of gradient delineation for more adequate water bioassessment entails a need for lower-level taxonomic
identification. On the other hand, identification of all of the taxa in an assemblage to a low taxonomic level usually greatly increases sample-processing time and may be unfeasible for the majority of bioassessment programs.
For this reason, we reduced our community data to the most representative indicator species for the entire stream system. Additionally, we used a simplified, binary (frequent/rare) scale for species abundance in order to shorten sample processing time. Assessing the abundance in a ratio scale of measurement would be extremely time consuming especially in cases of dominant genera consisting of many different species (i.e. Baetis spp.). Another limitation results from the fact that macroinvertebrates in temporary ecosystems respond to environmental conditions in a complex and non-linear fashion. Non-linearity and binary scale of measurement limit the possibilities of using conventional multivariate ordination methods (Brosse et al. 2001). To overcome these common drawbacks we used a Kohonen (unsupervised) artificial neural network (i.e., self-organising map algorithm, SOM; Kohonen, 2001) and the indicator species analysis by Tichý and Chytrý (2006). The advantage of both methods is particularly related to a lack of linearity assumptions and possibility of application for a binary matrix (Giraudel and Lek 2001; Tichý and Chytrý, 2006). Moreover, Kohonen artificial neural networks have already been validated for a wide range of ecological issues, including those relating to benthic macroinvertebrates (Bae et al. 2014; Chon 2011; Park et al. 2004, 2006, 2007; Penczak et al. 2006; Tszydel et al. 2009).
In order to improve the precision of biological surveillance and considering time efficiency reasons we examined if aquatic invertebrate data of increased taxonomical resolution but expressed on a binary abundance (frequent/rare) scale and referring to good bioindicator species only suffice to indicate clear gradients in water courses with high natural variability such as intermittent Mediterranean streams. We additionally tested the usefulness of a Kohonen artificial neural network and the indicator species analysis by Tichý and Chytrý (2006) for such a specific purpose.
2.2. Methods 2.2.1. Study area
The Quarteira stream system is located in a lowland coastal area in southern Portugal (37°11’20’’ N, 8°5’33’’W, Fig. 2.1). Its catchment area occupies 324 km2 with an elevation range of 14-515 m. The stream is characterized by a Mediterranean-type climate, where most of the biological, chemical and physical processes are shaped by sequential events of annual flooding and drying (Gasith and Resh, 1999). Wet periods start in late October and last until March, with high discharge peaks, while from late June till September, the dry season proceeds, leaving temporarily disconnected pools or completely dry channels. The average annual air temperatures vary from 8 to 29 °C and average rainfall is 625 mm. Land use is mainly arable land accompanied by shrub and herbaceous vegetation, and mixed forests. Woody vegetation in the catchment consists of olive trees and other cultivation trees, such as almond, cork oak and citrus. While lower reaches are particularly associated with the giant reed (Arundo donax) that in some places forms impenetrable thickets, which are the dominant type of riparian vegetation. Such land use characteristics, along with scant urban development, makes the catchment relatively undisturbed. Catchment topography is characterized by a coastal plain, with a more pronounced relief in the north characterized by limestone and some karstic features. Most of the rock units in the basin are of a calcareous type with a dash of calcite-rich clays.
2.2.2. Macroinvertebrate sampling and criteria for candidate indicator species determination
Macroinvertebrates were sampled over 74 sites distributed along the Quarteira stream system from the middle of April until the beginning of July 2013 (Fig. 2.1).
Fig. 2.1 Map of the 74 sampling sites in the Quarteira river catchment, South Portugal.
Sampled streams included: (1) perennial sites, fed by groundwater sources, which result in constant annual flow, (2) intermittent sites, which dry to a series of disconnected pools, and (3) ephemeral sites, which dry completely. Because the cessation of flow imposes a loss of connectivity between mesohabitats (riffles and pools), it is important to perform sampling during the period of steady flow when all the mesohabitats are connected. Because the process of flow cessation is very rapid, especially at the upstream parts of the catchment, some upstream sites (with a tendency to dry faster) had to be sampled earlier than sites located downstream. Such an approach was necessary to ensure sampling of all of the sites, before some of the sites turn into disconnected pools or completely dry channels. For this reason sites belonging to Freixo Seco and Barranco de Vale Grande were sampled from the middle of April to the beginning of May; Fonte Benemola and Ribeira das Merces streams were sampled from the beginning to middle
of May and more downstream located in Algibre and Quarteira streams were sampled from the middle of May, through June until the beginning of July. Nevertheless, regardless the effort undertaken to sample during a continuous hydrological regime, at the time of sampling, some sites had already lost the hydrological connectivity and the water in these streams was present in the sequence of disconnected pools. Therefore these sites were classified as “sites with disconnected pools present”.
The protocol applied to sample macroinvertebrates was based on ‘Multi-habitat sampling’ (Hering et al. 2003) in accordance to monitoring techniques implemented by the EU Water Framework Directive (Directive 2000/60/EC). At each sampling site the most representative 300 m stretch was chosen. Next visually distinct areas of habitat cover were identified and respective proportion of the occurrence of each habitat in the stretch was recorded. The following habitats were sampled along the entire catchment: 1) mineral ones: megalithal (>40 cm), makrolithal (>20-40 cm), mesolithal (>6-20 cm), mikrolithal (>2-6 cm), akal (0.2-2 cm), psamal (from 6 µm to 2 mm), argyllal (<6 µm), and 2) organic ones: submerged macrophytes, emergent macrophytes, living parts of terrestrial plants, xylal (tree trunks, dead wood, branches), CPOM (deposits of coarse particular organic matter). According to the proportion of habitats present at each sampling site, 20 trawls (1 m long and 0.25 m wide) were sampled using standardized kick sampling technique with a hand-net (0.5 mm mesh, 25 cm width). Furthermore, the bulk of all of the subsamples collected at a given sampling site were treated as one sample, placed in a plastic container and preserved, for further identification, using 96% ethanol.
2.2.3. Criteria for candidate indicator species
The list of candidate species was chosen based on previous habitat-specific studies conducted in the Algibre Stream (pers. comm. Sroczynska et al. 2014). This stream was considered the most representative for the entire Quarteira Stream basin. Therefore, the selection of candidate indicator species was based on macroinvertebrate data from a 2-year (from February until August 2013 and 2014) sampling of that reach. Macroinvertebrate data included 180 habitat stratified samples (90 samples per year). The samples were identified to a lowest taxonomic level possible (mostly genus level, and, in the case of Ephemeroptera and Plecoptera, species level). From a database
criteria: 1) species that were present in more than 10% but not more than 90% of the total number of samples; 2) indicators for good ecological status of water quality (based on species scores used in “Iberian Biomonitoring Working Party” – IBMWP) (Alba-Tercedor et al. 2002) so that the defined gradientswould have ecological importance in terms of water quality assessment; 3) species with a high percentage of contribution to similarity within a given habitat resulted from SIMPER routine analysis (Similarity Percentage Contribution of PRIMER-E, Clarke & Warwick 2001). These criteria aimed to select the species that best represent the variety of habitats and reflect the variability of macroinvertebrate assemblages. Next, the selected 17 species were identified in samples from 74 sites from the Quarteira stream system. A species was considered “frequent” at a given sapling site when its frequency was higher than 5; otherwise when the frequency was in the range of 0-5 the species was considered as “rare”. The data set consisted of indicator species scores (frequent/rare) at each 74 sites was used for further analysis using SOM.
2.2.4. Environmental variables
Along with macroinvertebrate sampling, environmental variables such as water temperature [°C], air temperature [°C], [S m-1], pH and dissolved oxygen concentration [mg dm-3] were recorded using a multiparametric probe (YSI, Professional Plus model). Current water velocity [m s-1] was measured using a two-dimensional flow tracker acoustic-Doppler velocimeter (ADV, Sontek YSI Inc., San Diego, California, United States). Water velocity was measured at two locations at riffle habitats and two locations in pool zones. Water samples for nutrient determinations of nitrite (NO2-N),
nitrate (NO3-N), ammonium (NH4+-N) and phosphate (PO4-P) were taken.
Determinations for nutrients were done on a MERCK Spectroquant Nova 60, using Spectroquant®Test kits. Channel width and water depth was measured at 5 locations along the channel cross-section separate for riffle and pool zones and, for later analysis, the average water depth from each cross section was used. The percentage of shading was reported, along with other environmental variables (Fig. 2.3, Table 2.1, Appendix).
2.2.5. Data analysis
Homogenous groups of invertebrate samples were distinguished with a Kohonen unsupervised artificial neural network, i.e. a self-organising map (Kohonen 1982, 2001).
Artificial neural networks (ANNs) do not require a priori specification of the model underlying the analyzed phenomenon (Brosse et al. 2001). They recognize patterns in variables that are (1) expressed in any (including binary) scale of measurement, (2) exhibit normal or skewed distributions, and/or (3) are related in a complex way. ANNs are built of neurons (data-processing units), which are grouped into layers. The Kohonen ANN in this study was trained with the use of the SOM Toolbox (Vesanto et al. 2000), which was developed by the Laboratory of Information and Computer
Science at the Helsinki University of Technology
(http://www.cis.hut.fi/projects/somtoolbox) (Vesanto et al. 2000). The dataset used for the training consisted of the binary (0 – rare, 1 – abundant) data on 17 taxa in 74 invertebrate samples (i.e. one per sampling site). During the SOM training, the input layer of neurons served only as a flow-through layer receiving the data (Lek and Guégan, 1999). Because each input neuron received data related to one taxon, the number of input neurons was equal to the number of variables in the dataset (i.e. 17). Each input neuron transmitted repeatedly signals to each of the output neurons, which were arranged on a two-dimensional lattice. The intensity (weight) of each connection was strengthened or weakened. With this, a virtual invertebrate sample was created in each output neuron. The dissimilarity of virtual invertebrate samples was increasing along with the distance between the neurons they were created in. Moreover, the virtual invertebrate samples (and thus the respective output neurons) were clustered with use of the hierarchical cluster analysis (Ward linkage method with Euclidean distance measure) (Ward, 1963; Vesanto and Alhoniemi, 2000). Finally, each real invertebrate sample became assigned to the best matching virtual invertebrate sample (and the respective output neuron) (for details see subchapter 2.1 in Vesanto and Alhoniemi, 2000). Consequently, similar real invertebrate samples were located in the same neuron or in adjoining neurons, while those considerably different were grouped in distant regions of the SOM (Penczak et al., 2004; Bedoya et al., 2009; Penczak, 2011; Li et al., 2013; Bae et al., 2014). In the above-described way, the output neurons served for data
structuring and output of results (Lek et al., 2005; Cheng et al., 2012; Stojković et al., 2013; Park et al., 2014).
Additionally, the SOM Toolbox allowed for the visualisation of the occurrence of each taxon in virtual invertebrate samples (and the respective output neurons), in the form of a greyness gradient. Because SOM does not provide any statistical verification of associations of invertebrate taxa with the SOM regions (and respective environmental conditions), we applied the indicator species analysis (ISA) by Tichý and Chytrý (2006) for binary variables. The ISA is based on fidelity expressed with the Φ coefficient of association, which was calculated from 2 × 2 contingency tables for each taxon and each SOM sub-cluster of invertebrate samples, and corrected for differently sized SOM sub-clusters. The Φ coefficient ranges from –1 (perfect negative indication) to 1 (perfect positive indication). Positive Φ values indicate that taxon occurrences are concentrated in a given SOM sub-cluster of invertebrate samples, and negative Φ values indicate that taxon occurrences are under-represented in a given SOM sub-cluster of invertebrate samples. The Monte Carlo randomization test additionally allows for assessment if the maximum Φ coefficient is significantly higher than others observed for a given taxon. If it is, the taxon is considered an indicator for the SOM sub-cluster of invertebrate samples for which the maximum Φ coefficient was observed (Tichý and Chytrý, 2006; Peck, 2011). The ISA analysis was carried out with PC-ORD statistical software (McCune and Mefford, 2011).
The significance of differences between the SOM sub-clusters in abiotic variables was assessed with the Kruskal-Wallis test and the post-hoc Dunn test.
2.3. Results
2.3.1. SOM partitioning
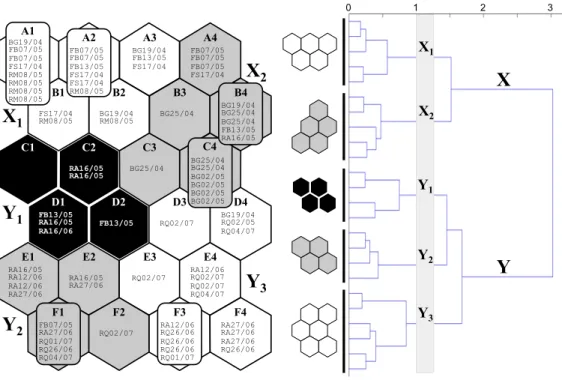
The SOM quantisation and topographic errors were 1.174 and 0.000, respectively. Two main clusters were distinguished in the output layer of SOM: X and Y (Fig. 2.2). Cluster X contained sub-clusters X1 (with neurons A1-A3, B1, B2) and X2 (A4, B3, B4,
C3, C4), while cluster Y contained sub-clusters Y1 (C1, C2, D1, D2), Y2 (E1, E2, F1,
F2) and Y3 (D3, D4, E3, E4, F3, F4) (Fig. 2).
system such as: Baranco de Vale Grande, Fonte Benemola, Freixo Seco and Ribeira das Merces (Fig. 2.2). Sub-cluster X2 contained 17 samples, of which most (11 out of 17)
came from the Barranco de Vale Grande Stream, four from Fonte Benemola, and remaining two from Freixo Seco and Ribeira de Algibre. Sub-cluster Y1 contained the
smallest number of samples (six), including two from Fonte Benemola and four from the Algibre Stream. Sub-clusters Y2 and Y3 encompassed only samples from
downstream parts of the stream system, i.e. Ribeira do Algibre and Ribeira de Quarteira
(Fig. 2.2). 1 0 Euclidean distance 2 3 F4 F3 F2 F1 E4 E3 E2 E1 B4 B3 B2 A2 A3 A4 C1 C2 D2 D1 C3 D4 D3 B1 X1 X2 Y1 Y2 Y3 X1 X2 Y1 Y2 Y3 A1 BG19/04 FB07/05 FB07/05 FS17/04 RM08/05 RM08/05 RM08/05 RM08/05 FB07/05 FB07/05 FB13/05 FS17/04 FS17/04 RM08/05 BG19/04 FB13/05 FS17/04 FB07/05 FB07/05 FB07/05 FS17/04 FS17/04 RM08/05 BG19/04 RM08/05 BG25/04 BG19/04 BG25/04 BG25/04 FB13/05 RA16/05 C4 BG25/04 BG25/04 BG02/05 BG02/05 BG02/05 BG02/05 RA16/05 RA16/05 BG25/04 FB13/05 RA16/05 RA16/06 FB13/05 RQ02/07 BG19/04 RQ02/05 RQ04/07 RA12/06 RQ02/07 RQ02/07 RQ04/07 RQ02/07 RA16/05 RA27/06 RA16/05 RA12/06 RA12/06 RA27/06 RA27/06 RA27/06 RA27/06 RQ26/06 RQ02/07 RA12/06 RQ26/06 RQ26/06 RQ26/06 RQ01/07 FB07/05 RA27/06 RQ01/07 RQ26/06 RQ04/07 X Y
Fig. 2.2 The 24 SOM output neurons (A1-F4) arranged into a two dimensional lattice (6 × 4) with real invertebrate samples assigned. Two clusters (X, Y) and five sub-clusters (X1, X2, Y1, Y2 and Y3) were
distinguished with the hierarchical cluster analysis. The code of a sample consists of: first two initials of the river sampled (BG – Barranco de Vale Grande; FB – Fonte Benemola; FS – Freixo Seco; RA – Ribeira do Algibre; RM – Ribeira das Merces; RQ – Ribeira da Quarteira), followed by two pairs of digits (separated with a slash) for the day and the month of sampling.
There was a clear temporal pattern in sample assignation to the sub-clusters. Samples in sub-clusters X1 and X2 were collected at the beginning of the spring period, from the
middle of May, while the sub-clusters Y2 and Y3 cover the period of early summer,
starting from late May until the beginning of July (Fig. 2.2). Overall, the highest resemblance in this respect was between the sub-clusters Y1 and Y2 (Fig. 2.2).
2.3.2. Environmental variables
Despite the fact that the SOM sub-clusters were distinguished on the basis of biotic data, they significantly differed also in the abiotic conditions at the sites that the samples were collected in. For some variables a clear trend was recorded for the sequence of sub-clusters X1-Y3. This trend was downward for elevation and upward for
water temperature and conductivity (Fig. 2.3).
Therefore, samples assigned to sub-cluster X1, which came from streams located at the
highest elevations, recorded the lowest water temperature and conductivity. As the elevation was declining, temperature and conductivity were continually increasing across the rest of the sub-clusters eventually reaching their maximum in sub-cluster Y3
(Fig. 3). Correspondingly, Kruskall–Wallis and post-hoc tests revealed significant differences (p<0.05) in water temperature and conductivity between the pairs of the most marginal sub-clusters X1, X2 and Y2, Y3. Elevation significantly differed between
sub-cluster X1 and Y2, X1 and Y3, and X2 and Y3 (Fig. 3). Median concentration of
dissolved oxygen slightly increased from sub-cluster X1 to Y1, and then more rapidly
decreased from sub-cluster Y1 to Y3 (Fig. 3). A significant difference in dissolved
oxygen was only reported between sub-cluster Y1 and Y3, and the highest variation in
dissolved oxygen was reported for X2. There were no differences in pH except for the
one between sub-clusters X1 and X2. Channel width, measured at pool section, was
significantly lower for sub-clusters X1 and X2 relative to Y2 and Y3. The percentage of
shading decreased downstream, displaying significant differences between higher riparian cover (X1) and more open sites (Y2, Y3) (Table 1). Significant differences
between sub-clusters were detected for ammonia, phosphates and channel width at riffle section. Nitrites, although statistically different among habitats were mostly below the detection limit. The remaining variables, such as current velocity and depth at riffle and pool section were not significantly different (p>0.05) among any of the sub-clusters (Table 1).
Environmental Variable X1 X2 Y1 Y2 Y3 Chi-squared P
ammonia [mg dm-3] 0.13 (0.08-0.44) 0.55 (0.14-0.72) 0.06 (0.05-0.07) 0.08 (0.05-0.08) 0.08 (0.06-0.10) 24.83 <0.001
nitrite [mg dm-3] 0.01 (0.00-0.01) 0.01 (0.01-0.01) 0.00 (0.00-0.01) 0.01 (0.00-0.01) 0.01 (0.01-0.01) 14.77 0.005
nitrate [mg dm-3] 1.30 (0.18-2.70) 0.34 (0.26-0.44) 1.30 (0.34-3.17) 0.50 (0.28-2.12) 0.50 (0.10-1.45) 3.32 0.506
phosphorus [mg dm-3] 0.14 (0.10-0.99) 0.08 (0.06-0.15) 0.12 (0.06-0.12) 0.09 (0.02-0.19) 0.04 (0.00-0.08) 15.32 <0.05
current velocity (riffle) [m s-1] 0.48 (0.41-0.57) 0.49 (0.40-0.52) 0.73 (0.60-0.86) 0.50 (0.39-0.72) 0.38 (0.28-0.50) 7.57 0.109
current velocity (pool) [m s-1] 0.06 (0.04-0.12) 0.12 (0.11-0.13) 0.14 (0.09-0.20) 0.06 (0.02-0.12) 0.05 (0.03-0.06) 3.53 0.473
depth (riffle) [m] 0.11 (0.10-0.13) 0.11 (0.10-0.14) 0.16 (0.15-0.17) 0.11 (0.09-0.25) 0.10 (0.08-0.11) 5.41 0.248
depth (pool) [m] 0.26 (0.20-0.38) 0.27 (0.23-0.34) 0.45 (0.29-0.67) 0.23 (0.13-0.30) 0.41 (0.30-0.47) 6.39 0.172
width (riffle) [m] 3.70 (2.90-4.40) 4.20 (3.00-4.60) 7.20 (6.30-7.60) 6.20 (5.30-8.10) 6.50 (5.60-9.00) 11.9 <0.05
shading [%] 25 (20-70) 30 (6.00-50) 21 (10-30) 4 (2.00-6.00) 5 (2-10) 20.87 <0.001
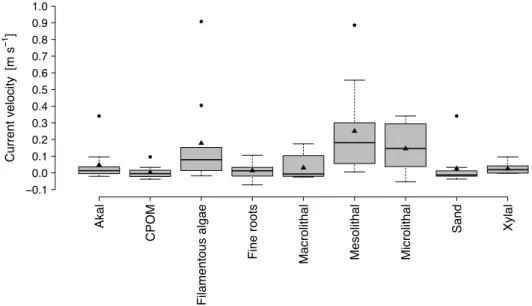
Figure 2.3 Differences between the SOM sub-clusters in abiotic variables, which were not presented directly to the Kohonen artificial neural network. Triangle – mean, horizontal line – median, black points– outliers, box – interquartile range, whiskers extend from minimum to maximum values. The width of each box is scaled in proportion to the number of replicates for each habitat. H – statistics of the Kruskal-Wallis test (df = 4, NX1 = 21, NX2 = 17, NY1 = 6, NY2 = 12, NY3 = 18) applied in testing the
differences between SOM sub-clusters. For SOM sub-clusters that are underlined with the same line no difference at p ≤ 0.05 was recorded in post-hoc tests. For more abiotic variables see Table 2.1.
Table 2.1 Summary of environmental variables not included in boxplot presentation (based on measurements at 74 sampling points located in Quarteira River Basin in 2013). Medians (first and third quartile) are given for each SOM sub-cluster X1-Y3.
2.3.3. Indicator species analysis
All the taxa, except one (Ferrisia wautieri), were significantly associated with particular SOM sub-clusters (Table 2.2 and Fig. 2.4). The highest numbers of indicator species were identified for sub-clusters Y2 (seven) and X1 (five, Table 2.3). Three taxa
were significantly associated with Y1, one with Y3 and none with X2. Typical rheophilic
species such as Habrophlebia fusca, Isoperla moselyi, Tyrrhenoleuctra minuta were significantly more common in sub-cluster X1, linked to colder water and more abundant
riffle sections, in comparison with cluster Y characterized by higher water temperatures and prevalence of pool sections (Fig. 2.4, Table 2.2, 2.3). X2 was the only sub-cluster
that not only did not have any species significantly associated with it, but additionally was avoided by almost all of the taxa (Fig. 2.4, Table 2.2). Characteristic taxa for the Y1
sub-cluster included: rheophilic and predator Oulimnius sp. (adult) and Melanochelia
riparia, and more associated with deep, lentic habitats Centroptiulm luteolum.
Sub-cluster Y2 was favorable for all the taxa belonging to Trichoptera group: Hydropsyche
lobata, Chimarra marginata, Hydroptila vectis, as well as Oulimnius sp. (larvae), Caenis luctuosa, Baetis atrebatinus and Physella acuta (Fig. 2.4, Table 2.2). Conditions
associated with Y3 (the lowest elevation, abundant aquatic vegetation) were strongly
preferred by Atyaephyra desmarestii, which is tolerant to wide salinity and temperature ranges (Fig. 2.4, Table 2.2, 2.3).