Received: 18 September 2007 / Accepted: 19 November 2007 / Published (online): 01 March 2008
Analysis of drafting effects in swimming using computational fluid dynamics
António José Silva 1,2 , Abel Rouboa 1, António Moreira 3, Victor Machado Reis 1,2, Francisco Alves 4, João Paulo Vilas-Boas 5 and Daniel Almeida Marinho 1,21 University of Trás-os-Montes and Alto Douro, Vila Real, Portugal, 2 Centre of Research in Sports, Health and Human
Development, Vila Real, Portugal, 3 Sports Science Institute of Rio Maior, Portugal, 4 Faculty of Human Kinetics,
Lis-bon, Portugal, 5 Faculty of Sports, University of Porto, Portugal.
Abstract
The purpose of this study was to determine the effect of drafting distance on the drag coefficient in swimming. A k-epsilon turbu-lent model was implemented in the commercial code Fluent®
and applied to the fluid flow around two swimmers in a drafting situation. Numerical simulations were conducted for various distances between swimmers (0.5–8.0 m) and swimming veloci-ties (1.6–2.0 m.s-1). Drag coefficient (Cd) was computed for
each one of the distances and velocities. We found that the drag coefficient of the leading swimmer decreased as the flow veloc-ity increased. The relative drag coefficient of the back swimmer was lower (about 56% of the leading swimmer) for the smallest inter-swimmer distance (0.5 m). This value increased progres-sively until the distance between swimmers reached 6.0 m, where the relative drag coefficient of the back swimmer was about 84% of the leading swimmer. The results indicated that the Cd of the back swimmer was equal to that of the leading swimmer at distances ranging from 6.45 to 8.90 m. We conclude that these distances allow the swimmers to be in the same hy-drodynamic conditions during training and competitions.
Key words: Training, human body, drag, tandem, finite element modeling.
Introduction
Drafting is related to situations where an athlete displaces himself immediately behind another. Transference of forces occur between athletes without real physical con-tact between them, mainly in peloton (PACK, cycling) conditions (road cycling) or in group displacement, as those in the triathlon swimming or in “open water” com-petitions. During training, due to space economy, the swimmers usually perform the major part of total swim-ming volume “in roundabout”. In the swimswim-ming course of the triathlon, carried out in natural waters (sea, rivers or lakes), the inexistence of lane ropes makes swimming “on the trail” of the best swimmer a usual situation. Coaches often advise swimmers to displace more than 5 m apart from the following competitor.
The few experimental studies conducted in swim-mers and triathlon athletes showed that the distance be-tween swimmers significantly influences the energy cost of the swimmer submitted to the suction effect (Bassett et al., 1991; Chatard and Wilson, 2003; Hausswirth et al., 1999; 2001) and it helps proper technique maintenance when fatigue appears (Chollet et al., 2000). On the other hand, it also helps sparing energetic resources that can be used as an advantage in later phases of the competition, as
it happens in triathlon where the athletes pass from the swimming to the cycling course (Delextrat et al., 2003) and afterwards to the race course (Hausswirth et al., 2001). In competitive swimmers, the wake generated by the leading swimmer induces significant reductions in energy cost (from a mean value of 3.12±0.66 to 2.85±0.63 l.O
2.min-1), in blood lactate concentration (from a mean
value of 5.0 ± 0.5 to 3.4 ± 0.6 mmol.l-1) and in perceived
exertion ratings (from a mean value of 14.9 ± 0.5 to 11.7 ± 0.4) in the back swimmer (Bassett et al., 1991).
The typical approach to study the dynamical inter-action between bodies moving in a queue in a fluid is to experimentally investigate the forces generated as a func-tion of the distance between two or more bodies. An al-ternative option to deal with this problem is to apply nu-merical simulation techniques to determine the forces exerted by the fluid on moving bodies. The Computa-tional Fluid Dynamics (CFD) models started to be used in the middle of the 90s in the study of insects and birds during flight (Liu et al., 1995; 1997), as well as in the computation of the aerodynamic and hydrodynamic forces involved in the propulsion of animals moving through body undulation (Cheng and Chahine, 2001; Liu et al., 1996). Recently, medical applications were also described by this method, analyzing the fluid flow inside the human body (Berthier et al., 2002; Marshall et al., 2004).
In swimming research, the numerical simulation started to solve problems that were expensive and time-spending. The pioneer study of Bixler and Schloder (1996) with CFD tools was performed in conditions of steady flow and unsteady conditions (with acceleration) in an external surface of a disc with an area similar to a typical swimmer hand. The same authors revisited this topic (Bixler and Riewald, 2002) and forwarded to the calculation of the drag and lift coefficients through the application of a two dimensional CFD hand/forearm analysis. These simulations confirmed the importance of the CFD in swimming research. Nevertheless few publi-cations have addressed this issue, either studying the production of propulsive forces (Alves et al., 2007; Rouboa et al., 2006; Sato and Hino, 2003; Silva et al., 2005) or the drag suffered by the swimmers’ body (Lyttle and Keys, 2004).
Therefore, the aims of the present study were: (i) to describe the pressure profile around the swimmers in drafting through CFD analysis; (ii) to assess the drafting distances effect in the drag coefficient; (iii) to assess the distance in which the drag coefficient of the back swim-mer is equal to the drag coefficient of the leading
swimmer, considering various flow velocities.
Methods
The passive drag coefficient (Cd) produced by the interac-tion of two swimmers in drafting was determined in this study. The Cd was computed using equation 1:
Cd = FD / (0.5.ρ.S.V2) (1)
Where FD is the drag force, ρ is the fluid density, S is the projec-tion surface of the model and V is the flow velocity.
Computational Fluid Dynamics methodology con-sists in a mathematical model applied to the fluid flow. In a given computational domain, it implements the Navier-Stokes equations with discretized algebraic expressions and solves them by iterative calculations. This computa-tional domain consists in a two dimensional grid or mesh of cells that simulate the fluid flow. The fluid mechanical properties, the flow characteristics along the outside grid boundaries and the mathematical relationship to account for the turbulence were considered.
Mathematical model
It is usually stated that a system of equations representing turbulent models can not predict the details of an unsteady flow, such as the flow around structures, even when in-cluding a low Reynolds number (Re). To overcome this difficulty, the incompressible Reynolds averaged Navier-Stokes equations with the standard k-epsilon (k-ε) model were considered and implemented in the commercial code
Fluent® (Moreira et al., 2006). Accordingly, the continu-ity equation, the momentum conservation equations and the turbulent and dissipated energy (k-ε) conservation equations (for an incompressible fluid in Cartesian coor-dinates) were written in a conservative form as:
divV = 0 (2)
(3)
(4) (5)
Where k is the turbulent kinetic energy and ε is the turbulent ki-netic energy dissipation ratio. x and y represent the horizontal and vertical coordinates, respectively, Vx and Vy represent the x and y components of the velocity V. µt is the turbulent viscosity, ρ repre-sents the fluid density, ν is the kinematic viscosity and Φ is the pressure strain. C2, Cµ, σε and σK are model constants, 1.92, 0.09, 1.30 and 1.00, respectively.
Resolution method
The numerical method used by Fluent® was based on the
finite elements approach. The steady solutions of the governing system equations were given in each square element of the discretized full domain. To solve the linear system, Fluent® code adopted an AMG (Algebraic
Multi-Grid) solver. Horizontal and vertical velocities, pressure (p), turbulent kinetic energy (k) and turbulent kinetic energy dissipation ratio (ε) were considered as degrees of freedom (DOF) for each grid element.
The convergence criterion of AMG was set at 10-3
for the relative error between successive iterations and for all the variables (Vx, Vy, p, k and ε).
The numerical simulation was carried out in two dimensions (2D) for the computational domain in steady flow conditions.
Application
The software Fluent® needs a first approach for treatment
of the geometry and conformation of the mesh for the model, requiring the use of the Fluent® pre-processor
Gambit. The accomplishment of the model in two
dimen-sions in the Gambit allowed to generate meshes and to define the necessary boundary conditions for the applica-tion in Fluent®.
Boundary conditions
The boundary conditions are those presented in Figure 1. In the upper and lower walls the velocity value in the two
Figure 2. Mesh with a 0.05 spacing in drafting swimming. Distance between swimmers equal to 0.5 m.
coordinates was considered null. The lower wall repre-sents the bottom of the swimming pool and the upper wall represents the top of the pool. In the interface between air and water the fluid velocity is considered equal to the swimmer’s absolute velocity of displacement. In the entry (left), the velocity assumed, on the y coordinate (perpen-dicular to the model), a null value and, on the x coordi-nate (in the model direction), the value ranged from 1.60 m·s-1 to 2.00 m·s-1, with increments of 0.10 m·s-1. In the
exit (right) the relative pressure (difference between the absolute pressure or the pressure of the fluid and the envi-ronmental pressure, P-Pa) was zero to assure that there
was not any flow conflict by reflection. The horizontal distance between swimmers changed from 0.50 m to 8.00 m. This distance was measured from the toe tips of the leading swimmer to the head vertex of the back swimmer. The position of the leading swimmer remained constant during all simulations. The model representing the swim-mers was 1.80 m height and 0.5 m width, with the arms aside the trunk. These anatomical characteristics were chosen to be within the anthropometrical data of a group of elite national level swimmers.
Under these conditions, the Cd values of both swimmers were calculated for different flow velocities (1.60 m·s-1 ≤ V ≤ 2.00 m·s-1) and different distances
be-tween swimmers (0.50 m ≤ ∆x ≤ 8.00 m). The Cd of the leading swimmer was considered constant for all dis-tances between swimmers.
The Cd values were calculated by integration of the relative pressure through the body surface using equation 6:
Cd = [∫s(P-Pa)dS] / (0.5.ρ.S.V2) (6) In the CFD application the mesh with a spacing of
0.05 generated 12812 cells (Figure 2). The computation time was about 3 min for each simulation, changing the number of iterations from 100 to 130.
Statistics
To estimate the Cd of the back swimmer and compare it with the assumed Cd of the leading swimmer, a curve fitting based on the application of various polynomials was performed. The evaluation of the quality of the ad-justment and the selection of the polynomial degree were done aiming the lower prediction error (dispersion of the residues around the adjustment).
Results
Considering the pressure profile around the two swim-mers, the pressure in the attack board (head) of the lead-ing swimmer was maximal. The lower pressure zones coincided with the flow around the back swimmer. The inherent conditions in the leading swimmer were different from the conditions verified in the back swimmer (see Figure 3).
The Cd of the leading swimmer (on left, in Figure 1) was considered constant for all the distances between swimmers and for the same flow velocity. However, as the flow velocity increased the Cd of the leading swim-mer decreased (see Table 1).
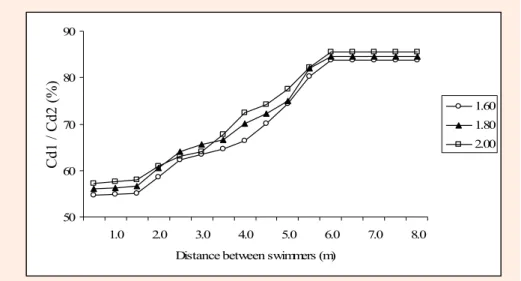
The CFD approach also showed that, for a 0.50 m distance, the back swimmer’s Cd corresponds to a mean value of 55.97±1.03% of that of the leading swimmer. This value progressively increased until the distance be-tween swimmers reaches 6.0 m, where the Cd of the back swimmer corresponded to a mean value of 84.38±0.71% of that by the leading swimmer (see Figure 4).
However, it was possible to verify that for all the
Table 1. Distance in meters in which the Cd of the back swimmer is similar to the leading swim-mer Cd for each one of the studied flow velocities, obtained using the polynomial modeling.
Velocity (m·s-1)
1.60 1.70 1.80 1.90 2.00
Leading swimmer Cd .912 .883 .857 .833 .811
Distance (m) 7.29 7.83 8.90 8.25 6.45
velocities and distances higher than 6 m (until 8 m), the back swimmer’s Cd remained almost constant and did not tend to the value presented by the leading swimmer. To calculate the distances in which the back swimmer’s Cd equals the value of the leading swimmer, a fitting of the Cd curves of the back swimmer was carried out (accord-ing to a polynomial function of the values found until the 6 m distance). Table 2 shows the polynomials retained by this model.
The results indicated that the Cd of the back swimmer (considering the various flow velocities) was equal to that by the leading swimmer in distances ranging between 6.45 m and 8.90 m (see Table 1).
Discussion
The aims of the present study were: (i) to describe the pressure profile around the swimmers in drafting through CFD analysis; (ii) to assess the drafting distances effect in the Cd; (iii) to assess the distance in which the Cd of the back swimmer is equal to the Cd of the leading swimmer, considering different flow velocities.
The major finding of this work was that the Cd of the back swimmer progressively increases concomitantly with the distance between swimmers, until a distance between 6.45 m and 8.90 m is reached. Afterwards the Cd of both swimmers remains equal.
In the present study we only analyzed a passive drag situation. Therefore, we attempted to compare our numerical results with experimental data found in passive drag analyses.
Comparing the values of the Cd obtained by the CFD analysis with experimental data from other studies,
we found values that agree with the previous research (Clarys, 1979; Mollendorf et al., 2004). Clarys (1979) reported Cd values between 0.58 and 1.04 in the human body in passive towing with a Reynolds number varying between 6.6 x 10⁵ and 3.9 x 10⁶. Recently, Mollendorf et
al. (2004) has found Cd mean values in passive towing between 0.83 ± 0.04 and 0.90 ± 0.08 in a group of male adult swimmers using various types of competition suits.
The comparison between our data and data from active drag measurements is not simple, since there are different approaches to evaluate active drag, which can lead to different results (Toussaint et al., 2004). On the other hand, it is difficult to experimentally evaluate active drag with the swimmer totally submerged, which is what happens in our study. In the future, we aim to improve numerical simulations, allowing, for instance, to evaluate underwater active drag while the swimmer is kicking. With these data, we will be able to compare passive and active drag using the same methodology.
The Cd behavior verified in the present study with different flow velocities showed that when velocity in-creases, Cd dein-creases, which is consistent with previous observations with non-human models. In lifeless objects with regular geometry (not biological) the Cd varies with the inverse rate of Re (Wu, 1971). The same author pre-sented Cd data of dead fishes (equivalent to passive tow-ing) in a moving water tank. It was verified that a gradual reduction of this variable occurred when the Re increased. In that study the slope of the regression line was about -0.40, changing the Cd values between 0.1 and 0.5. Jiskoot and Clarys (1975) described, in the human body when completely submerged at a 0.60 m depth and in passive towing (velocity range between 1.50 m.s-1 and 1.90 m·s-1),
Figure 4. Percentual relation between the leading swimmer Cd (Cd1) and the back swimmer Cd (Cd2) for ve-locities of 1.60, 1.80 and 2.00 m·s-1. 50 60 70 80 90 1.0 2.0 3.0 4.0 5.0 6.0 7.0 8.0
Distance between swimmers (m)
1.60 1.80 2.00 Cd 1 / Cd2 (%)
Table 2. Modeling polynomials of absolute Cd values of the back swimmer for each velocity simulation, and for average velocity (residuals are shown).
Velocity (m·s-1) Polynomial Norm of residuals
1.60 Cd = 0.0057737*x4+0.0061124*x3+0.007867*x2+0.076781*x+0.58322 .031076 1.70 Cd = 0.004*x4-0.049*x3+0.20*x2-0.25*x+0.57 .028054 1.80 Cd = 0.00077*x4 - 0.0094*x3 + 0.042*x2 - 0.039*x + 0.49 .029074 1.90 Cd = 0.00052*x4 - 0.0063*x3 + 0.029*x2 - 0.018*x + 0.47 .031232 2.00 Cd = 9.5e-005*x4 - 0.0014*x3 + 0.011*x2 - 3.5e-005*x + 0.46 .033634 Average Cd = 0.00042*x4- 0.005*x3 + 0.024*x2 - 0.012*x + 0.48 .010569
an inverse relationship between the Cd and the velocity values calculated by drag (D) and the mean body dimen-sions of the sample reported by Clarys (1978). The Cd values changed between the unit and 0.95, with a slope in the regression with the velocity of -0.17. This value is close to the value (-0.16) found by Lyttle et al. (1999), when they calculated the Cd by the D values reported for swimmers in passive towing with an equal depth of 0.6 m. In that study, the range of velocities varied between 1.60 m·s-1 and 3.10 m·s-1. Therefore, the inverse association
between the Cd and the velocity of the flow that we have found seems to correspond to what occurs in an experi-mental situation. Though, few studies have addressed the human body completely submerged, in passive towing. However, the values presented in the present study showed a gradual reduction of Cd with velocity increase and presented, also, a higher slope (-3.96). This slope is similar to experimental values found in lifeless objects with a regular geometry or in fishes with bodies of higher hydrodynamic profile. Therefore, it is possible that the human body representation (model) that was used is still much stylized. On the other hand, the use of a three di-mensional model with the arms extended at the front, in the streamlined position, could lead to improve CFD data. This is another issue that should be addressed in future studies.
Comparing our Cd values observed for different distances between swimmers with the experimental stud-ies, a general agreement can be found. Chatard and Wil-son (2003) studied the effect of the distance between swimmers displacing in a queue on the metabolic and hydrodynamic responses of the swimmer displacing im-mediately behind. The distances that were evaluated were 0.0, 0.5, 1.0 and 1.5 m. The drag was explored by a pas-sive towing situation. The authors found a decrease of 20% to 21% in passive drag in distances between 0 m and 0.5 m and concluded that these distances were the most advantageous to the swimmer submitted to the suction effect. In the present study, as the distance between swimmers increased, the Cd value of the back swimmer approaches that of the leading swimmer. To a minimal distance between swimmers (0.50 m), the Cd mean value of the back swimmer is only 55.97 ± 1.03% of the value of the leading swimmer. Thus, the increase of this dis-tance may induce an increase in the effort of the back swimmer. When the distance reached a value of 6.00 m, the Cd percentage difference between both swimmers increased to values from 83.77% up to 85.45%, depend-ing on the velocity, as it can be verified in figure 4.
Considering only the calculations of the drafting effect based on the application of numerical simulations we concluded that Cd values of both swimmers do not equalize. This may be because it is a free flow and/or due
to the fact that we did not consider other factors that in-teract with the flow (i.e. the swimmers roughness and the distance to the wall - right side of the domain). This latter situation, particularly, could have an important effect on Cd. Indeed, the approach of the back swimmer to the wall of the right side could have prevented the velocity con-vergence and the pressure reestablishment. This fact leaded us to remove the values higher than 6 m from the model, as those values could influence the natural con-vergence observed until the 6.00 m distance between swimmers. Therefore, in future studies, this issue should be considered and a domain with larger dimensions may be used to enable pressure reestablishment and velocity convergence. Nevertheless, it was interesting to observe that our data revealed that the distance in which the swimmers were in the same hydrodynamics conditions ranged from 6.45 m to 8.90 m.
This study is also limited to the analysis of entirely submerged bodies. In fact, this is a different situation from that observed at the water surface. To our knowl-edge, up to the present, no work was able to analyze the human body in the interface water-air. We chose to ana-lyze the body totally submerged in the water as a first approach to study the human movement in swimming, as this approach simplifies the simulation conditions. More-over, we simulated a domain with a high depth to mini-mize the wave drag and to include the water flow under and above the model. Future models will be applied for bodies on/at the water surface, taking into account the above and under water body volumes and fluid character-istics.
Conclusion
Although simulating a typical “roundabout” similar to what often occurs in the organization of the swimmers during a training unit, this study limited the analysis to the steady flow conditions around an entirely submerged rigid body, excluding the relative movements of the body seg-ments. However, it was possible to predict that a queue distance of 6.00 m may cause in the back swimmer a Cd of ≈84% of that of the leading swimmer. As a suggestion to specific swimming training sets, the back swimmer must start swimming at least when the leading swimmer reaches a 10 m distance from the starting wall, rather than the 5 m distance commonly used in training. This distance will allow both swimmers to be in the same hydrody-namic conditions. Nevertheless, concerning open water competitions, the athletes could take important advan-tages of swimming in a drafting situation.
With the present study we confirmed the impor-tance of the CFD methodology of numerical simulation to
enable the analysis of the fluid forces around objects in water, as it happens in swimming.
Acknowledgments
This work was supported by the Portuguese Government by a grant of the Science and Technology Foundation (POCTI/DES/58872/2004; SFRH/BD/25241/2005).
References
Alves, F., Marinho, D., Leal, L., Rouboa, A. and Silva, A. (2007) 3-D computational fluid dynamics of the hand and forearm in swimming. Medicine and Science in Sports and Exercise
39(Suppl. 1), S9.
Bassett, D.R., Flohr, J., Duey, W.J., Howley, E.T. and Pein, R.L. (1991) Metabolic responses to drafting during front crawl swimming.
Medicine and Science in Sports and Exercise 23(6), 744-747.
Berthier, B., Bouzerar, R. and Legallais, L. (2002) Blood flow patterns in an automatically realistic coronary vessel: influence of three different reconstruction methods. Journal of Biomechanics
35(10), 1347-1356.
Bixler, B.S. and Riewald, S. (2002) Analysis of swimmer’s hand and arm in steady flow conditions using computational fluid dynam-ics. Journal of Biomechanics 35(5), 713-717.
Bixler, B.S. and Schloder, M. (1996) Computational fluid dynamics: an analytical tool for the 21st century swimming scientist. Journal
of Swimming Research 11(1), 4-22.
Chatard, J.C. and Wilson, B. (2003) Drafting distance in swimming.
Medicine and Science in Sports and Exercise 35(7), 1176-1181.
Cheng, J.Y. and Chahine, G.L. (2001) Computational hydrodynamics of animal swimming: boundary element method and three-dimensional vortex wake structure. Comparative Biochemistry
and Physiology. Part A: Molecular & Integrative Physiology
131(1), 51-60.
Chollet, D., Hue, O., Auclair, F., Millet, G. and Chatard, J.C. (2000) The effects of drafting on stroking variations during swimming in elite male triathletes. European Journal of Applied Physiology
82(5-6), 413-417.
Clarys, J.P. (1978) An experimental investigation of the application of fundamental hydrodynamics to the human body. In: Swimming
Medicine IV. Eds: Eriksson, B. and Furberg, B. Baltimore:
Uni-versity Park Press. 386-394
Clarys, J.P. (1979) Human morphology and hydrodynamics. In:
Swim-ming III. Eds: Terauds, J. and Bedingfield, E.W. Baltimore:
University Park Press. 3-41.
Delextrat, A., Tricot, V., Bernard, T., Vercruyssen, F., Hausswirth, C. and Brisswalter, J. (2003) Drafting during swimming improves efficiency during subsequent cycling. Medicine and Science in
Sports and Exercise 35(9), 1612-1619.
Hausswirth, C., Lehenaff, D., Dreano, P. and Savonen, K. (1999) Effects of cycling alone or in a sheltered position on subsequent run-ning performance during a triathlon. Medicine and Science in
Sports and Exercise 31(4), 599-604.
Hausswirth, C., Vallier, J.M., Lehenaff, D., Brisswalter, J., Smith, D., Millet, G. and Dreano, P. (2001) Effect of two drafting modali-ties in cycling on running performance. Medicine and Science in
Sports and Exercise 33(3), 485-492.
Jiskoot, J. and Clarys, J.P. (1975) Body resistance on and under the water surface. In: Swimming II. Eds: Lewillie, L. and Clarys, J.P. Baltimore: University Park Press. 105-109.
Liu, H., Sunada, S. and Kawachi, K. (1995) Time-accurate solutions to the incompressible Navier–Stokes equations with the pseudo-compressibility method. American Society of Mechanical
Engi-neers/Japan Society of Mechanical Engineers Fluids Engineer-ing Conference, August 13-18, South Carolina-USA.
Proceed-ings. 105-112.
Liu, H., Wassersug, R. and Kawachi, K. (1996) A computational fluid dynamics study of tadpole swimming. The Journal of
Experi-mental Biology 199(6), 1245-1260.
Liu, H., Wassersug, R. and Kawachi, K. (1997) The three-dimensional hydrodynamics of tadpole locomotion. The Journal of
Experi-mental Biology 200(22), 2807-2819.
Lyttle, A. and Keys, M. (2004) The use of computational fluids dynam-ics to optimize underwater kicking performance. XXIInd
Inter-national Symposium on Biomechanics in Sports - ISBS 2004, August 9-12, Ottawa-Canada. Proceedings. 403-411.
Lyttle, A.D., Blanksby, B.A., Elliott, B.C. and Lloyd, D.G. (1999) Optimal depth for streamlined gliding. In: Biomechanics and
Medicine in Swimming VIII. Eds: Keskinen, K.L., Komi, P.V.
and Hollander, A.P. Jyvaskyla: Gummerus Printing. 165-170. Marshall, I., Zhao, S., Papathanasapoulou, P., Hoskins, P. and Xu, Y.Y.
(2004) MRI and CFD studies of pulsative flow in healthy and stenosed carotid bifurcation models. Journal of Biomechanics
37(5), 679-687.
Mollendorf, J.C., Termin, A.C., Oppenheim, E. and Pendergast, D.R. (2004) Effect of swim suit design on passive drag. Medicine and
Science in Sports and Exercise 36(6), 1029-1035.
Moreira, A., Rouboa, A., Silva, A.J., Sousa, L., Marinho, D., Alves, F., Reis, V., Vilas-Boas, J.P., Carneiro, A. and Machado, L. (2006) Computational analysis of the turbulent flow around a cylinder.
Portuguese Journal of Sport Sciences 6(Suppl. 1), 105.
Rouboa, A., Silva, A., Leal, L., Rocha, J. and Alves, F. (2006) The effect of swimmer’s hand/forearm acceleration on propulsive forces generation using Computational Fluid Dynamics. Journal
of Biomechanics 39(7), 1239-1248.
Sato, Y. and Hino, T. (2003). Estimation of thrust of swimmer's hand using CFD. Second International Symposium on Aqua
Bio-Mechanisms, September 14-17, Honolulu-USA. Proceedings.
71-75.
Silva, A.J., Rouboa, A.F., Leal, L., Rocha, J., Alves, F.B., Moreira, A.M. and Reis, V., Vilas-Boas, J.P. (2005) Measurement of swimmer's hand/forearm propulsive forces generation using computational fluid dynamics. Portuguese Journal of Sport
Sci-ences 5(3), 288-297. (In Portuguese: English abstract).
Toussaint, H., Roos, P. and Kolmogorov, S. (2004) The determination of drag in front crawl swimming. Journal of Biomechanics 37(11), 1655-1663.
Wu, TY. (1971) Hydromechanics of swimming fishes and cetaceans.
Advances in Applied Mechanics 11, 1-63.
Key points
• The drag coefficient of the leading swimmer de-creased as the flow velocity inde-creased.
• The relative drag coefficient of the back swimmer was least (about 56% of the leading swimmer) for the smallest inter-swimmer distance (0.5 m).
• The drag coefficient values of both swimmers in drafting were equal to distances ranging between 6.45 m and 8.90 m, considering the different flow velocities.
• The numerical simulation techniques could be a good approach to enable the analysis of the fluid forces around objects in water, as it happens in swimming.
AUTHORS BIOGRAPHY
António José SILVA Employment
Associated and Aggregated Professor at the Sport Sciences Department of the University of Trás-os-Montes and Alto Douro (UTAD - Portugal).
Degree
PhD
Research interests
Physiological and biomechanical indica-tors of energy cost during physical activi-ties, namely in swimming.
Abel ROUBOA Employment
Associated Professor at the Engineering Department of the University of Trás-os-Montes and Alto Douro, Portugal.
Degree
PhD
Research interests
Applied Mathematics, Parallel Computa-tion and Biomechanics, namely, applied on Sport and Biomedical domains.
E-mail: rouboa@utad.pt
António MOREIRA Employment
Assistant Professor at the Sports Science Institute of Rio Maior (Portugal).
Degree
MD
Research interests
The application of numerical simulation techniques on sports domain.
E-mail: antmoreira@esdrm.pt Victor Machado REIS Employment
Assistant Professor at the Sport Sciences Department of the University of Trás-os-Montes and Alto Douro, Portugal.
Degree
PhD
Research interests
The physiological and biomechanical indicators of energy cost during physical activities.
E-mail: vreis@utad.pt Francisco ALVES Employment
Associated Professor at the Faculty of Human Kinetics of the Technical Univer-sity of Lisbon (FMH-UTL, Portugal).
Degree
PhD
Research interests
The biomechanical and physiological determinants of swimming economy and the evaluation of the training process.
E-mail: falves@fmh.utl.pt João Paulo VILAS-BOAS Employment
Full Professor at the Faculty of Sport of the University of Porto (Portugal).
Degree
PhD
Research interests
Swimming Biomechanics and Bioenerget-ics.
E-mail: jpvb@fade.up.pt Daniel Almeida MARINHO Employment
PhD student of the University of Trás-os-Montes and Alto Douro, Portugal.
Degree
MSc
Research interests
The biomechanical and physiological determinant factors of the sports ance, specially the swimming perform-ance.
E-mail: dmarinho@utad.pt
António José Silva
Universidade de Trás-os-Montes e Alto Douro, Departamento de Ciências do Desporto – CIFOP, R. Dr. Manuel Cardona, 5000 Vila Real, Portugal