M
FINANCE
M
ASTER
’
S
F
INAL
W
ORK
D
ISSERTATION
T
HE
I
MPACT OF
T
OP
M
ANAGER
’
S MOOD ON
F
IRM
P
ERFORMANCE
R
ICARDO
M
IGUEL
M
ARQUES
V
IDIGAL DA
S
ILVA
ii
M
FINANCE
M
ASTER
’
S
F
INAL
W
ORK
D
ISSERTATION
T
HE
I
MPACT OF
T
OP
M
ANAGER
’
S
M
OOD ON
F
IRM
P
ERFORMANCE
R
ICARDO
M
IGUEL
M
ARQUES
V
IDIGAL DA
S
ILVA
SUPERVISION:
P
ROFESSORM
ARIAJ
OÃOC
OELHOG
UEDESiii
During the daily routine, top managers experience different types of feelings and emotions, which can reflect on their individual behaviour. Optimism is a personality trait, that has influence on the individual’s behaviour and it is associated with the expectancy of future positive outcomes. But can optimism be associated with company performance? Since top managers deal every day with a different number of task and responsibilities, it is important to understand the effect of optimistic top managers on the company performance.
Using data from a questionnaire targeting top managers in Portuguese companies, and using a self-reported and an objective measure of performance, the results suggest that optimistic top managers over evaluate their company performance. However, it was not found evidence that the presence of optimism on top managers would negatively impact the real company performance. The results support the theory that optimistic top managers tend to overestimate their company performance and an objective measure of performance would be always more accurate.
This study is relevant, for all stakeholders as it shows that top managers self-assessment of performance can be different from the objective performance. Furthermore, it contributes to the investigation about top managers and the pivotal role that individual characteristics, such as optimist, can play in a measurable outcome of the company, such as objective performance.
iv
Life is made up of challenges, and this journey at ISEG was the biggest I've ever had in my life, culminating with the conclusion of this dissertation. These years have not only been challenging, but also, they were not always easy, and what remains in the end is that I believe that made me a better person and future professional. For some years I doubted that I would ever be able to write a dissertation, so this moment is not just a closing cycle, but also a personal overcoming that makes me very proud. But none of this would be possible alone.
Firstly, I would like to thank Professor Maria João Guedes for the guidance, the teaching, the availability to access my doubts and especially for the patience during these months. It was a difficult process, but the Professor knew how to get me on the right path. I would also like to thank Informa D&B for all the data provided essential for this study,
and to all of those who replied to the questionnaire.
v
Abstract ... iii
Acknowledgments ... iv
Table of Contents ... v
List of Tables and Figures ... vi
List of Annex ... vii
1. Introduction ... 1
2. Literature Review ... 2
2.1. Affect, Moods and Emotions ... 2
2.3. Top Manager’s feelings and their role on the company ... 6
2.4. Optimism as a predictor of being better ... 8
2.5. Top Managers’ Optimism and Company Performance ... 8
3. Data Description and Methodology ... 11
3.1. Data Description ... 11
3.2. Measure and Scales ... 12
3.3. Variables ... 16
3.4. Regression models ... 18
4.1. Descriptive Statistics ... 19
4.2. T-Tests ... 22
4.3 Linear Regression Model results ... 24
5. Conclusions ... 29
5.1 Discussion and Final Conclusions ... 29
5.2 Limitations and Future Research ... 31
6. References ... 33
vi
vii
Annex I – Sample Description ... 38
Annex II – Additional Variables Statistics Descriptive... 40
Annex III – Additional T-test ... 43
Annex IV – Pearson Correlations ... 44
Annex V – Linear Multiple Regression Results using categorical variables (Self-Reported Performance) ... 44
Annex VI– Linear Multiple Regression Results using categorical variables (ROA) ... 46
viii CEO – Chief Executive Officer
JSS – Job Stress Scale LOT – Life Orientation Test
LOT-R – Life Orientation Test- Revised NA – Negative Affect
NPV – Net Present Value PA – Positive Affect
PANAS – Positive Affect and Negative Affect Schedule ROA – Return on Assets
ROS – Return on Sales
1
1. Introduction
Top managers have a great number of responsibilities, tasks and problems to deal every day and their personality traits will influence their leadership style, the problem solving or decision-making, and interpreting the cognitive content (Carpenter et al., 2004; McColl-Kennedy & Anderson, 2002; Papenhausen, 2006). The study of performance, motivation and engagement is most of times related with the leadership of the top managers or Chief Executive Officers (CEOs) (Arakawa & Greenberg, 2007), because
leaders’ characteristics are important to provide better knowledge about effects and impacts in the companies.
Optimism has been pointed as a positive trait with benefits to the individual, as better health, job engagement, increased motivation, persistent and greater career success (Carver et al., 2010). Also, there are benefits for the companies that are managed by optimistic top managers, such as better performance (Davis, 2006; McColl-Kennedy & Anderson, 2002), better problem recognition and solving (Papenhausen, 2006) and higher levels of efficient investment (Chen & Lin, 2009). Optimistic managers are also confident about their abilities and, consequently, about their company (Chen & Lin, 2009). Notwithstanding, financial and management behaviour literature suggest differences on the definition of what top managers’ optimism could represent, which can be interpreted in a different point of view of the what the regular definition of optimism represents, evidencing possible negative relationships between optimism and its effect on company performance.
2
present study is relevant, giving insights, that Portuguese companies can have top managers perceived performances different from the reality, and contribute to the investigation about top managers and leaders’ characteristics and their effect on the company.
The dissertation is divided in five parts: Firstly, it is the Introduction; it is followed by chapter 2 with the Literature Review, where some concepts about the topic are presented, as well as the proposed hypothesis; On the chapter 3, the data and the methodology are described; Chapter 4 presents the results; and finally, on the chapter 5 are the final considerations, limitations and suggestions for future topics of research.
2. Literature Review
2.1. Affect, Moods and Emotions
Affect, mood and emotions never were easy to define (Ashforth & Humphrey, 1995). Even for an individual, it is difficult to explain what his currently feelings are. Thus, explain the difference between affects, feelings, moods and emotions were never consensual, and conceptual problems still remains (Forgas, 1995). Even though, there is some literature that attempt to explain some differences, especially between mood and emotions.
Firstly, for some researchers, affect can be considered as a general term of the feeling, which refers to a range of states like emotions and moods (Kida et al., 2001). So, if we keep in track with this idea, when we are speaking about positive or negative affects basically we are speaking about positive or negative feelings.
3
or affective state, it is not a momentary feeling, can last for some time and feel in different places and situations, since they have less response to the environment. (Gaudine & Thorne, 2001; Pelled, 1999).
Secondly, emotions are deeper in terms of intensity, but with shorter life and have a well-defined cause with a clear cognitive content to the individual (Forgas, 1995). For this reason, emotions are more easy to the individual understand them, and they can be reduced to few basic and universal emotion as fear, anger and joy (Ashforth & Humphrey, 1995). We can say that emotions are comprised in two dimensions, which are the level of arousal (or the intensity), and the appraisal of the situation that caused the arousal (Gaudine & Thorne, 2001).
For the purpose of this study, I will consider the mood as a general concept of feelings including the two type of affects and emotions (Forgas, 1995). In fact, it is important to speak about these two types of affects, and what it can change the individual perspective about judgement and decision making.
The Positive Affect (PA) and the Negative Affect (NA)
Watson et al. (1988), developed a two-factor model, consensual to the research community, which consists of two independent dimensions: the positive affect (PA) and the negative affect (NA), and can be explanatory of mood behaviour (Watson, 1988; Watson & Tellegen, 1985).
4
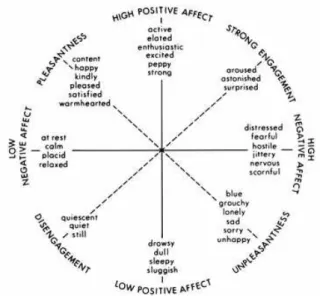
Figure 1 shows the circular representation of the mood structure developed by Watson et al. (1988). We can see that both poles of PA and NA are between two other dimensions which are the Pleasantness vs Unpleasantness and the degree of activation/arousal. The first one represents the valence of the feeling, as positive or negative feeling (for example: content, happy, satisfyed vs sad, lonely, sorry) (Watson et al., 1988). The second one represents the intensity of the feeling (for example: shocked, excited vs sluggish, relaxed) (Watson et al., 1988). This way, high positive affect consists of terms as active, alert and determined and low positive affect reflects depressed and tired feelings. On the other hand high negative affect reflects aversive mood states, such as anger, guilty, nervous, and low NA reflects pleasant low active state, as calmness and serenity (Watson et al., 1988; Watson & Tellegen, 1985). With this information we can conclude that just high scores of PA and NA reflect an effective and active emotional experience, since low scores of both dimensions represents relative absence of emotional environment (Watson, 1988).
5
2.2. The Optimism
Optimism is defined as the expectations of positive outcomes on the future, and the major difference between optimism and pessimism are related with that same expectations of the future, in extent that optimists expect more good things to happen to them, than the pessimists (Carver et al., 2010; Scheier & Carver, 1985; Segerstrom, 2006). This is the basics of dispositional optimism, and it is the main difference between these two types of individuals. Optimists tend to have a different behaviour towards life, as they tend to live in a more positive way than pessimists, not only in specific domains but also in general (Davis, 2006; Kivimäki et al., 2005; Pelled, 1999; Scheier & Carver, 1985). This will influence the daily life of the individual, since optimists tend to confront adverse life events in a more persistent and confident way, increasing their effort and focus on their goals and not being doubtful of the possible outcome of a life situation (Carver et al., 2010; Segerstrom, 2006).
In case of failure, or bad events, they tend to end up attributing the cause to external, unstable and specific factors (Davis, 2006). Pessimists, on their side, are
doubtful, and tend to expect bad outcomes, as if they can’t do anything to fix it, because this bad events are internal, stable and global (Carver et al., 2010; Scheier & Carver, 1985; Schulman et al, 1993; Seligman & Schulman, 1986). This is called explanatory style, which reflects how different individuals can explain good or bad events (Peterson & Seligman, 1984; Schulman et al., 1993; Seligman & Schulman, 1986).
6
optimism, as for most of types of personality traits, is from genetics components (Bates, 2015; Schulman et al., 1993).
There are several studies in the literature proving that optimism can have a better influence, or be beneficial, in a particular outcome rather than pessimism, who are more willing to give up in stressful situations (Brissette et al., 2002), and also they tend to interpret the environmental surroundings in a more positive way (McColl-Kennedy & Anderson, 2002). For instance, according to Kivimäki et al. (2005), which examined changes in health after a major life event, optimistic persons need less time to recover, and to return to levels pre-event, from illness after that life event, compared with individuals with less optimism. Additionally, dispositional optimism can be an important predictor of a faster recovering from a coronary artery bypass surgery (Scheier et al., 1989).
Since dispositional optimism is based on the expectancy of the future and explanatory style reflect the way people explain such events, for the purpose of this study, dispositional optimism will be considered as the main concept of optimism, because its definition is focus on the expectancy of a certain outcome based on a certain decision-making strategy. For instance, an highly optimistic individual will expect a positive outcome, even in an unfavourable situation, and will expect that some external factors can help him to achieve the expectable outcomes (Hmieleski & Baron, 2008).
2.3. Top Manager’s feelings and their role on the company
Every company strive to greatness, to have the better performance possible. Top managers have a large number of responsibilities to conduct the company to the path that
7
decisions (Chen & Lin, 2009; Glaser et al., 2008), mergers and acquisitions (Malmendier & Tate, 2008), and on general problem recognition and solving (Papenhausen, 2006).
Not only in terms of management of the company for itself, but also leadership has an important role in the business, since it has a positive effects on the employees’
engagement, optimism and performance, which benefits the whole company (Arakawa & Greenberg, 2007; McColl-Kennedy & Anderson, 2002). They are faced often with challenging decision-making situation, information selection, and competitive goals and objectives, and the psychological/personality characteristics will play an important role on filtering and interpreting the cognitive content (Carpenter et al., 2004). The cognitive process has a major importance for the purpose of getting a better performance, in the extent that is connected with task performance and the motivation that is behind such task ( Isen et al., 1985).
8
workplace outcomes, since workers with more PA tend to have better evaluations from the supervisors, which suggests job enrichment (Staw et al., 1994).
2.4. Optimism as a predictor of being better
Optimism and performance have been already researched in different areas, such as to distinguish between high a low performers. Seligman et al. (1990), conclude that optimism predicts the performance of college swimmers and Peterson & Barrett (1987) studied optimism as a predictor of college grades. Seligman & Schulman (1986) found evidence that optimism can predict and, through leadership style, mediate job performance as the studies of McColl-Kennedy & Anderson (2002) also shows.
According to the literature about the benefits of the optimists, it includes increased motivation, more confidence, more persistent, see adversity as a challenge, seeking for more opportunities, better mood and better physical health (Schulman, 1999; Seligman & Schulman, 1986). So basically, optimists tend to confront life events in a more challenging way, seeking for opportunities and attributing failures, as we saw earlier, to temporary, external and specific causes, which suggest that top managers’ optimism will positively influence company performance.
2.5. Top Managers’ Optimism and Company Performance
9
Accounting based measures are considered the most effective way to measure the mentioned performance, since the ratios measure the company’s profitability on the short-term (Al-Matari et al., 2014).
Was mentioned before the benefits of optimism to the individual, such as better success and engagement, for example. To the company, an optimistic top manager can be also beneficial, as optimistic individuals tend to be more committed, which is valid especially for top managers, not only because they expect better outcomes, but also,
“because their wealth, professional reputation and employability depend on their performance” (Heaton, 2002).
Although, managerial optimism can be interpreted with a different definition from the dispositional optimism. Previously, optimism was referred as the expectations of favourable outcomes in the future (Carver et al., 2010). Managerial optimism, on the other hand, tend be defined as when a manager systematically overestimates the probability of good company performance and underestimate the probability of bad company performance (Chen & Lin, 2009; Heaton, 2002). Managerial optimism is referred, as well, as similar to overconfidence, when a manager overestimates his own ability and give too much value to his intuition (Chen & Lin, 2009). Besides optimistic top managers being overconfidence and overestimate good performance, they also tend to believe that outsiders underestimate their company performance (Malmendier & Tate, 2008). Based on this assumption of optimistic top managers have overconfidence and a tendency to assign better performance to their companies, the first hypothesis is proposed:
H1: Optimistic top managers will self-report good company performance.
10
(Glaser et al., 2008; Heaton, 2002). Investment decisions can be affected by this behaviour, since it will interfere with the top managers’ perception. For instance, good investment opportunities can be lost, if the top manager perceive them as negative (Heaton, 2002). As well, in a merge or acquisition situation, an highly optimistic top manager can set aside some merger if it must be necessary external capital to complete it (Malmendier & Tate, 2008). This situations reflect a biased evaluation which can be defined as a relative insensitivity to risk (Camerer & Lovallo, 1999).
Economic theory suggests that people should make rational decisions and behaviours, stating people choose the most advantageous option available. It also state a difference between ignorance and irrationality, where ignorance reflects lack of information, which is economically accepted, whereas irrationality means that giving all relevant information is provided, the individual, for certain reasons (as expectations or personal preferences), chooses an option that is not the most advantageous (Vriend, 1996).
11
for decision process, but the top manager’s overconfident behavior can results in negative performance. Also, Martin (2008), studied this relation with similar conclusions.
In accordance with the literature, it is also proposed the following hypothesis: H2: Highly optimistic top managers will deliver lower company performance.
3. Data Description and Methodology
3.1. Data Description
The data was obtained via a questionnaire, sent by email, using the Qualtrics online
software. The advantages of the online surveys are the convenience and flexibility to the
respondent, it’s easy to apply and follow up, fast to obtain and with low cost (Evans & Mathur, 2005). The disadvantages are the perception as junk mail for the respondent, being an impersonal method and privacy issues, can lead to low response rates (Evans & Mathur, 2005).
Before the final version was sent, the questionnaire was pre-tested, in order to find errors and inconsistencies and be approved to be sent to the companies. The contacts were requested to Informa D&B, and 153,875 emails were provided. After the first submission
of emails, and in order to increase the number of responses, the questionnaire was sent again two more times, with intervals of 2 and 4 weeks, these times just for the contacts that did not answer the questionnaire. On total 6414 incomplete responses were obtained during the months of April, May and the begin of June of 2017. After detecting some incorrections and invalid questions, the final sample is comprised of 3401 completed responses which correspond to a response rate of 2.21%.
12
not smoke and 59,5% exercise regularly. Top managers represent 71,4% of the total respondents, 59,7% are self-employed, 55,1% are undergraduate and 32,9% have an
annual income between 0€ and 14.999,00€. About 90% of the respondents work on a
private company, 40% work on a mature company (with more than 20 years of life), 30,7% have less than 5 years of experience in the actual company, but 20,6% have between 16 and 20 years of total experience. 62,9% of the companies have 10 or less employees and 71,4% of the respondents have to direct or indirectly manage 10 or less persons. Even though 25,9% work between 35 and 40 hours per week, a high number of respondents (24,7%) work between 46 and 50 hours. 38,5%, sleep on average between 6,1 and 7 hours per day and 32,1% have between 16 and 22 annual vacation days.
3.2. Measure and Scales
The main objective of this dissertation is to study the relation between optimism, as a mediator of top managers’ behaviour, and company performance. To achieve this goal was necessary to measure optimism, mood, social well-being, anxiety, levels of job stress and company performance. Additionally, other variables were introduced as years of experience, annual income, level of education, weekly working hours, daily sleeping hours and number of vacation days.
Company Performance
The company performance was measured using a subjective and an objective evaluation of the company performance. Using the subjective, or self-reported, measure of performance, the data was collected via questionnaire and using a scale developed by Wiklund & Shepherd (2003). The scale is consisted on ten items and the respondent’s
13
employees’ growth, net profit margin, product/service innovation, process innovation, adaption of new technology, product or service quality, product or service quality and customer satisfaction. For each of these items, the respondent should answer using a scale
from 1 (“much lower”) to 5 (“much higher”) and taking into consideration the performance of the last three years. The overall performance is measured by the sum of all the items, being the final score the self-reported performance, where 10 is the minimum score and 50 is the higher score. The Cronbach alpha of this scale is 0.89, representing a very good reliability (DeVellis, 1991).
Financial data of the year of 2015 of the respondents’ companies was provided by
Informa D&B, in order to make the objective evaluation of the company performance. It
was computed two accounting measure ratios: the return on assets ratio (ROA), which is the return of net income to asset, and the return on sales (ROS), which is the return of net income to sale (Guedes, 2017).
Optimism
Optimism was measured using the revised version of the Life Orientation Test (LOT-R) developed and approved by Scheier et al. (1994). This scale is a revaluation of the original Life Orientation Test (LOT), developed by Scheier & Carver (1985), made
14
benchmark for being optimistic or pessimistic, so the higher the score, more optimistic will the respondent be. The Cronbach alpha is 0,63, which is in the border of the minimally acceptable (DeVellis, 1991),
PANAS
The Positive Affect and Negative Affect Schedule (PANAS) was developed by Watson, Clark, & Tellegen (1988), and is a mood measure scale consisting of 10 positive affect measure items and 10 negative affect measure items.
The ten positive affect (PA) items are interested, alert, excited, inspired, strong, determined, attentive, enthusiastic, active and proud, and, in the other hand, the other ten negative affect (NA) items are irritable, distressed, ashamed, upset, nervous, guilty, scared, hostile, jittery and afraid. To each of these items the respondent should answer based on a Likert scale from 1 (not at all) to 5 (very much), and to get the score, we should sum all the positive affect answers, giving the PA score, and sum all the negative affect to get the NA score. The Cronbach alpha for the PA is 0,84, for the NA is 0,85, and for the all scale is 0,81, which represents good reliability (DeVellis, 1991).
Job Stress Scale
15
high with scores equal or higher than 19, and reduced level if they are equal or bellow than 18 (Urbanetto et al., 2011). In terms of internal reliability, the Cronbach alpha for the demand category is 0,33, for control is 0,54 and support is 0,86. For whole scale the coefficient is 0,56, which is not the best in terms of reliability (DeVellis, 1991).
Satisfaction with Life Scale
The Satisfaction with Life Scale (SWLS) was developed by Pavot & Diener (1993) and is used to measure the overall satisfaction of an individual. It is constituted by 5 items and measured by a Likert scale (1-7). The authors defend that there are 6 outputs or classes of results, based on the sum of all the answers to each item. The higher the score, higher the person satisfaction. People who gets very high scores, with a range from 30 to 35, are very satisfied; with a score range from 25 to 29 are considering having high scores and satisfied with their life, but considering that is not perfect; the third class is average scores, with a range from 20 to 24, where a person has an average life satisfaction; scores below or equal to 19 and higher than 15, are defined as slightly below the average in life satisfaction, where people in this class have some small but significant problems in their life; People scoring between 10 and 14, are dissatisfied, with several domains that are not going well in their life; and finally people in the last class ( scoring between 5-9), are extremely dissatisfied with their life. The Cronbach alpha coefficient for the scale is 0,85, meaning that has a good reliability (DeVellis, 1991).
State-Trait Anxiety Inventory
16
the respondents how the feel on the particular moment when they are answer to the questionnaire. Since both scales measure anxiety levels, it will only be used the trait measure of anxiety, as optimism is also a trait and for this study’s purpose, it is more accurate to consider trait anxiety rather than state anxiety, because it is a general stable anxiety that could be carried into different kinds of places and state is a momentary anxiety. The possible answers vary from 1 (almost never) to 4 (almost always). The score
is calculated based on the sum of all the 20 items’ answers. The higher the score, the higher trait anxiety the respondent has. The Cronbach alpha is 0,90, which represents a very good reliability (DeVellis, 1991).
3.3. Variables
Table I contains de definition of the remaining variables. Table I – List of Variables
Variable Description
Dependent Variable
Self-reported Performance (PERF)
The self-reported, or subjective,
performance is the respondent’s
perception about the overall performance of their company. Its perception is based on 10 measuring items, as for example, sales growth, revenue growth, innovation and
costumers’ satisfaction, comparing with the main competitors over the last 3 years. On the table II is described the 10 items, as well as, the descriptive statistics.
Objective Performance (PERF)
Real performance, measured using two accounting based ratios, the ROA and the ROS.
Independent Variables
Individual Related Variables
Optimism Level of optimism measured by the
17 Professional Experience (EXP)
Number of years of professional experience.
Hierarchical Position (HPOS)
1 if top-level manager, 2 if first-level manager, 3 if middle-first-level manager and 4 if no managerial position.
Level of Education (EDU) 1 if undergraduate, 2 if master’s
degree, 3 if post-graduation, 4 if PhD and 5 if until High School. Income (INC) 1 if 0€ - 14.999,00€, 2 if 15.000,00€
- 29.999,00€, 3 if
30.000,00€ - 44.999,00€, 4 if 45.000,00€ - 59.999,00€, 5 if
60.000,00€ - 74.999,00€, 6 if
75.000,00€ - 89.999,00€, 7 if 90.000,00€ - 104.999,00€ and 8 if more than 105.000,00€.
Weekly Working Hours (WWH)
Number of hours that the respondent works per week. Daily Sleeping Hours
(SLEEP)
Number of hours that the respondent sleeps per day. Vacation Days (VAC) Number of vacation days that the
respondent has per year.
Exercise (EXE) 0 if the respondent doesn’t exercise and 1 if the respondent exercises. Smoker (SMO) 0 if the respondent doesn’t smoke
and 1 if the respondent smoke. AGE (AGE) Age of the respondents in years.
Company Related Variables
Company Age (CAGE) Number of years since the company was founded.
Number of Employees (NEMP)
Number of employees working in the company.
Sector (Sect) 1 if is in the Private Sector, 2 if is in the Public Sector and 3 if is in the non-profit sector.
Number of people managed (NPM)
18 Company Experience (CEXP)
Number of years that the
respondent has been working on the current company.
3.4. Regression models
A multiple regression analysis was used using the STATA Statistics software, with
the version 14.0. For all the models, Performance (PERF), subjective and objective, is the dependent variable and optimism, measured by the scale LOT-R, is the main independent variable. In Equation 1, it is regressed just optimism as the independent variable, which represents just a simple linear regression between Optimism and PERF. Equation 2 adds control variables related to the individual (hierarchical position, years of experience, level of education, level of income, weekly working hours, hours of sleep per day, vacation days per year, smoker and exercise). Equation 3, on the other side, adds control variables related to the company (company age, number of employees, sector, the years of experience in the actual company and the number of manageable persons). The last model combines all the control variables, whether individual or company related.
(1) 𝑃𝐸𝑅𝐹 = 𝛼 + 𝛽1𝐿𝑂𝑇_𝑅 + 𝜀
(2) 𝑃𝐸𝑅𝐹 = 𝛼 + 𝛽1𝐿𝑂𝑇_𝑅 + 𝛽2𝐻𝑃𝑂𝑆 + 𝛽3𝐸𝑋𝑃 + 𝛽4𝐸𝐷𝑈 + 𝛽5𝐼𝑁𝐶 + 𝛽6𝑊𝑊𝐻 +
𝛽7𝑆𝐿𝐸𝐸𝑃 + 𝛽8𝑉𝐴𝐶 + 𝛽9𝐴𝐺𝐸 + 𝛽10𝑆𝑀𝑂 + 𝛽11𝐸𝑋𝐸 + 𝛽12+ 𝛽13𝑃𝐴 + 𝛽14𝑁𝐴 +
𝛽15𝑆𝑊𝐿𝑆 + 𝛽16𝑆𝑇𝐴𝐼𝑇𝑟𝑎𝑖𝑡+ 𝜀
(3) 𝑃𝐸𝑅𝐹 = 𝛼 + 𝛽1𝐿𝑂𝑇_𝑅 + 𝛽2𝐶𝐴𝐺𝐸 + 𝛽3𝑁𝐸𝑀𝑃𝐿 + 𝛽4𝑁𝑀𝑃 + 𝛽5𝑆𝐸𝐶𝑇 +
19
(4) 𝑃𝐸𝑅𝐹 = 𝛼 + 𝛽1𝐿𝑂𝑇_𝑅 + 𝛽2𝐻𝑃𝑂𝑆 + 𝛽3𝐸𝑋𝑃 + 𝛽4𝐸𝐷𝑈 + 𝛽5𝐼𝑁𝐶 + 𝛽6𝑊𝑊𝐻 +
𝛽7𝑆𝐿𝐸𝐸𝑃 + 𝛽8𝑉𝐴𝐶 + 𝛽9𝐴𝐺𝐸 + 𝛽10𝑆𝑀𝑂 + 𝛽11𝐸𝑋𝐸 + 𝛽12𝑀𝑆 + 𝛽13𝑃𝐴 + 𝛽14𝑁𝐴 +
𝛽15𝑆𝑊𝐿𝑆 + 𝛽16𝑆𝑇𝐴𝐼𝑇𝑟𝑎𝑖𝑡+ 𝛽17𝐶𝐴𝐺𝐸 + 𝛽18𝑁𝐸𝑀𝑃𝐿 + 𝛽19𝑁𝑀𝑃 + 𝛽20𝑆𝐸𝐶𝑇 +
𝛽21𝐶𝐸𝑋𝑃 + 𝛽22𝐽𝑆𝑆𝑑𝑒𝑚𝑎𝑛𝑑 + 𝛽23𝐽𝑆𝑆𝑐𝑜𝑛𝑡𝑟𝑜𝑙+ 𝛽24𝐽𝑆𝑆𝑠𝑢𝑝𝑝𝑜𝑟𝑡 + 𝜀
4. Results
4.1. Descriptive Statistics
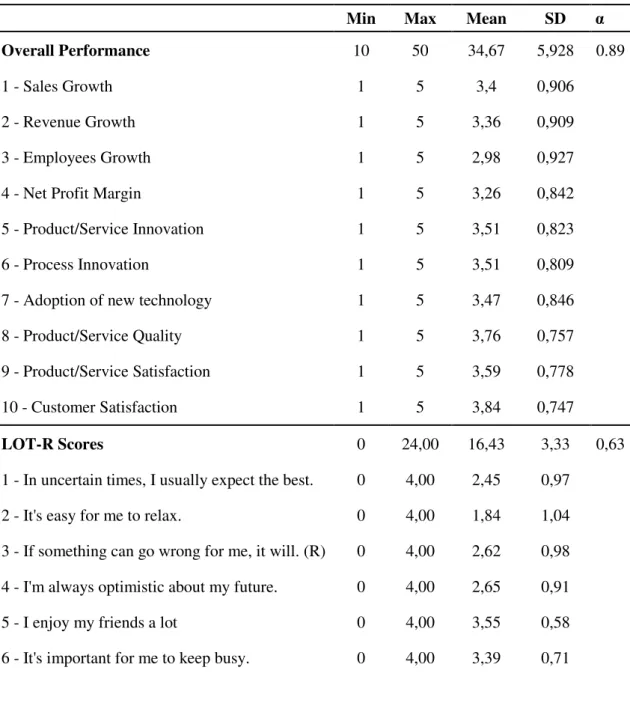
Table II shows the descriptive statistics for the self-reported performance and for the optimism. On the components of the self-reported performance, we observe that almost all of them have a mean of or above 3, which means that, on average, respondents have a positive view of his business comparing with their competitors, over the last three years of activity. The exception is only the field of employees’ growth with a mean of 2,98,
which is the item with the lowest performance score. Customer Satisfaction is the field with higher performance score (3,84), representing an idea that managers believe its customers are more satisfied with their company than with the competitor’s companies. Summing all the 10 answers, the overall performance is, on average, 34,67 and confirms the idea that managers have an optimistic view of their business, since this value is above the mean (Wiklund & Shepherd, 2003). It is important, as well, to be conscient that the more optimistic the top managers are, the higher overvaluation they will perceive of their companies.
20
items 1, 3, 4, 7, 9 and 10. The rest of them are filler items and should not be interpreted. The item with lower score is first one with 2,45, which states “In uncertain times, I usually
expect the best” and with higher score is the last one, stating “Overall, I expected more good thing to happen to me, than bad”, with a mean of 3,03. The mean of the optimism score is 16,43. The Pearson correlation between optimism scores and self-reported performance is 0,261, for a significance level of 1%, demonstrating a positive a significant relation between both variables.
Table II – Self-Reported Performance and Optimism Descriptive Statistics
Min Max Mean SD α
Overall Performance 10 50 34,67 5,928 0.89
1 - Sales Growth 1 5 3,4 0,906
2 - Revenue Growth 1 5 3,36 0,909
3 - Employees Growth 1 5 2,98 0,927
4 - Net Profit Margin 1 5 3,26 0,842
5 - Product/Service Innovation 1 5 3,51 0,823
6 - Process Innovation 1 5 3,51 0,809
7 - Adoption of new technology 1 5 3,47 0,846
8 - Product/Service Quality 1 5 3,76 0,757
9 - Product/Service Satisfaction 1 5 3,59 0,778
10 - Customer Satisfaction 1 5 3,84 0,747
LOT-R Scores 0 24,00 16,43 3,33 0,63
1 - In uncertain times, I usually expect the best. 0 4,00 2,45 0,97
2 - It's easy for me to relax. 0 4,00 1,84 1,04
3 - If something can go wrong for me, it will. (R) 0 4,00 2,62 0,98
4 - I'm always optimistic about my future. 0 4,00 2,65 0,91
5 - I enjoy my friends a lot 0 4,00 3,55 0,58
21
7 - I hardly ever expect things to go my way. (R) 0 4,00 2,70 1,02
8 - I don't get upset too easily. 0 4,00 2,32 1,01
9 - I rarely count on good things happening to
me. (R) 0 4,00 2,97 0,95
10 - Overall, I expect more good things to
happen to me than bad. 0 4,00 3,03 0,88
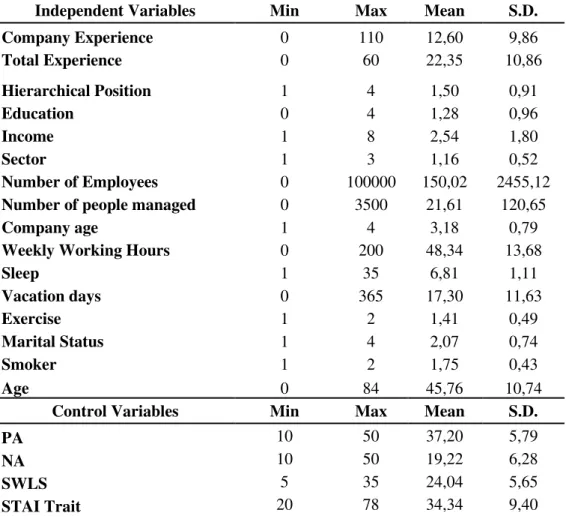
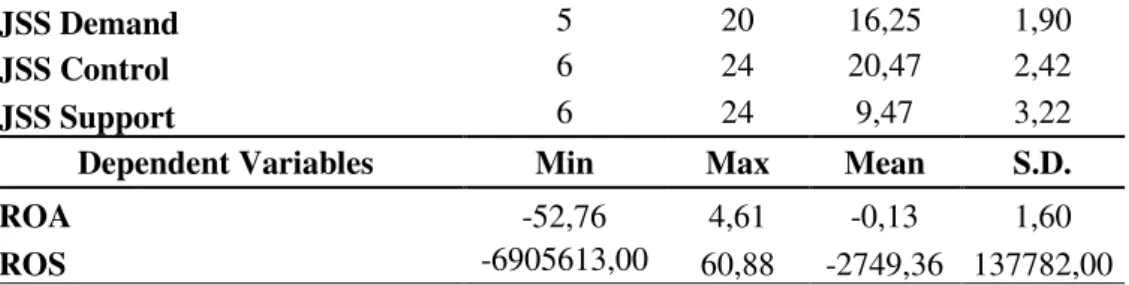
Table III shows the remaining statistics descriptive of the independent variables used in this study, as well as, the statistics descriptive of the ratios used to measure the objective company performance. As it can be observed, both, ROA and ROS, have negative means, which, at a first sight, can lead to an interpretation that most of the companies have bad performance. Additionally, the Annex II shows the complete statistics description of the scales used as variables in the study.
Table III – Independent Variables and Objective Performance Descriptive Statistics
Independent Variables Min Max Mean S.D.
Company Experience 0 110 12,60 9,86 Total Experience 0 60 22,35 10,86
Hierarchical Position 1 4 1,50 0,91
Education 0 4 1,28 0,96
Income 1 8 2,54 1,80
Sector 1 3 1,16 0,52
Number of Employees 0 100000 150,02 2455,12 Number of people managed 0 3500 21,61 120,65 Company age 1 4 3,18 0,79 Weekly Working Hours 0 200 48,34 13,68
Sleep 1 35 6,81 1,11
Vacation days 0 365 17,30 11,63
Exercise 1 2 1,41 0,49
Marital Status 1 4 2,07 0,74
Smoker 1 2 1,75 0,43
Age 0 84 45,76 10,74
Control Variables Min Max Mean S.D.
PA 10 50 37,20 5,79 NA 10 50 19,22 6,28
SWLS 5 35 24,04 5,65
22
JSS Demand 5 20 16,25 1,90 JSS Control 6 24 20,47 2,42 JSS Support 6 24 9,47 3,22 Dependent Variables Min Max Mean S.D.
ROA -52,76 4,61 -0,13 1,60 ROS -6905613,00 60,88 -2749,36 137782,00
Note: N = 3401; Min is minimum, max is the maximum and S.D. is the standard deviation.
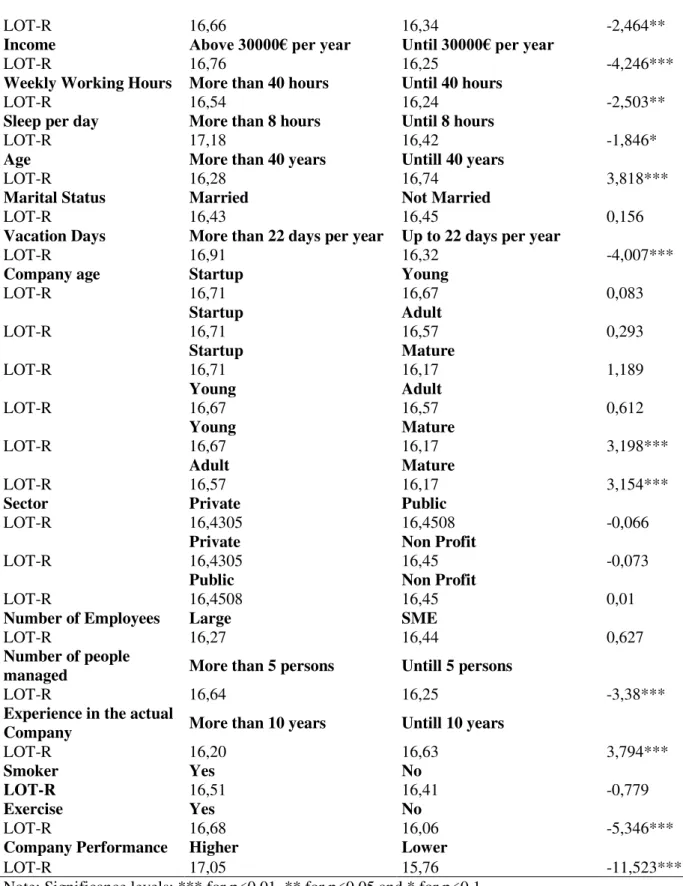
4.2. T-Tests
In order to understand if there were significant differences in the level of optimism on the group of variables, t-tests were performed, using IBM SPSS Statistics, version 24.
Table IV shows the recoded variables used to create two groups, in order to compare the LOT-R means. The null hypothesis is the equality of means between the two groups of variables.
Table IV – Recoded Variables
Table V – T-tests
Hierarchical Position Top-Level Managers Non Top-Level Managers t-value
LOT-R 16,67 15,83 -6,752***
Experience Above 20 years Bellow 20 years
LOT-R 16,21 16,66 3,884***
Education Above undergraduate degree
Until undergraduate degree
Variable Description
Hierarchical Position (HPOS) 0 if non-top-level manager; 1 if top-level manager.
Experience (EXP) 0 if 20 or less years; 1 if 21 or more years.
Education (EDU) 0 if until undergraduate degree; 1 if more than the undergraduate degree.
Income (INC) 0 if 29.999€ or lessper year. per year; 1 if 30.000€ or more
Weekly Working Hours (WWH) 0 if less or equal to 40 hours; 1 if 41 or more hours.
Hours of sleep per day (SLEEP) 0 if less or equal to 8 hours; 1 if more than 8 hours.
Vacation days (VAC) 0 if less or equal to 22 days; 1 if 23 or more days.
Number of employees (NEMPL) 0 if SME (Equal to 249 or less employees); 1 if Large company (if 250 or more employees).
Number of people managed (NPM) 0 if 5 or less persons; 1 if 6 or more persons.
23
LOT-R 16,66 16,34 -2,464**
Income Above 30000€ per year Until 30000€ per year
LOT-R 16,76 16,25 -4,246***
Weekly Working Hours More than 40 hours Until 40 hours
LOT-R 16,54 16,24 -2,503**
Sleep per day More than 8 hours Until 8 hours
LOT-R 17,18 16,42 -1,846*
Age More than 40 years Untill 40 years
LOT-R 16,28 16,74 3,818***
Marital Status Married Not Married
LOT-R 16,43 16,45 0,156
Vacation Days More than 22 days per year Up to 22 days per year
LOT-R 16,91 16,32 -4,007***
Company age Startup Young
LOT-R 16,71 16,67 0,083
Startup Adult
LOT-R 16,71 16,57 0,293
Startup Mature
LOT-R 16,71 16,17 1,189
Young Adult
LOT-R 16,67 16,57 0,612
Young Mature
LOT-R 16,67 16,17 3,198***
Adult Mature
LOT-R 16,57 16,17 3,154***
Sector Private Public
LOT-R 16,4305 16,4508 -0,066
Private Non Profit
LOT-R 16,4305 16,45 -0,073
Public Non Profit
LOT-R 16,4508 16,45 0,01
Number of Employees Large SME
LOT-R 16,27 16,44 0,627
Number of people
managed More than 5 persons Untill 5 persons
LOT-R 16,64 16,25 -3,38***
Experience in the actual
Company More than 10 years Untill 10 years
LOT-R 16,20 16,63 3,794***
Smoker Yes No
LOT-R 16,51 16,41 -0,779
Exercise Yes No
LOT-R 16,68 16,06 -5,346***
Company Performance Higher Lower
LOT-R 17,05 15,76 -11,523***
Note: Significance levels: *** for p<0.01, ** for p<0.05 and * for p<0.1
24
Company Performance, stating significant differences in the optimism level. Also, we reject the null for mature companies.
These results suggest that top-level managers are more optimistic, as well as, respondents with less experience, with higher education, with higher annual income, that work more than 40h per week, sleep more than 8h per day and have more than twenty-two vacation days. Optimists are, also, younger, do exercise frequently, manage more than 5 persons, have low experience in the actual company and tend to self-report higher company performance.
Additionally, t-test were computed to the scales used as variables, described on the Annex III. For all the variables (PANAS, SWLS, STAI and JSS), the null hypothesis is rejected and the difference in means is statistically significant, reflecting that optimists have better mood, better social well-being, less anxiety and have psychological and knowledge demanding jobs, which reflects that top managers will be more optimists the more individual and social well-being, as well as, responsibilities they have.
4.3 Linear Regression Model results
Table VI shows the results of the linear regression models, having as main dependent variable the subjective company performance.
Table VI – Linear Regression Models Results using self-reported performance
(1) (2) (3) (4)
VARIABLES Optimism Optimism + Individual
Veriables
Optimism + Company Veriables
Optimism + Individual
and Company Veriables
Optimism 0.464*** 0.033 0.342*** 0.024
(14.805) (0.949) (10.836) (0.686)
Hierarchical Position -0.657*** -0.529***
(-5.818) (-4.541)
Total Experience -0.008 0.006
(-0.454) (0.360)
25
(-1.536) (-2.085)
Income 0.297*** 0.294***
(5.192) (5.059)
Weekly Working hours 0.032*** 0.032***
(4.356) (4.376)
Sleep 0.108 0.110
(1.389) (1.399)
Vacation days -0.009 -0.008
(-1.237) (-1.154)
Age -0.066*** -0.066***
(-3.856) (-3.824)
Marital Status -0.075 -0.095
(-0.562) (-0.713)
Smoker 0.079 0.125
(0.369) (0.583)
Exercise 0.023 0.033
(0.122) (0.175)
PA 0.278*** 0.252***
(12.299) (10.920)
NA -0.007 0.001
(-0.341) (0.045)
SWLS 0.089*** 0.077***
(3.766) (3.254)
STAI Trait -0.081*** -0.072***
(-4.763) (-4.252)
Company age -0.387** -0.217
(-2.301) (-1.341)
Number of Employees 0.000 0.000
(0.041) (0.158)
Number of people managed 0.002** 0.001
(2.340) (1.513)
Sector 0.127 0.341*
(0.661) (1.801)
Company Experience -0.027** -0.013
(-2.156) (-0.959)
JSS Demand 0.221*** 0.050
(3.917) (0.938)
JSS Control 0.371*** 0.220***
(8.257) (5.204)
JSS Support -0.182*** -0.083**
(-4.842) (-2.446)
Constant 27.049*** 26.018*** 20.979*** 22.359***
(51.410) (15.262) (14.860) (10.992)
Observations 3,401 3,323 3,399 3,321
R-squared 0.068 0.234 0.127 0.247
26
Model 1 and model 3 show that the optimism score is positively and statistically significant. However, when we add individual variables (model 2 and model 4), it becomes non-statistically significant. About the company related variables, presented in the model 3, we can see that some variables are statistically significant when they are regressed just with optimism, as the case of stress demand and control, measured on the JSS, and also number of person managed, although with a small coefficient. The results suggest that the more psychological demand the manager be faced and the more possibilities the individual has to use his own abilities, the more performance it should represent to the firm. On the other hand, variables as company age, company experience and job stress support, are negatively and significant with the self-reported performance. Adding individual variables, as represented on model 4, significance is lost in some of these company related variables (company age, number of people managed, company experience and job demand). Accordingly, the results suggest that the individual variables have stronger impact on the relation between optimism and self-reported performance.
27
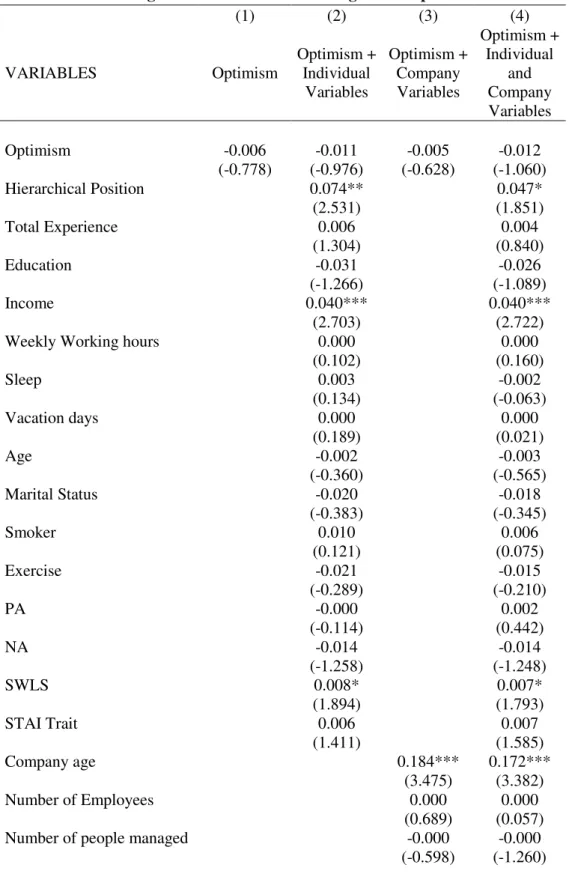
Table VII – Linear Regression Models Results using ROA as performance measure
(1) (2) (3) (4)
VARIABLES Optimism Optimism + Individual
Variables Optimism + Company Variables Optimism + Individual and Company Variables
Optimism -0.006 -0.011 -0.005 -0.012
(-0.778) (-0.976) (-0.628) (-1.060)
Hierarchical Position 0.074** 0.047*
(2.531) (1.851)
Total Experience 0.006 0.004
(1.304) (0.840)
Education -0.031 -0.026
(-1.266) (-1.089)
Income 0.040*** 0.040***
(2.703) (2.722)
Weekly Working hours 0.000 0.000
(0.102) (0.160)
Sleep 0.003 -0.002
(0.134) (-0.063)
Vacation days 0.000 0.000
(0.189) (0.021)
Age -0.002 -0.003
(-0.360) (-0.565)
Marital Status -0.020 -0.018
(-0.383) (-0.345)
Smoker 0.010 0.006
(0.121) (0.075)
Exercise -0.021 -0.015
(-0.289) (-0.210)
PA -0.000 0.002
(-0.114) (0.442)
NA -0.014 -0.014
(-1.258) (-1.248)
SWLS 0.008* 0.007*
(1.894) (1.793)
STAI Trait 0.006 0.007
(1.411) (1.585)
Company age 0.184*** 0.172***
(3.475) (3.382)
Number of Employees 0.000 0.000
(0.689) (0.057)
Number of people managed -0.000 -0.000
28
Sector -0.060 -0.087
(-0.584) (-0.831)
Company Experience 0.000 -0.001
(0.358) (-0.559)
JSS Demand 0.003 0.001
(0.273) (0.083)
JSS Control -0.011 -0.012
(-0.870) (-0.843)
JSS Support -0.014 -0.013
(-1.408) (-1.320)
Constant -0.035 -0.335 -0.262 -0.322
(-0.278) (-0.850) (-0.503) (-0.500)
Observations 2,584 2,526 2,582 2,524
R-squared 0.000 0.008 0.009 0.014
Robust t-statistics in parentheses *** p<0.01, ** p<0.05, * p<0.1
Table VII presents the results for objective performance, using ROA as dependent variable and objective performance measure. According to the results, there is no relationship between optimism and objective performance, and there are only three variables statistically significant (hierarchical position, income and company age) and positively related with the objective performance. Thus, as a manager achieve higher positions on the company, the return on assets tend to increase as well. The same is valid with the variable income, the more money a manager receive, the more return on assets tend the company to have. This is consistent with the theory that optimistic top managers tend to be highly committed with the company, “because their wealth, reputation and
employability depends on it” (Heaton, 2002).
29
regressed again using the self-reported and the ROA as measures of performance, but this time representing the categorical variables, as the Annex V and VI show. There are no major differences in the results from using the variables by categories.
The results using these objective accounting measures of performance, state a difference between them and the self-reported measure, as it was not found any relation between optimism and objective company performance. Also, are not in line with mentioned literature, e.g. Papenhausen (2006) and Martin (2008), where the authors found evidence of a negative influence of optimism on the company performance, which lead to a rejection of the hypothesis 2.
With these results it is possible to conclude two main ideas: The first one goes according to what was hypothesized on the hypothesis 1, that optimistic managers tend to overestimate their company performance, which can reflect differences with the true performance. The second idea is that, even though optimistic top managers tend to over valuate their companies, it is not sure that their optimism level could really impact the performance.
5. Conclusions
5.1 Discussion and Final Conclusions
30
though, top managers’ optimism can be positive to the company, on reality it can be dangerous, when the top manager decides irrationally, placing his/her intuition over the rational reason. Also, optimistic top managers tend to expect systematically better outcomes, and perhaps overestimate that same outcomes. Thus, this study seeks to investigate if this personality trait can lead the company to bad performance, and in extent if optimistic top managers overestimate their perception about the performance of their companies.
The results show that individuals that are top-level managers, have less working experience, higher education, more annual income, work more hours per day, sleep more hours per day, have more vacation days per year, younger and exercises frequently, have higher levels of optimism. Also, individuals that work on mature companies, manage more persons directly or indirectly and have less experience in the actual company tend to be more optimistic. Consistent with the literature, e.g. Heaton (2002), which pointed that optimistic top managers tend to be overconfident about their company, overestimating good performance and underestimating bad performance, statistically significant differences in the level of optimism between high self-reported performance and low self-reported performance was observed. The regression analysis, the t-tests’ results and the descriptive statistics supports this idea of performance overestimation, even though, only in two of the four models regressed, optimism is statistically significant. Thus, it was possible to accept the hypothesis 1, and claim that optimistic top managers will have a good performance perception.
31
Martin (2008) and Papenhausen (2006), in this study it was not found evidence to accept this hypothesis, thus the phrased hypothesis 2 was rejected. However, provide us support on the theory that optimistic top managers tend to overestimate their companies’
outcomes, and their perception could not correspond to the reality. Even though it is possible to say that a negative mind will never give you a positive life, it is not so linear that a positive mind will always give you a positive outcome, because there is, as well, other determinants to consider. Shareholders and potential investors should not waive an objective accounting evaluation of the company, which is a relevant information provided by this study.
5.2 Limitations and Future Research
The current study has some limitations. Firstly, as an online questionnaire it has some advantages and disadvantages. Some of the disadvantages are the impersonal interaction and the possibility to be misunderstood as spam mail, which lead to two limitations: The low response rate and the lack of confirmation that some responses were not answered by the top manager of the firm, since it is not possible to ensure that. Also, there is a limitation on the content of the questionnaire, as it could be included other variables as gender and narcissism score, which could lead to alternative analysis, and a more complete study.
32
also suggests. Other line for future research could be analysing whether optimism or narcissism, as personality traits, could influence more the top managers’ behaviour and
33
6. References
Al-Matari, E. M., Al-Swidi, A. K., & Fadzil, F. H. B. (2014). The Measurements of Firm
Performance’s Dimensions. Asian Journal of Finance & Accounting, 6(1), 24.
Arakawa, D., & Greenberg, M. (2007). Optimistic managers and their influence on productivity and employee engagement in a technology organisation: Implications for coaching psychologists. International Coaching Psychology Review, 2(1), 78–
89.
Ashforth, B. E., & Humphrey, R. H. (1995). Ashforth & Humhrey, 1995.pdf. Human Relations.
Bates, T. C. (2015). The glass is half full and half empty: A population-representative twin study testing if optimism and pessimism are distinct systems. Journal of Positive Psychology, 10(6), 533–542.
Brissette, I., Scheier, M. F., & Carver, C. S. (2002). The role of optimism in social network development, coping, and psychological adjustment during a life transition.
Journal of Personality and Social Psychology, 82(1), 102–111.
Camerer, C., & Lovallo, D. (1999). Overconfidence and Excess Enty : An Experimental
Approach. The American Economic Review, 89(1), 306–318.
Carpenter, M. A., Geletkancz, M. A., & Sanders, W. G. (2004). Upper echelons research revisited: Antecedents, elements, and consequences of top management team composition. Journal of Management, 30(6), 749–778.
Carver, C. S., Scheier, M. F., & Segerstrom, S. C. (2010). Optimism. Clinical Psychology Review, 30(7), 879–889.
Chen, I., & Lin, S. (2009). Managerial Optimism , Investment Efficiency , and Firm Valuation *. Multinational Finance Journal, 17(3), 1–44.
34 Setting.
DeVellis, R. F. (1991). Scale development : theory and applications. Applied social research methods series, v 26.
Evans, J. R., & Mathur, A. (2005). The value of online surveys. Internet Research, 15(2),
195–219.
Forgas, J. P. (1995). Mood and judgment: The affect infusion model (AIM).
Psychological Bulletin, 117(1), 39–66.
Forgas, J. P., & George, J. M. (2001). Affective Influences on Judgments and Behavior in Organizations: An Information Processing Perspective. Organizational Behavior and Human Decision Processes, 86(1), 3–34.
Gaudine, A., & Thorne, L. (2001). Emotion and ethical decision-making in organizations.
Journal of Business Ethics, 31(2), 175–187.
Glaser, M., Schäfers, P., & Weber, M. (2008). Managerial Optimism and Corporate Investment: Is the CEO Alone Responsible for the Relation? The 15th Annual Meeting of the German Finance Association, 1–45.
Guedes, M. J. C. (2017). Mirror, mirror on the wall, am I the greatest performer of all? Narcissism and self-reported and objective performance. Personality and Individual Differences, 108, 182–185.
Hansen, G. S., & Wernerfelt, B. (1989). Determinants Of Firm Performance: The Relative Importance of Economic and Organization Factors. Strategic Management Journal, 10(5), 399.
Heaton, J. B. (2002). Managerial Optimism and Corporate Finance, 31(2), 33–45.
Hmieleski, K. M., & Baron, R. A. (2008). When does entrepreneurial self-efficacy enhance versus reduce firm performance? Strategic Entrepreneurship Journal, 2,
35
Isen, A. M., Daubman, K. A., & Nowicki, G. P. (1987). Positive affect facilitates creative problem solving. Journal of Personality and Social Psychology, 52(6), 1122–1131.
Isen, A. M., Johnson, M. M., Mertz, E., & Robinson, G. F. (1985). The influence of positive affect on the unusualness of word associations. Journal of Personality and Social Psychology, 48(6), 1413–1426.
Kida, T. E., Moreno, K. K., & Smith, J. F. (2001). The Influence of Affect on Managers’
Capital Budgeting Decisions. Contemporary Accounting Research, 18(3), 477–494.
Kivimäki, M., Vahtera, J., Elovainio, M., Helenius, H., Singh-Manoux, A., & Pentti, J. (2005). Optimism and pessimism as predictors of change in health after death or onset of severe illness in family. Health Psychology : Official Journal of the Division
of Health Psychology, American Psychological Association, 24(4), 413–421.
Malmendier, U., & Tate, G. (2008). Who makes acquisitions? CEO overconfidence and the market’s reaction. Journal of Financial Economics, 89(1), 20–43.
Martin, J. (2008). The Impact of Optimistic and Pessimistic Managers on Firm Performance and Corporate Decisions, 1–46.
McColl-Kennedy, J. R., & Anderson, R. D. (2002). Impact of leadership style and emotions on subordinate performance. Leadership Quarterly, 13(5), 545–559. Papenhausen, C. (2006). Half full or half empty: The effects of top managers’
dispositional optimism on strategic decision-making and firm performance. Journal of Behavioral and Applied Management, 7(2), 103–115.
Pavot, W., & Diener, E. (1993). Review of the Satisfaction With Life Scale.
Psychological Assessment, 5(2), 164–172.
Pelled, L. H. (1999). Down and Out: An Investigation of the Relationship between Mood and Employee Withdrawal Behavior. Journal of Management, 25(6), 875–895.
36
university freshman. Journal of Personality and Social Psychology, 53(3), 603–607.
Peterson, C., & Seligman, M. E. (1984). Causal explanations as a risk factor for depression: theory and evidence. Psychological Review, 91(3), 347–374.
Scheier, M. F., & Carver, C. S. (1985). Optimism, coping, and health: assessment and implications of generalized outcome expectancies. Health Psychology : Official
Journal of the Division of Health Psychology, American Psychological Association, 4(3), 219–247.
Scheier, M. F., Carver, C. S., & Bridges, M. W. (1994). Distinguishing optimism from neuroticism (and trait anxiety, self-mastery, and self-esteem): a reevaluation of the Life Orientation Test. Journal of Personality and Social Psychology, 67(6), 1063–
1078.
Scheier, M. F., Matthews, K. a, Owens, J. F., Magovern, G. J., Lefebvre, R. C., Abbott, R. a, & Carver, C. S. (1989). Dispositional optimism and recovery from coronary artery bypass surgery: the beneficial effects on physical and psychological well-being. Journal of Personality and Social Psychology, 57(6), 1024–1040.
Schulman, P. (1999). Applying Learned Optimism to Increase Sales Productivity. The Journal of Personal Selling and Sales Management, 19(1), 31–37.
Schulman, P., Keith, D., & Seligman, M. E. P. (1993). Is optimism heritable? A study of twins. Behaviour Research and Therapy, 31(6), 569–574.
Segerstrom, S. C. (2006). Dispositional Optimism and Coping: A Meta-Analytic Review.
Personal and Social Psychology Review, 10(3), 214–234.
Seligman, M. E. P., Nolen-Hoeksema, S., Thornton, N., & Thornton, K. M. (1990). Explanatory style as a mechanism of disappointing athletic performance.
Psychological Science, 1(2), 143–146.
37
and quitting among life insurance sales agents. Journal of Personality and Social Psychology, 50(4), 832–838.
Staw, B. M., Sutton, R. I., & Pelled, L. H. (1994). Employee positive emotion and favorable outcomes at the workplace. Organization Science, 5(1), 51–71.
Töres Theorell, Aleksander Perski, Torbjörn Åkerstedt, Filis Sigala, G., & Ahlberg-Hultén, J. S. and P. E. (1988). Changes in job strain in relation to changes in physiological state: A longitudinal study, 189–96.
Urbanetto, J. de S., da Silva, P. C., Hoffmeister, E., de Negri, B. S., da Costa, B. E. P., & de Figueiredo, C. E. P. (2011). Workplace stress in nursing workers from an emergency hospital: Job Stress Scale analysis. Revista Latino-Americana de Enfermagem (RLAE), 19(5), 1122–1131 10p.
Vriend, N. (1996). Rational Behavior and Economic Behavior (1), 29, 263–285.
Watson, D. (1988). The Vicissitudes of Mood Measurement: Effects of Varying Descriptors, Time Frames, and Response Formats on Measures of Positive and Negative Affect. Journal of Personality and Social Psychology, 55(1), 128–141.
Watson, D., Clark, L. A., & Tellegen, A. (1988). Development and validation of brief measures of positive and negative affect: The PANAS scales. Journal of Personality and Social Psychology, 54(6), 1063–1070.
Watson, D., & Tellegen, A. (1985). Toward a consensual structure of mood.
Psychological Bulletin, 98(2), 219–235.
Wiklund, J., & Shepherd, D. (2003). Knowledge-based resources , entrepreneurial orientation , and the performance of small and medium-sized businesses, 1314,
38
7. Annex
Annex I – Sample Description
Frequency Percentage
Marital Status
Single 479 14,0
Married 2561 75,1
Widow 34 1,0
Divorced 338 9,9
Total 3412 100,0
Age
20 years old or less 9 0,3
21 - 30 years old 245 7,2
31 - 40 years old 869 25,5
41 - 50 years old 1194 35,0
51 - 60 years old 780 22,9
61 - 70 years old 276 8,1
More than 70 years old 39 1,1
Total 3412 100,0
Exercise
Yes 2029 59,5
No 1383 40,5
Total 3412 100,0
Smoker
Yes 852 25,0
No 2560 75,0
Total 3412 100,0
Income
0€ - 14.999,00€ 1122 32,9
15.000,00€ - 29.999,00€ 1087 31,9
30.000,00€ - 44.999,00€ 496 14,5
45.000,00€ - 59.999,00€ 266 7,8
60.000,00€ - 74.999,00€ 148 4,3
75.000,00€ - 89.999,00€ 87 2,5
75.000,00€ - 89.999,00€ 60 1,8
105.000,00€ or more 146 4,3
Total 3412 100,0
Education level
Until High School 570 16,7
Undergraduate degree 1881 55,1
Post- graduation 474 13,9
Master degree 400 11,7
PhD 87 2,5
Total 3412 100,0
Employment Status
Self-Employed 2037 59,7
Dependent Employed 1363 39,9
Unemployed 12 0,4
Total 3412 100,0
39 Hierarchical
Position
Middle-level Management 496 14,5
First-level Management 225 6,6
With no management level 256 7,5
Total 3412 100,0
Professional Experience
Until 5 years 192 5,6
6 - 10 years 350 10,3
11 - 15 years 442 13,0
16 - 20 years 704 20,6
21- 25 years 483 14,2
26 - 30 years 572 16,8
More than 30 years 669 19,6
Total 3412 100,0
Experience in the actual
company
Until 5 years 1046 30,7
6 - 10 years 780 22,9
11 - 15 years 481 14,1
16 - 20 years 475 13,9
21- 25 years 253 7,4
26 - 30 years 225 6,6
More than 30 years 152 4,5
Total 3412 100,0
Weekly Working
Hours
30h or less 166 4,9
31h - 35h 173 5,1
35h - 40h 884 25,9
41h - 45h 400 11,7
46h- 50h 844 24,7
51h - 60h 644 18,9
More than 60h 301 8,8
Total 3412 100,0
Hours of Sleep per day
5h or less 284 8,3
5,1h - 6h 971 28,5
6,1h - 7h 1314 38,5
7,1h - 8h 777 22,8
8,1h - 9h 54 1,6
More than 9h 12 0,4
Total 3412 100,0
Annual Vacation days
5 or less days 408 12,0
6 -10 days 510 14,9
11 - 15 days 756 22,2
16 - 22 days 1094 32,1
22 - 30 days 542 15,9
More than 30 days 102 3,0
Total 3412 100,0
Company age Startup 52 1,5
40
Adult Company 1340 39,3
Mature Company 1365 40,0
Total 3412 100,0
Company Sector
Private 3071 90,0
Public 122 3,6
Non- Profit 219 6,4
Total 3412 100,0
Number of Employees of
the company
10 or less employees 2147 62,9
11 - 50 employees 840 24,6
51 - 100 employees 159 4,7
101 - 250 employees 126 3,7
251 - 500 employees 61 1,8
More than 500 employees 79 2,3
Total 3412 100,0
Number of people managed
10 or less persons 2469 72,4
11 - 50 persons 737 21,6
51 - 100 persons 120 3,5
101 - 250 persons 52 1,5
251 - 500 persons 19 0,6
More than 500 persons 15 0,4
Total 3412 100,0
Annex II – Additional Variables Statistics Descriptive
Variable Statement N Mean S.D. Min Max
PANAS
Interested 3401 3,95 0,77 1 5
Irritable 3401 2,30 0,96 1 5
Distressed 3401 2,57 1,04 1 5
Alert 3401 3,48 0,95 1 5
Enthusiastic 3401 3,66 0,87 1 5
Ashamed 3401 1,48 0,81 1 5
Upset 3401 2,02 0,92 1 5
Inspired 3401 3,45 0,89 1 5
Strong 3401 3,66 0,85 1 5
Nervous 3401 2,26 1,01 1 5
Guilty 3397 1,43 0,76 1 5
Determined 3396 3,93 0,79 1 5
Scared 3398 1,64 0,84 1 5
Attentive 3392 3,86 0,72 1 5
41
Jittery 3395 2,17 0,96 1 5
Active 3393 4,03 0,75 1 5
Proud 3396 3,52 0,98 1 5
Afraid 3395 1,73 0,88 1 5
Excited 3389 3,67 0,83 1 5
PA 3374 37,20 5,80 10 50
NA 3388 19,22 6,29 10 50
SWLS
In most ways my life
is close to my ideal. 3401 4,82 1,30 1 7
The conditions of my
life are excellent. 3401 4,84 1,36 1 7
I am satisfied with my
life. 3401 5,19 1,27 1 7
So far, I have gotten the important things I
want in life. 3401 4,54 1,54 1 7
If I could live my life over, I would change
almost nothing. 3401 4,66 1,65 1 7
SWLS 3401 24,04 5,65 5 35
JSS
Do you have to work
very fast? 3401 3,33 0,77 1 4
Do you have to work
very intensively? 3401 3,59 0,63 1 4
Does your work demand
too much effort? 3401 3,51 0,61 1 4
Do you have enough
time to do everything? 3401 2,99 0,83 1 4
Does your work often involve conflicting
demands? 3401 2,83 0,78 1 4
JSS Demand 3401 16,25 1,90 5 20
Do you have the possibility of learning new things through your
work? 3401 3,55 0,64 1 4
Does your work demand a high level of skill or
expertise? 3401 3,55 0,67 1 4
Does your job require you to take the