UNIVERSIDADE TÉCNICA DE LISBOA
INSTITUTO SUPERIOR DE ECONOMIA E GESTÃO
Mestrado em Desenvolvimento e Cooperação Internacional
ECONOMIC PARTNERSHIP AGREEMENTS: A
PRO-DEVELOPMENT TOOL?
Marlene Elizabete Lourenço Bastos
Supervisor
: Manuel António de Medeiros Ennes Ferreira
Jury:
President:
Joaquim Alexandre dos Ramos Silva, Associate
Professor with Aggregation by Instituto Superior de
Economia e Gestão da Universidade Técnica de
Lisboa;
Vogals:
Maria Helena Almeida Silva Guimarães, Associate
Professor with Aggregation by Escola de Economia e
Gestão da Universidade do Minho;
Manuel António de Medeiros Ennes Ferreira,
Professor at Instituto Superior de Economia e Gestão
da Universidade Técnica de Lisboa.
“(…
) Wake up world
Wake up and stop sleeping
Wake up Africa
Wake up and stop blaming
Open your eyes
‖
ABSTRACT
Economic Partnership Agreements (EPAs) put an end to the preferential non-reciprocal commercial treatment from the European Union (EU) to African Caribbean and Pacific (ACP) countries, in force since 1975 and until December 2007 (the deadline for EPAs deals). Negotiations are being challenging as only a small number of countries have closed full EPAs with EU by now, on the grounds that EPAs are missing their development goal. This dissertation intends to analyse EPAs negotiation round, evaluate to which extend the agreements are delivering on their promise to be pro-development tools for ACP countries, and access ways in which this delivery can be fostered.
Key Words: Economic Partnership Agreements, Economic and Social Development, Aid
RESUMO
Os Acordos de Parceira Económica (APEs) encerram um período alargado de tratamento comercial preferencial e não-recíproco da União Europeia (UE) aos países de África, Caraíbas e Pacífico (ACP), vigente entre 1975 e Dezembro 2007 (data final para conclusão dos APEs). O processo negocial tem-se revelado difícil e apenas um reduzido número de países concluiu APEs totais à data, invocando que os referidos acordos descuram os objectivos de desenvolvimento a que se haviam proposto. Assim sendo, esta dissertação propõe-se analisar os processos de negociação em curso, avaliar em que medida os APEs constituem instrumentos que visam o desenvolvimento dos países ACP, e encontrar formas de potenciar ou calibrar os APEs como efectivos instrumentos pro-desenvolvimento.
Palavras Chave: Acordos de Parceira Económica, Desenvolvimento Económico e
AKNOWLEDGEMENTS
INDEX
ABBREVIATIONS AND ACRONYMS ... 8
TABLES LIST ... 10
FIGURES LIST ... 12
INTRODUCTION... 13
1ST PART ... 15
CHAPTER I ... 16
ACP COUNTRIES’ COMPETITIVE POSITION ... 16
1. Market Access of ACP Countries Exports to EU Markets ... 16
1.1. Residual Tariff Barriers over Exports ... 18
1.2. Escalating Custom Duties... 19
1.3. The Importance of Non Tariff Barriers: Rules of Origin and SPS ... 19
1.3.1. Rules of Origin (RoO) ... 20
1.3.4. Sanitary and Phytosanitary Standards (SPS) ... 22
2. Import Competition in ACP Countries’ Domestic Markets ... 23
2.1. Unfair Competition: ACP Countries with Little Room of Manoeuvre ... 24
2.2. Dependence of Import Related Fiscal Revenues ... 25
2.2.1. Are Fiscal Revenue Losses Being Overplayed? ... 27
3. ACP Countries Structural Constraints... 29
3.1. Infrastructure and Trading Costs in Africa ... 30
3.1.1. Transport Costs ... 32
3.1.2. Customs Procedures ... 34
3.2. Trade Restrictiveness Indices ... 35
3.2.1. Trade Restrictiveness Higher for Agricultural than Manufactured Goods ... 36
3.2.2. Developing Economies Facing and Imposing the Highest Protectionism ... 38
CHAPTER II ... 41
ECONOMIC PARTNERSHIP AGREEMENTS: CONCEPT AND EXTENSION . 41 1. Economic Partnership Agreements: Origin and Scope ... 41
1.1. Non Compliance with WTO’s Most Favoured Nation Principle ... 42
1.2. ACP Countries Trade Preferences Erosion ... 42
1.3. EPA as Free Trade Agreements – an Inevitable Option? ... 44
2. EPA’s Timetable and Negotiations Update ... 46
3. EPAs: a Deadlock to ACP Regional Integration Process? ... 50
3.1. Constraints to African Regional Integration Process ... 50
3.2. Large Differences of Tariffs among ACP Regional Blocks Negotiating EPAs ... 52
3.3. Full Regional EPAs Replaced by Bilateral EPAs? ... 54
3.4. EPAs Agreements: Heterogeneity as a Ruling Word ... 55
2ND PART ... 60
CHAPTER III ... 61
ACP COUNTRIES AT THE WTO: THE IMPLICATIONS OF EPAS ... 61
1. ACP Countries Involved in a Number of Negotiations Roundtables – Are they Prepared? ... 61
1.1. EU and ACP Countries: Unequal Partners ... 62
1.2. Negotiations Pace: EPA’s Moving Faster than WTO’s ... 63
1.3. Asymmetric Enforcement at WTO ... 63
2. WTO Agenda – Evolving on Which Direction? ... 64
2.1. Trade Liberalization Moving Into Services and Intellectual Property Rights ... 64
2.2. Doha Development Round Fails to Deliver Its Promise ... 66
3. Could EPAs Undermine ACP Countries’ Position in Multilateral Negotiations?66 4. The Importance of Development Assistance - Aid for Trade Initiative Gains Momentum ... 69
4.1. What is Aid for Trade? ... 70
4.2. Will AfT Deliver on Its Promise? ... 73
4.3. EU Strategy on Aid for Trade ... 73
4.2.1. Relying Too Much on ―Best-Endeavour‖ Terminology ... 77
4.2.2. No New Aid Envelope or Specific AfT Delivery Mechanisms ... 77
4.2.3. The Ownership Principle ... 78
4.2.4. The Alignment Principle ... 79
CHAPTER IV ... 80
TRADE AND DEVELOPMENT: IMPLICATIONS FOR EPAS ... 80
1. Arguments in Favour and Against Free Trade ... 80
2. Does Trade Restrictiveness Caps Development? ... 82
2.1. Protectionism: the Road Today’s Developed Economies Rode in the Past ... 82
2.2. More than Tariff Protection, Industrial Promotion Led the Catch-up Process ... 84
2.3. From Infant Industry to the Infant Economy Argument ... 88
3. Key Issues for EPAs Negotiations: Turning Them Into a Pro-Development Tool? ... 88
3.1. Negotiating the Biggest Possible Asymmetry Reciprocity ... 89
3.2. Calling for SPS Harmonization ... 91
3.3. RoO Easing and Harmonization ... 92
3.5. Definition of Sensitive and Special Products ... 94
3.6. Use of Safeguard Measures ... 95
3.7. The Development Component of EPAs - The Importance of AfT ... 96
3.8. Prioritizing the Regional Integration Process ... 97
3.9 African Union Empowerment in Regional Integration Process and on EPAs ... 99
CONCLUSIONS ... 102
ANNEXES ... 106
ANNEX 1 ... 107
STATISTICS ON ACP COUNTRIES ... 107
ANNEX 2 ... 109
STATISTICS ON AFRICA’S REGIONAL INTEGRATION ... 109
ANNEX 3 ... 112
STATISTICS ON INFRAESTRUCTURE AND TRANSPORT COSTS IN AFRICA ... 112
ANNEX 4 ... 114
STATISTICS ON AFRICA’S TRADE PERFORMANCE ... 114
ABBREVIATIONS AND ACRONYMS
African, Caribbean and Pacific (ACP)
African Growth and Opportunity Act (AGOA)
AGOA Special Rule (AGOA SR)
Aid-for-Trade (AfT)
ASEAN Free Trade Area (AFTA)
Association of Southeast Asian Nations (ASEAN)
Botswana, Lesotho, Namibia, Swaziland (BLNS)
Caribbean Community (CARICOM)
Caribbean Forum of African, Caribbean and Pacific States (CARIFORUM)
Central Africa (CEMAC)
Common External Tariff (CET)
Common Market of Eastern and Southern Africa (COMESA)
Country or Regional Strategy Papers (CSPs/RSPs)
Democratic Republic of Congo (DRC)
East African Community (EAC)
Eastern and Southern Africa (ESA)
Economic Commission for Africa (ECA)
Economic Community of West African States (ECOWAS)
Economic Partnership Agreements (EPA)
EU – the Trade, Development and Co-operation Agreement (TDCA)
European Commission (EC)
European Development Fund (EDF)
European Union (EU)
European’s Union’s Common Agricultural Policy (CAP)
Everything But Arms (EBA)
Food and Veterinary Office (FVO).
Free Trade Area (FTA)
General Affairs and External Relations Council (GAERC)
General Agreement on Tariffs and Trade (GATT)
Generalized System of Preferences (GSP)
Gross Domestic Product (GDP)
Interim EPA (IEPA)
International Trade Centre (ITC)
Joint Orientation Document (JOD)
Least Developed Countries (LDC)
Maximum Residual Limits (MRL)
Millennium Development Goals (MDG)
Most Favoured Nation Principle (MFNP)
Newly Industrialized Countries (NICs)
Non Governmental Organisation (NGO)
Now-Developed Countries (NDC)
Official Development Assistance (ODA)
Organisation for Economic Cooperation and Development (OECD)
Preferential Trade Agreements (PTA)
Purchasing Power Parity (PPP)
Regional Economic Communities (REC)
Research and Development (R&D)
Rules of Origin (RoO)
Sanitary and Phytosanitary Standards (SPS)
Southern Africa Development Community (SADC)
Structural and Adjustment Programmes (SAP)
Sub-Sahara Africa (SSA)
Technical Barriers to Trade Agreement (TBT)
United Nations Conference on Trade and Development (UNCTAD)
United States of America (USA)
Value-Added Tax (VAT)
West Africa EPA development programme (PAPED)
TABLES LIST
Table 1: Custom Duties in EU, Japan and USA Before and After the
Implementation of the Uruguay Round Agreements 17
Table 2: Revenue Loss as a Share of Total Government Revenue as a Result
of EPAs 26
Table 3: Estimated revenue Losses from EPAs for Four COMESA Countries
(assuming elimination of tariffs on all imports from EU) 28 Table 4: Comparison of Average Ranking of Major Developing Regions in
Business Climate and Competitiveness indicator, 2007-2008 30 Table 5: Transit Costs in Selected African Countries and World Groups, 2001 31 Table 6: Physical Integration in Selected Regional Economic Communities in
Africa (2000) 34
Table 7: Trading Across Borders (2008) 35
Table 8: OTRI and TTRI (percent), for the Four Largest Traders, 2006 38 Table 9: OTRI and TTRI (percent), by Developing Country Region, 2006 39 Table 10: Liberalisation Schedules Agreed in initialled Interim EPA
Agreements 48
Table 11: Africa’s Intra-Africa and Multilateral Trade, 1994-2000 51 Table 12: Tariffs in ACP countries by EPA Constellations 53
Table 13: Unequal Partners in Trade 63
Table 14: EPAs and the WTO: death blow to development in the Doha Round 68
Table 15: EU Aid for Trade Commitments (2001-2006) 75
Table 16: Funds Allocated and Spent During Each Fiver-year Financing
Cycle (million €) 76
Table 17: Average tariff Rates on Manufacturing Products for Selected
Developed Countries in Their Early Stages of Development 84 Table 18: African and European Tariffs During Industrialization 86 Table 19: Oxfam Put Initialled EPAs to the Development Test 96
Table 20: African Merchandise Exports 99
Table 21: REC’s Recognized by AU as the Pillars of Africa Economic
Community 100
imports between 2000 and 2005)
Table 24: Integration Indices for Africa’s Regional Economic Communities,
1995-99 (Index 1994=100) 110
Table 25: Integration Indices for Africa by Sector, 1995-99 (Index 1994=100) 111 Table 26: Transit Costs in Selected African Countries and World Groups,
2001 112
Table 27: Physical Integration in Selected Regional Economic Communities
in Africa (2000) 113
Table 28: Comparative Merchandise Export Performance, World and Africa,
2000-2005 (US$ billion) 114
FIGURES LIST
Figure 1: Apparel Exports of 22 Countries Benefiting from AGOA SR by
2004 21
Figure 2: Comparison of Shipping Costs (2002) 33
Figure 3: OTRI for Agriculture and Manufactures 37
Figure 4: Change in Overall Trade Restrictiveness Index (OTRI), 2000-2006 40 Figure 5: Africa’s Share of Total World Exports (%) 43 Figure 6: Pace and scope of import liberalisation in EPAs (deals initialled in
December 2007) 49
Figure 7: African Countries Overlapping Membership in Regional
Economic Communities (number of countries) 52
Figure 8: Splintering the SADC Region 55
Figure 9: Regional Disintegration in Africa?: ―Initialled‖ Trade
Regimes 57
Figure 10: WTO’s Types of AfT 71
Figure 11: Share of Trade Related ODA in Overall Development Aid 72 Figure 12: Overall Distribution of Trade Related ODA by Program and
Project 72
Figure 13: EU AfT commitments to ACP regions (2001-2006) 75 Figure 14: Caribbean EPA: Opening Up to Foreign Investment 91 Figure 15: AFRICAN EPAs Country Groups and Customs Unions 107 Figure 16: AFRICAN EPAs Country Groups in Relation to Existing
Regional Trade Areas 108
Figure 17: Intracommunity Trade as a Share of Total Trade for
INTRODUCTION
Economic Partnership Agreements (EPAs) end up with the preferential non-reciprocal commercial treatment from the European Union (EU) to African, Caribbean and Pacific (ACP) countries, in force since 1975. The negotiation process started in September 2002 and aimed to be concluded by December 2007. However, only a small number of countries closed full deals by this time on grounds that EPAs are falling short of their development promise. Most ACP countries are trading with the EU on the basis of interim EPA agreements (IEPA).
EPAs hold great importance to ACP countries as they propose a level of trade liberalisation these countries might not be prepared to face. The agreements under
negotiation intend to open ACP countries’ markets to EU, putting ACP countries’ goods
in direct competition with those imported from the EU. However, the differences of development and size among the two regions are notorious, reinforcing the argument that
ACP countries aren’t prepared to withstand competition and the related harmful
consequences for agriculture, industrial activity and employment. Implications at the fiscal revenue front are one of the issues to be addressed because of the constraints it might raise on public investment on health and education areas, but so are the implications for the ACP countries’ (already troubled) regional integration process.
Furthermore EPAs negotiations are involving a wide scope of issues, which goes beyond
World Trade Organization’s (WTO) agenda.
Taking into account all these elements, this dissertation intends to analyse EPAs in order to evaluate whether, or to which extend, these agreements are delivering on their development promise. It has also the purpose of assessing ways in which such delivery could be fostered. As such, the premise that is being tested is that EPAs are a pro-development tool.
(NGO). The major purpose is to analyse and list the arguments presented by the several parties involved and based on that information reach a conclusion. Given the difficulties in collecting significant and regular statistical data aggregating ACP countries, this dissertation works with ACP countries aggregated data when available, but in most cases it either works with the Sub-Sahara Africa (SSA) group data or with statistics available for the African region.
CHAPTER I
ACP COUNTRIES
’
COMPETITIVE POSITION
ACP countries have benefited from preferential non-reciprocal trade treatment from EU since 1975 until December 2007, the deadline for Economic Partnership Agreements (EPAs) negotiations. This first Chapter identifies on Section 1 the major features that characterize ACP countries exports access to EU markets, which take expression on a reduction on custom duties and tariffs, but also on the prevalence of residual tariff barriers on sensitive products, of escalating custom duties, as well as on the significant climb on non tariff barriers respecting to sanitary and phytosanitary standards (SPS) and rules of origin (RoO) over recent years. It then focuses on the competition of
imports in ACP countries’ domestic markets and the little room of manoeuvre ACP countries have to deal with unfair competition coming from Europe, as well as on strong reliance of ACP Governments on import tax revenue (Section 2). After addressing these issues, Section 3 makes a reflection upon the structural constraints faced by ACP countries, outlining the importance of infrastructures to the development of the region, in particular due to its impact on trading and transport costs. On this latter point it analyses a working paper from World Bank, which studies the major trend of trade restrictiveness and emphasises the need to lower tariffs and transport costs in Africa in order to make the region more competitive.
1. Market Access of ACP Countries Exports to EU Markets
Generally ACP countries exports benefit from preferential non-reciprocal treatment
in regard to their access to developed countries’ markets. They have enjoyed from such
schemes towards the developing world. Furthermore, ACP countries have also taken advantage of the reduction of custom duties, which gained a stronger speed after the entry into force of the WTO agriculture agreement, back in 1995.
However, as Alpha et al. (2005:7-8) note, whilst it is possible to acknowledge the downward trend on customs duties over the past years, the move was not extendable to all products. Indeed so called sensitive products to the developed economies (a large part of which of great importance to ACP countries) have been excluded from GPS and, as a result, remain subject to high custom duties. The table below is quite elucidative how customs duties remained high for some products categories after the implementation of the Uruguay Round Agreements, pointing to the need of further improvement of access to
developed countries’ markets:
Table 1: Custom Duties in EU, Japan and USA Before and After the Implementation of the Uruguay Round Agreements
EU before EU after Japan before Japan after US before US after
Green Coffee 5 0 0 0 0 0
Cocoa 3 0 0 0 0 0
Fresh Tropical
Products 9 5 17 4 7 5
Sugar 297 152 126 58 197 91
Wheat 170 82 240 152 6 4
Milky
Products 289 178 489 326 144 93
Source: OCDE, MFN duties (cited in Alpha et al., 2005:8)
adopted the EBA initiative, which offers duty-free and quota-free access for LDC exports except for sugar, rise and bananas which are subject to a phased elimination of quotas1.
1.1. Residual Tariff Barriers over Exports
Nonetheless, residual tariff barriers continue to be imposed over some agricultural products, namely those labelled as sensitive by EU, i.e. that threaten the competitiveness of EU products and ACP countries are no exception. According to Alpha et al (2005:10)
“(…) the average level of residual tariff barriers applied to agricultural exports from ACP group (including LDCs) on the European market has been estimated at 5.3% on
98.1% of imports receiving preferential treatment. This estimate must be compared with
that of countries under GSP (17.9% of protection on average on 19.8% of imports
covered by the preferences system) and MFN (average protection rate of 20.7%) regimes.”
Residual tariff barriers can assume the form of ad valorem duties (a percentage of the product’s price) or specific duties (amount in euros per unit of measure, i.e. per
100kg, per tonne, etc.). The Cotonou Agreement provided tax-free quotas, import ceilings and seasonal duties for some sensitive products coming from the ACP countries. This meant that up to a certain quota these agricultural products exported by ACP countries could face reduced or zero custom duties at the EU whilst benefiting from the higher and more stable European domestic price 2. The same agreement allowed ACP countries to call for the registration of new agricultural products for purposes of tax and quota exemption, though the approval license was usually hard to get. All in all, though ACP
1. According to Oxfam (2000) the 48 LDC by the time of the launch of the initiative accounted for just 0.4% of
World Trade, representing only 0,003% of EU imports.
2 These happened to be true for the product protocols of sugar, bovine meat and bananas existing under Lomé
countries benefit from preferential treatment from EU the fact is that some of its exports still have to face residual tariff barriers.
1.2. Escalating Custom Duties
Another important theme for ACP countries exports refers to custom duties escalation, which translates into the imposition of higher levels of duties on products holding a higher degree of processing. Though the exports of processed products from ACP countries to the EU market are not taxed, this changes whenever each of the higher value added products involved contain EU sensitive products on their composition. This happen to be the case of fresh and dried mangos exports to EU, which are duty-free, contrary to mangos conserved with sugar or even mango juice, which turn to be taxed at €15 per 100kg and €12.9 per 100kg, respectively3. LDCs are also taxed on tinned pineapples in the framework of access restrictions on sugar exports. The perpetuation of these escalating custom duties schemes is capping the development of ACP countries as confines them to primary products production specialisation, when there is wide consensus on the need of a migration towards the production of value added products (Alpha et al., 2005:11).
1.3. The Importance of Non Tariff Barriers: Rules of Origin and SPS
Trade relations between ACP countries and the developed world have been marked by a substantial reduction on the tariffs imposed by the advanced economies to their ACP counterparties, a trend which also extended to residual tariff barriers over the past years. Nonetheless, non tariff barriers respecting to sanitary and phytosanitary standards (SPS) and rules of origin (RoO) have climbed significantly, growing the structural and capacity limitations faced by ACP countries and consequently hurting their exports’
3 PwC/GRET/Forum for Africa: Sustainability Impact Assessment (SIA) of the EU-ACP Economic Partnership
competitiveness (Alpha et al. 2005:7). Non-tariff barriers constitute a significant obstacle to ACP countries exports access to developed countries markets.
1.3.1. Rules of Origin (RoO)
RoO respect to aggregation rules and processing criteria a product must comply to get originating status. These are particularly important for countries whose exports are benefiting from preferential treatment. On those circumstances RoO are primarily intended to prevent trade deflection, i.e. preventing the country enjoying from lower tariffs from importing a certain product and re-exporting it at a profit; furthermore, it is intended to foster processing capacity in developing economies. However, when too demanding, RoO might be assessed as non tariff barriers. This is the case of LDC ACP countries, where the RoO of the EBA initiative are the same of the GSP and therefore stricter that those settled under the Cotonou agreement. The packaging of food exports might weight significantly in the cost of the final product, which if not complying with RoO it might be taxed, reducing therefore price competitiveness. Whilst it is important to prevent reexportation risks, RoO currently applied to LDC are too strict impeding these countries from benefiting from the EBA initiative.
EU’s RoO were stricter when compared to the US, at least regarding the textile sector. The low-income African countries that benefit from preferential access for their apparel to both regions, in a much similar way, face up, however, far more demanding
RoO rules at EU’s preferential scheme in comparison to US’s African Growth and
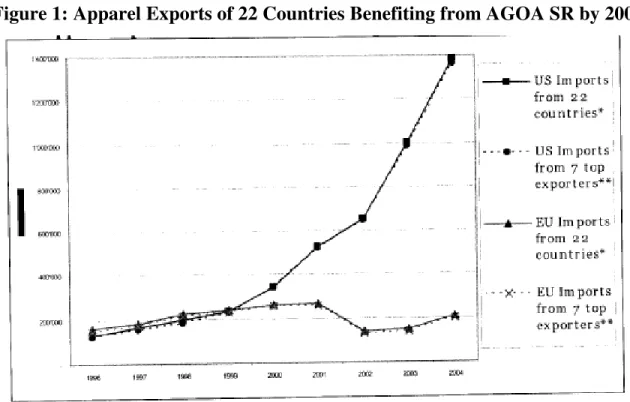
On this front the World Bank (2008:15) refers to the working paper of Portugal –
Perez (2007)4 which provides econometric evidence that easing RoO and accepting the use of fabric for any origin has bolstered apparel exports from the top seven beneficiaries
of AGOA’s Special Rule by around 300%. The international organisation also reports a
recent research paper by Cadot and de Melo (2007)5 which also points to the negative impact of current RoO on the trade preferences conceded by developed world to African economies.
Figure 1: Apparel Exports of 22 Countries Benefiting from AGOA SR by 2004
Source: Portugal-Perez (2007) (cited in World Bank 2008:29)
4 Portugal-Perez, Alberto (2007), ―The Costs of RoO in Apparel: African Apparel Exports to the US and EU‖.
University of Geneva, mimeo.
5 Cadot, Oliver, Jaime de Melo and Alberto Portugal-Perez, 2007, ―Rules of Origin for Preferential Trading
Agreements: Implications for the ASEAN Free Trade Area of EU and US Experience”, Journal of Economic
1.3.4. Sanitary and Phytosanitary Standards (SPS)
Product standards and technical specifications can lead to an increase of trade costs for exporters, who are forced to change production processes in order to comply with standard regulations of the importing country as well as take all the necessary steps to obtain the required certification. SPS can prove useful to the exporter, however, when providing valuable information about the consumer market in the importing country, reducing therefore information costs (World Bank 2008:7). Nonetheless, evidence seems to suggest that SPS are being used by some countries for protectionist purposes, resulting in numerous, complex and onerous SPS.
According to Alpha et all (2005:13) SPS as an access condition to developed markets have increased from 300 in 1980 up to 3000 in 2000. The situation seems to be particularly shocking regarding European SPS which are, as a whole, more demanding that international SPS, posing therefore a challenge to ACP countries’ exports. A primary condition to access the European market is that agricultural exports do not exceed the Maximum Residual Limits (MRL) for pesticides authorised by the European Commission (imposed to the safeguard of human health). The application of a new European regulation on the control of foodstuffs on January, 1st 2006, proved even more demanding as despite being an internal EU regulation the Commission recognized it should be applied to third countries exporting to the European market.
An important point here is that the new generalised regulation makes it compulsory for food companies to apply the Hazard Analysis Critical Points (HACCP) principles whilst the new European regulation also requires competent authorities of the exporting country to ensure that exporters comply with EU rules, meaning that such competent
The World Bank (2008:7) cites a study from Otsuki et al. dated from 20016 which after examining the impact of European aflatoxin standards on African groundnut exports concluded that a 10% rise in SPS restrictiveness is related to an 11% drop in trade. The international organization also quotes a study from Disdier et al. (20077) which uses “(…)
data on WTO notifications of mandatory sanitary and phytosanitary measures, as well as
technical regulations, to measure the impact of standards across a large number of
different sectors” where they conclude that “(…) standards are associated with negative trade impacts, in particular for exports from developing countries to OECD countries”.
A study by Moenius (2004)8 concludes on the positive net impact of SPS on trade in the manufacturing sector, as it helps to mitigate information costs to the exporter. The same conclusion does not apply to the agricultural sectors, which deals with more homogeneous products, having therefore lower information costs.
2. Import Competition in ACP Countries’ Domestic Markets
ACP countries face competition from imports to their local production, either because these latter are more competitive in terms of productivity and comparative advantages or because of the dry up consumer markets for some products (European poultry exports to West and Central Africa is one of the examples). This kind of competition outlines the structural constraints face by ACP countries.
6Otsuki, Tsunehiro, John S. Wilson, and Mirvat Sewadeh, 2001, ―What Price Precaution? European Harmonization of Aflatoxin Regulations and African Groundnut Exports‖, European Review of Agricultural Economics, 28 (3), pp. 263-284.
7 Disdier, Anne-Célia, Lionel Fontagné, and Mondher Mimouni, 2007,
The Impact of Regulations on Agricultural Trade: Evidence from SPS and TBT Agreements, Working Paper No. 2007-04, CEPII.
8 Moenius, Johannes (2004), Information Versus Product Adaptation: The Role of Standards in Trade, International
2.1. Unfair Competition: ACP Countries with Little Room of Manoeuvre
Worrisome is when competition comes from distortion brought by aids to producers and exports which enable these to practice dumping prices i.e. sell below the production cost (often the example here goes to USA and EU wheat exports). This practice, more recurrent in the developed world (which owns the financial resources to undertake such measures), contribute to the destabilization of global markets, as they provide the incentive to overproduction as well as low, artificial and volatile prices.
On the issue of subsidization to agriculture, Stiglitz (2006:85) notes that the subsidies of the USA, EU and Japan (and included hidden subsidies on water) al together account, at least for 75% of total income of SSA, leaving African farmers unable to compete in global markets. The average European cow receives a subsidy of US$2 per day, whilst in the developing world more than half the population lives on less than that. According to Oxfam (2008:17)9, Europe spent €50bn in support to farmers in 2006, a
support ACP countries can not give has they do not own resources. “(…) Tariffs are one
of the few instruments they can use to offer a degree of support to their farmers and
struggling manufacturing sectors. Yet EPAs allow the use of subsidies and forbid the use of tariffs”.
Distorted competition is unfair in nature, but particularly unfair for ACP countries which see themselves with little room of manoeuvre to provide the same support to domestic production and exports sectors, either because their Structural Adjustment
Programmes (SAP) don’t allow it or because the do not have the necessary financial resources. The framework of SAPs implied strong reductions in tariffs (in line with the liberal spirit that inspired the design of such programs) so by the time of 1995 agricultural agreement most countries were carrying regimes of very low tariffs. The reductions in tariffs for developing countries (LDC excluded) were in line with tariff lifts determined at the end of the Uruguay Round. Most ACP countries opted for a system of ceiling rates
then, which provided them with the flexibility to increase tariffs later. It is important to note, however, that tariffs remain, in most cases, well below the ceiling rates, so ACP countries should consider the possibility of running for more protectionist commercial policies (Alpha et al., 2005:15-16).
The liberalization that EPAs portend for European exports entering ACP countries will make European products even more competitive than local products, having a direct impact on domestic industries as well as on people that directly or indirectly depending on it as a way of subsistence. This is why the definition of sensitive and special products to be excluded from liberalization as well as safeguard mechanisms assume such great importance at EPAs negotiations (this issue will be further developed on Chapter IV). Additionally, EPAs pose a threat to the regional trade as it could trigger trade diversion away from regional partners into EU imports.
2.2. Dependence of Import Related Fiscal Revenues
Related to weak institutions and bad governance practices (and to some extent it could be seen as a consequence of it) is the little level of economic diversification of ACP economies (many of them strongly relying on commodities trade) and also the high dependence of total fiscal revenue on import tariffs. The loss of fiscal revenue from import tariffs is one of the issues that is fuelling controversy on EPAs negotiations.
revenue. Trade diversion from external to EU suppliers would increase even more the loss of tariff revenues.
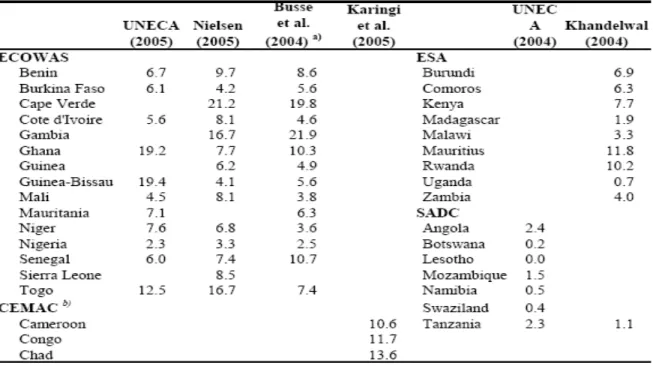
Estimates for these losses vary by region and according to the different studies, and can be expressive to some countries (5-10% of total revenues) and quite expressive to some others (10-15% of revenues). The author cited the study of Busse et al. (2004)10, which estimates losses of 19.8% of total government revenue in the case of Cape Verde, 21.9% for Gambia and 10.7% for Senegal. In SADC, on the other hand, according to a UNECA (2004)11 study, revenue losses as a share of total government revenue would stay below 2.5%.
Table 2: Revenue Loss as a Share of Total Government Revenue as a Result of EPAs
10Busse, M., A. Borrmann, and H.Grobmann, 2004, ―The Impact of ACP/EU Economic Partnership Agreements on ECOWAS Countries: An Empirical Analysis of the Trade and Budget Effects‖. Institut fur Wirtschaftsforschung,
Hamburg.
11UNECA, 2004, ―The EU-SADC Economic Partnership Agreement: A Regional Perspective.‖ Unpublished paper.
Source: Hinkle et al. (2005:270). Compiled from UNECA (2005), Nielsen (2005), Busse et al. (2004), Kaningi e al. (2005), UNECA (2004), Khadelwal (2004); IMF IFS.
2.2.1. Are Fiscal Revenue Losses Being Overplayed?
There is a strong debate whether these studies overplay the revenue losses problem. L. Hinkle et al. (2005:272) believes this happens to be the case to some countries and proceeds noting the widespread practice on tariff exemptions grants in SSA, which if suppressed would cap revenue losses. The author cites the study of Busse, Borrmann and Grossman (2004)12 which concludes on low collection efficiency by noting that on average tariff collections are 70% or even lower of potential tariff revenues for ECOWAS countries and below 40% and 30% in Guinea-Bissau and Ghana respectively.
A recent report by World Bank (2008d: 21-22) acknowledges that “(…) most of the
analyses of revenue losses made prior to the initialling of interim had serious flaws and,
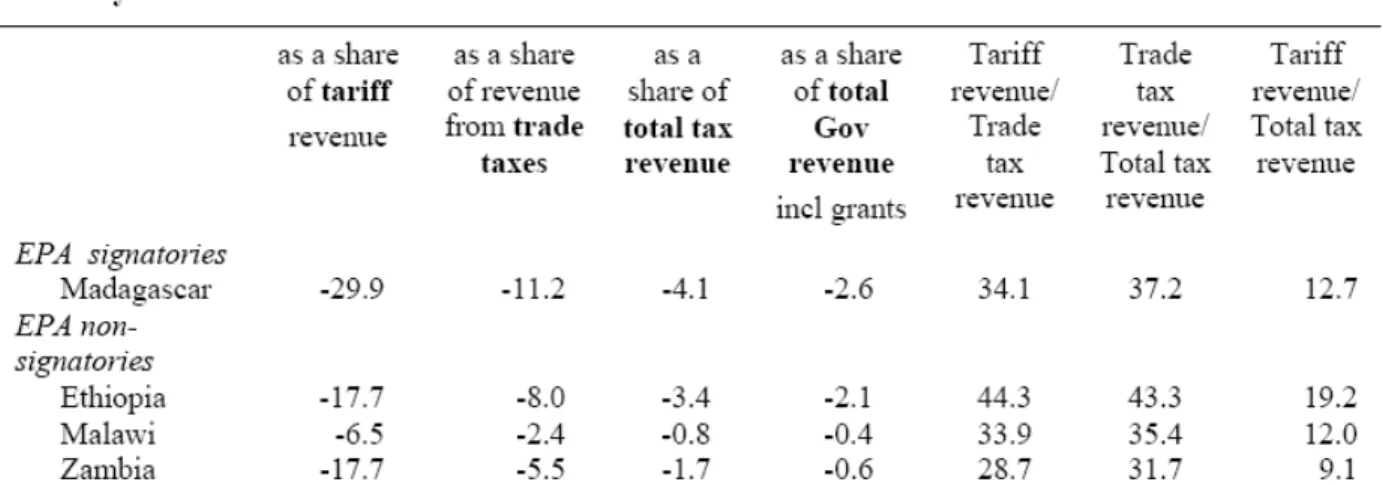
as a consequence, significantly overstated the likely revenue losses to be expected from implementing interim EPA” and mentions the most recent estimates of Breton, Hoppe and Von Uexkull (2007)13 made for four African LDCs (Madagascar, Ethiopia, Malawi, Zambia), which considers far more accurate. According to these authors the losses on
revenues arising from eliminating tariffs on EU’s imports on those four countries ranges
between 1% and 4% of total tax revenues, significantly below the numbers presented in the above table. They factored in tariff exemptions (which allowed to make the correction through statutory tariffs) as well as revenues from VAT and excise taxes on imports (which according to the study are responsible for 56%-71% of revenues from taxes in the four-country sample and increases as imports rise on the back of tariff cutting). Furthermore, the estimates assumed the elimination of tariffs on 100% of imports from the EU and not on 80%, making them reinforce the conservative nature of the study.
13 Brenton, Paul, Mombert Hoppe, and Erik von Uexkull, 2007. ―Evaluating the Revenue Effects of Trade Policy
Options for COMESA countries: the Impact of a Customs Union and an EPA with the European Union‖. Paper
Table 3: Estimated revenue Losses from EPAs for Four COMESA Countries (assuming elimination of tariffs on all imports from EU)
Source: Brenton, Hoppe and von Uexkull, 2007 (cited in World Bank, 2008d)
Nonetheless, World Bank (2008d: 22) also reports the work of Baunsgaard and Keen (2005)14, which using a panel data for 111 countries over a period of 25 years concludes that high to middle income countries have been successful in replacing
revenues lost due to tariff reductions whereas ―(…) revenue recovery has been extremely weak in low-income countries (which are those most dependent on trade tax revenues):
they have recovered, at best, no more than about 30 cents on each lost dollar. Nor is there
much evidence that the presence of a value-added tax has in itself made it easier to cope with the revenue effects of trade liberalization”.
Despite noting the controversial nature of the revenue loss issue, the world international organization concludes that “(…) all countries desiring to integrate into the
global trading system must sooner or later replace tariff revenues with increased domestic taxation”, making a clear call for domestic tax systems strengthening and
14Baungaard, Thomas, and Michael Keen, 2005. ―Tax Revenue and (or?) Trade Liberalization‖. IMF Working Paper
improved tax and customs administration. Furthermore, it emphasises that as elimination of tariffs “(…) will take place, in most cases, 10 to 15yrs from now, EPA-signatories will
have a long period in which to strengthen their revenue systems in anticipation of these losses, which in most cases should be manageable”.
Whilst there seems to be a consensus regarding the need to improve the functioning of the tax administration system, it is more doubtful whether increasing domestic taxation is reasonable for many of these economies, which already have to deal with high poverty incidence. Even if this is made there is no guarantee it will be able to compensate for the revenue loss on the back of tariff elimination. Furthermore, as it will be deeper developed on Chapter II, the elimination of tariffs negotiated on EPAs is not being as spread over the transition period as one would expect, not providing these economies with the necessary time for strengthen their revenue systems.
3. ACP Countries Structural Constraints
The reciprocal trade regime under the framework of EPA’s has several important implications to ACP countries, which gain greater importance in the context of the significant structural constraints these countries already face, which invariably translate
into higher production costs, capping ACP countries’ competitiveness. Alpha et al. (2005:
achieving sustained growth, closing the knowledge gap is more vital than improving
efficiency or increasing available capital”.
Table 4: Comparison of Average Ranking of Major Developing Regions in Business Climate and Competitiveness indicator, 2007-2008
Source: Doing Business 2008 and the Global Competitiveness Report 2007-2008 (cited in Worl Bank, 2008d)
According to UNECA (2003) electricity and transport costs in Africa are seen by 65% of surveyed businesses as restrictively high. Regional integration can play an important role in what regards to lowering electricity, transport and telecommunication costs, as in some regions markets are too small to realize full economies of scale in network services and their regulations.
3.1. Infrastructure and Trading Costs in Africa
In European markets, ACP countries face the fierce competition of Asian and Latin American countries, particularly on tropical products. According to a recent research
released by the World Bank (2008:1), high costs of trade can cap a country’s trade
final goods. According to the study ―African countries are among those having the highest trading costs in the world, and that for several types of costs”, a performance which is largely put to poor infra-structure and weak institutional bodies whilst the report in itself plays down the importance of tariff barriers, considered to be relatively low across all countries.
In fact, when looking further into trading costs in Africa several other dimensions have to be taken into account, such as geography (15 landlocked countries in Africa15), the political stability, the infra-structural capability and institutional quality/development of those countries as well as of the neighbouring transit countries to targeted markets.
Table 5: Transit Costs in Selected African Countries and World Groups, 2001
Source: UNECA (2003), compiled from UNCTAD data
15 These landlocked countries are Botswana, Burkina Faso, Burundi, Central African Republic, Chad, Ethiopia,
Trade costs comprise all the costs incurred in supplying a final good to the end user and this includes from getting information about market conditions in the foreign market until the final payment is made. The definition is wide enough to include all the extra costs incurred in order to comply with the demands from the foreign market under target
(which wouldn’t occur if the product was sold domestically), which means that RoO and
SPS mentioned above should also be factored into as trade costs.
World Bank (2008:3) cites an Anderson and Van Wincoop work dated from 200416 on trade costs sources which concludes on a rough 170% estimate (in terms of ad-valorem
equivalent) of representative trade costs for industrialized countries, breakdowned as follows: 21% for transportation costs, 44% for border-related trade barriers and 55% for retail and wholesale distribution costs.
3.1.1. Transport Costs
African countries face much higher transport costs than the developed world as one can see from the figure below, which illustrates the costs of shipping a standard 40-foot container from Baltimore to several cities, based on information provided by international freight forwarders and their respective geographical distance. Inland transport for landlocked African countries weight on the costs structure; although the distance from Baltimore to the port city of Durban (South Africa) is pretty much the same as the distance to Mbabane (the capital of landlocked Swaziland), shipping costs to the latter are around 5 times higher than to the former city.
16 Anderson, James E., and Eric Van Wincoop, 2004, ―Trade Costs‖, Journal of Economic Literature, 42 (3), pp
Figure 2: Comparison of Shipping Costs (2002)
Source: Busse (2003)17 (cited in World Bank, 2008:23)
17Busse, Mathias, 2003, ―Tariffs, Transport Costs and the WTO Doha Round: The Case of Developing Countries‖.
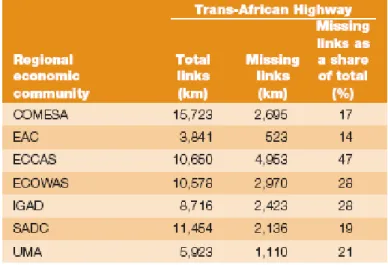
Table 6: Physical Integration in Selected Regional Economic Communities in Africa (2000)
Source: UNECA (2003)
3.1.2. Customs Procedures
Simple and transparent procedures at custom administrations also translate into lower trade costs. A study from Djankov, Freund and Pham dated from 2006 concludes that ”(…) each day of delay at customs is equivalent to a country distancing itself from its trading partners by additional 85km”. It also has to be taken into account that this sort of delays also produces additional storage and wages costs.
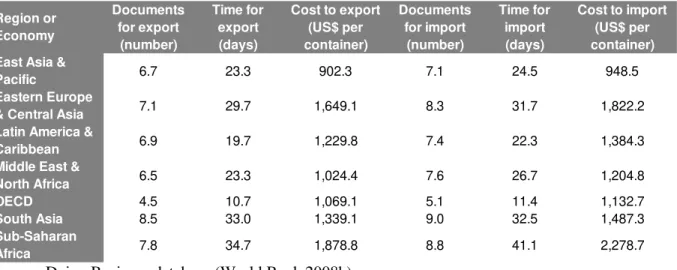
According to the World Bank 2008 Doing Business Report, Sub-Sahara Africa (SSA) is the region that demands for the highest number of export and import procedures, holding also the higher import and export costs18.
18“Doing Business reports the official fees levied on a 20
-foot container in US dollars associated with completing the procedures to export or import the goods, which include costs for documents, administrative fees for customs
Table 7: Trading Across Borders (2008) Region or Economy Documents for export (number) Time for export (days)
Cost to export (US$ per container) Documents for import (number) Time for import (days)
Cost to import (US$ per container) East Asia &
Pacific 6.7 23.3 902.3 7.1 24.5 948.5
Eastern Europe
& Central Asia 7.1 29.7 1,649.1 8.3 31.7 1,822.2
Latin America &
Caribbean 6.9 19.7 1,229.8 7.4 22.3 1,384.3
Middle East &
North Africa 6.5 23.3 1,024.4 7.6 26.7 1,204.8
OECD 4.5 10.7 1,069.1 5.1 11.4 1,132.7
South Asia 8.5 33.0 1,339.1 9.0 32.5 1,487.3
Sub-Saharan
Africa 7.8 34.7 1,878.8 8.8 41.1 2,278.7
Source: Doing Business database (World Bank 2008b)
3.2. Trade Restrictiveness Indices
There is a variety of trade policy-related barriers that raise the cost of trading, from tariffs (ad valorem and specific), quotas, the combination of both in tariff-rate quotas,
antidumping, countervailing duties, safeguard measures, non-automatic licensing, subsidies, among others. Trade restrictiveness takes the form of all them though it’s hard
to get an index that comprises them all. There are two indexes that intend to measure trade restrictiveness developed by Kee, Olarreaga and Nicita (2006)19: the Overall Trade Restrictiveness Index (OTRI) and the Tariff Trade Restrictiveness Index (TTRI). According to World Bank (2008:5) they “(...) represent the ad valorem tariff which, if
applied by an importing country to all imports, would result in a total import level equivalent to that prevailing under current policy settings”.
The major difference between the two is whereas the OTRI gathers all the information on such policies provided by international organizations operating on the field (International Trade Centre (ITC), United Nations Conference on Trade and Development (UNCTAD) and WTO) – which include from ad valorem tariffs, to specific
19Kee, Hiau looi, Alessandro Nicita and Marcelo Olarreaga, 2006 ―Estimating Trade Restrictiveness Indices‖, Policy
duties as well as non-tariff measures in the form of price control measures, quantitative restrictions, monopolistic measures of technical regulations - the TTRI is confined to
ad-valorem and specific tariffs. OTRI’s scope is therefore wider, containing many of the
issues that strangulate trade the most in nowadays, though it is criticized by some for measuring government restrictiveness and not protectionism, since it is hard to distinguish when non-tariff measures are driven by protectionism or instead if they have the purpose to safeguard human, animal or plant health. Even admitting such limitation, it seems pretty obvious that TTRI clearly underestimates the level of protection in the market. Furthermore, and according to World Bank (2008:5), non-tariff barriers contribute an additional 70% on average to the level of restrictiveness resulting from tariffs alone.
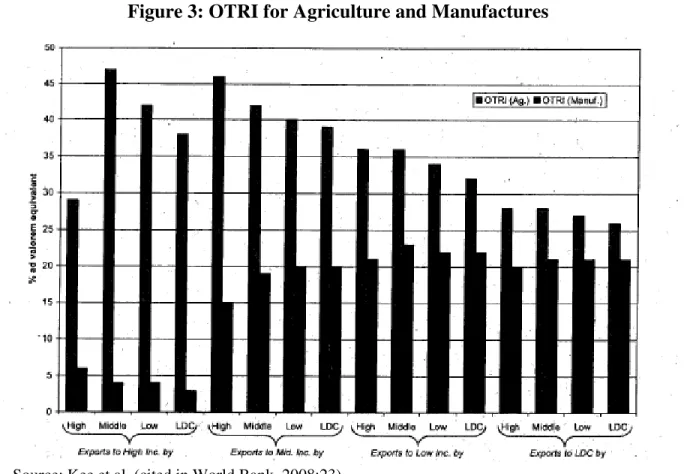
3.2.1. Trade Restrictiveness Higher for Agricultural than Manufactured Goods
The figure below shows that OTRI is on average twice as high for agricultural products as for manufactured goods, numbers which reinforce Stiglitz (2006:75) argument that restrictive trade policies have been focused on agricultural products (which also represent African countries key exports sector) as compared to manufactured goods. According to the author “trade negotiations led by the advanced industrial countries under the auspices of GATT, the General Agreement on Tariffs and Trade, (…) focused
on liberalization of trade in manufactured goods, the comparative advantage of the
advanced industrial countries. There was limited trade liberalization in the areas
important for developing countries, such as agriculture and textiles. Textiles remained
subject to strong limits (quotas) on a country-by-country, product-by-product basis;
Figure 3: OTRI for Agriculture and Manufactures
Source: Kee et al. (cited in World Bank, 2008:23)
When focusing our analysis on Agriculture it is interesting to see that Japan, followed by the EU are those holding the highest overall trade restrictiveness towards that sector; manufacturing, on the contrary, face the lowest restrictions. In face of such evidence, the world multilateral organisation has been wording increasing concerns towards unfair treatment against developing economies, as noted on a speech by its Director General Pascal Lamy: “(…) Trade opening and rule-making are indeed major goals of the WTO. But today a number of the current substantive rules of the WTO do
perpetuate some bias against developing countries. This is true for example with rules on
subsidies in agriculture that allow for trade-distorting subsidies which tends to favour
developed countries. This is also true when we look at the high tariffs that many
developed counties apply on imports of agricultural and industrial products, in particular from developing countries.”20
Table 8: OTRI and TTRI (percent), for the Four Largest Traders, 2006
Source: Global Monitoring Report (World Bank, 2008c) Note: TTRI in italics; OTRI in boldface font
3.2.2. Developing Economies Facing and Imposing the Highest Protectionism
OTRI also puts on evidence that low and middle income countries have been the ones facing and imposing highest levels of protection at the same time. The level of overall trade restrictiveness is, on average, higher for Middle East & North Africa, South Asia, Latin America & the Caribbean and Sub-Sahara Africa as opposed to two of the largest countries traders21, the US and EU.
Table 9: OTRI and TTRI (percent), by Developing Country Region, 2006
Source: Global Monitoring Report (World Bank, 2008c) Note: TTRI in italics; OTRI in boldface font
Figure 4: Change in Overall Trade Restrictiveness Index (OTRI), 2000-2006
Source: Global Monitoring Report (World Bank, 2008c)
CHAPTER II
ECONOMIC PARTNERSHIP AGREEMENTS: CONCEPT AND
EXTENSION
The round of EPAs negotiations started in September 2002 and initially aimed to be concluded by December 2007. However, only a small number of countries closed full deals by this time, so most countries are trading with the EU on the grounds of interim EPA agreements (IEPA). This Chapter proposes itself to look into EPAs origin, assessing the factors and rational behind the concept, and also to investigate whether these agreements are to be considered inevitable (Section 1). It then focuses on the negotiation process as well as on the speed and size of the proposed trade liberalisation for ACP countries (Section 2). EPAs were flagged by the EU as a tool to foster ACP countries’ regional integration process and therefore this Chapter intends to evaluate to which extension this target is being met (Section 3).
1. Economic Partnership Agreements: Origin and Scope
for the modification of the trade regime, with the new trade regime to be implemented by 2008 (Stevens, 2008: 211-212).
1.1. Non Compliance with WTO’s Most Favoured Nation Principle
According to the MFNP all trade advantages granted by one country to another one or a group of countries must, automatically, be extended to all WTO member states unless those trade preferences are reciprocal under the framework of a free trade area (FTA) or a customs union (XXIV article of the GATT agreement). Least Developed Countries (LDC) comprise an exception - they enjoy from a new Generalized System of Preferences (GSP) comprising the EBA initiative, which excludes them from compliance with the MFNP imposed by the WTO, meaning they are allowed to keep on benefiting from non-reciprocal trade preferences.
Furthermore, the XXIV article of the GATT agreement provides a rather vague definition of a customs union or FTA, stressing out that those agreements should comprise a substantial part of trade and extend over a reasonable period of time. A FTA
“shall be understood to mean a group of two or more customs territories in which the duties and other restrictive regulations of commerce are eliminated on substantially all the trade between the constituent territories in products originating in such territories”. As the article is subject to different readings, the EU assumes that “substantially all
trade” corresponds to 90% of all trade (free of customs duties and non-tariff barriers and no sector can be excluded on its whole) between the FTA members and the time horizon
for FTA’s implementation extends up to 12 years.
1.2. ACP Countries Trade Preferences Erosion
special trade regime did not improve the position of ACP countries in world trade, even as the number of countries was enlarged; statistical data point instead to a deterioration. Alpha et al. (2005:11-12) note that when narrowing the scope of analysis towards Europe, the conclusion remains broadly unchanged, as over the last 20 years ACP countries market share in European imports has fallen from 8% down to 3%. The erosion of trade preferences of ACP countries worked, mostly, to the benefit of Asian countries, notwithstanding the fact that none of these countries has enjoyed from preferential trade treatment. According to the World Bank (2008:1) Africa’s market share on total world exports has fallen by around two thirds in the last three decades, passing from 2.9% in 1976 to 0.9% in 2006. The numbers provided by WTO online data and compiled by UNECA (2008b) point to a slightly higher market share, of around 2,99% in 2006, but which still marks a noticeable downfall from the 5.98% high recorded back in the early 80s.
Figure 5: Africa’s Share of Total World Exports (%)
Source: WTO online data (cited in UNECA, 2008b)
introducing a reduction of tariffs (that was the case of fruits and vegetables with Mediterranean countries, for example); (iii) the reform of Common Agriculture Policy (CAP) in June 2003, levelling European prices off with world levels and as such penalising ACP countries which in most cases have benefited from this higher prices; (iv) the new GSP which comprises the EBA initiative for LDC. Also, the structural constraints ACP countries face, mentioned on Chapter I, which translate into higher production costs
capping ACP countries’ competitiveness, do not allow these countries to follow the pace of growth of other developing economies like Asian, for instance.
Many ACP countries will have many difficulties in coping with the liberalization Europe is pursuing at the multilateral and bilateral level, as EPAs are implemented. Oxfam (2008:20) calls attention to competition from other developing countries, which
ACP countries won’t handle. “Through WTO talks, the EU is set to reduce its tariffs on tuna from 24 per cent to 7-8 per cent, which is likely to displace exports from Papua New
Guinea in favour of Thailand and others; Malawi’s tobacco exporters stand to lose $3m
to subsidised US exporters; Senegal and Mozambique will lose over $8m on prawns and
fishery products as Argentina and Brazil increase their market shares; and Madagascar
is set to lose out to Hong Kong, China, India and Tunisia in its garment and carpet
sectors.”.
1.3. EPA as Free Trade Agreements – an Inevitable Option?
As a result of such criticism and after benefiting from two waives over the compliance with MFNP – one during the Lomé Convention IV-bis (1995-2000) and another over the Cotonou Agreement (2000-2007) – but with the commitment of not asking for a third dispensation, the EU initiated the reform of its commercial regime towards non-LDC ACP countries.
It is important to mention Oxfam (2008:6) call on this issue, as according to the Non-Governmental Organisation (NGO) the option for a FTA was more a choice than a need, emphasising that EU could have opted for unilateral preferences for trade in goods, as the WTO admits the possibility of developed countries opening their markets to developing countries without reciprocity when in face on major differentiation between developing countries “(...) based on objective and transparent development criteria”. EPAs are not compulsory for the LDC ACP countries, which might opt for the alternative of the new GSP (EBA). The GSP has three levels of tariff: the standard applied to all ACP countries apart from LDC; the EBA covering LDC; and the GSP+ regime which only covers those countries that applied during 2005 (but to which no ACP country applied) (Stevens, 2008:213).
Oxfam (2008:6) notes that EU intentions to turn these trade agreements into pro-development tools for ACP countries were misguided and that instead these could compromise the latter development process as they cap their flexibility to use policies of their choice (chapter IV will tackle these issues). EU’s proposal consisted of classic free trade agreements texts, much similar to EU bilateral agreements with Chile and Mexico, which do not take into consideration ACP countries regional differences. The NGO cites a study from Boeut (2007)22 which states that ACP countries will actually be worse off, as
“(...) under EPAs, European meat exports to most ACP countries were predicted to shoot up by 180%, while every other country grouping measured would see its exports decline by 30%”.
While assumed in theory it is interesting to look further into ongoing negotiations and the content of EPA’s final agreements to access the level of asymmetry on the trade relations between the two ―partners,‖. It is also intended to see whether EPA’s agreements
are strictly complying with WTO rules or if they are going beyond what is required by the multilateral organisation, what, if actually happening, might compromise ACP countries
22 A.Boeut (2007) ―Searching for an Alternative to EPAs‖, IFPRI, Research Brief Number 10, December 2007.
negotiation capabilities and tools in the context of an increasingly globalized world. Chapter III will address these issues.
2. EPA’s Timetable and Negotiations Update
The round of negotiations carried out between the EU and ACP countries to forge
EPA’s started in September 2002 and initially aimed to be concluded by December 2007.
Due to fundamental differences in position and capacity constraints only a few number of countries was able to close full EPA agreements by this time - 15 CARIFORUM members comprising a full regional EPA23 out of a total of 76 countries (ECDPM, 2007/2008: 22-23). Criticism grew towards EU unrealistic timetables, the wide scope of issues under negotiation24 and the related negative social consequences, but still the 2007 deadline was maintained, under EU’s threat to raise tariffs over the imports of the ACP non-LDC that did not signed an EPA (or an interim EPA) by then. Signed agreements are now entering the ratification phase by the EU as well as national parliaments, and while this is not completed, the IEPAs are applied provisionally.
Negotiations were supposed to be carried out with a group of countries and not countries individually. Each country had to choose the regional zone which best served its interests. Six regional blocks were initially involved in EPA’s negotiations with the EU: Central Africa (CEMAC), West Africa, Southern Africa Development Community (SADC), East and Southern Africa (ESA), Caribbean and Pacific, which cut across ongoing regional integration efforts. Nonetheless, the majority of countries refused to close any deal and only those holding a weaker position – 18 countries and two Pacific countries – decided to initiate deals by December 2007, which in practice gave body to a rising number of bilateral agreements, negotiated within a short period of time. In the second half of 2007 five countries of the EAC (Burundi, Kenya, Rwanda, Tanzania and
23 On December 16th 2007, 15 Caribbean countries (mostly non-LDCs) concluded a full regional EPA with the EU.
24 The Caribbean full EPA deal covers trade in goods but also trade in services as well as other areas such as
Uganda) announced they would like to negotiate as a new region, what would take place on December, combining members of ESA and SADC-minus (Stevens, 2008:215). EAC countries participate in ESA meetings though they hold separate negotiations with the EC in parallel.
Over 2008 negotiations towards comprehensive regional EPAs have been carried out in all regions, in accordance with the rendez-vous clauses contained in IEPAs. These clauses refer mostly to trade in services and trade related issues and the deadline was for them to be concluded by the end of 2008 (except for the agreements with ESA and EAC, which did not had a timeframe), but evidence seems to point towards an extension of discussion well into 2009 (EBCAM, 2008:1-4).
2.1. EPA’s: Liberalising How Far, How Fast?
Ongoing negotiations involve important issues such as the list of products that might
be excluded from EPA’s negotiations, timetables and the development component EPA’s
should integrate (ECDPM, 2006b: 1-3). EU intends the final EPA’s agreements to be
gradually applied so that by 2020 trade liberalization might be completed. (ECDPM, 2007/2008: 22-23).
At the time of writing this dissertation, most countries were trading with the EU on the grounds of interim agreements (covering mainly goods), as full EPAs were still under negotiation. The EU wants all 35 ACP countries that initialled deals to sign them by July 2009, but the odds of this happening are small. Furthermore, over 2008 and 2009 all 76 ACP countries are expected to have full EPA negotiations completed. Beware that initialled EPA deals are not legally binding, so up until the full EPA is agreed, ACP countries can still put the issues of their interest to debate (Oxfam 2008: 9).
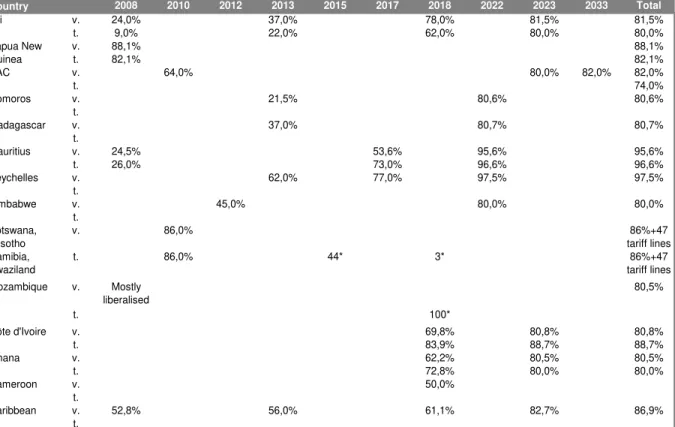
to 2022/23). Mozambique and Papua New Guinea detach themselves for agreeing on the fasted liberalization schedules, to be concluded as soon as 2008.
Table 10: Liberalisation Schedules Agreed in initialled Interim EPA Agreements Country 2008 2010 2012 2013 2015 2017 2018 2022 2023 2033 Total
v. 24,0% 37,0% 78,0% 81,5% 81,5%
t. 9,0% 22,0% 62,0% 80,0% 80,0%
v. 88,1% 88,1%
t. 82,1% 82,1%
v. 64,0% 80,0% 82,0% 82,0%
t. 74,0%
v. 21,5% 80,6% 80,6%
t.
v. 37,0% 80,7% 80,7%
t.
v. 24,5% 53,6% 95,6% 95,6%
t. 26,0% 73,0% 96,6% 96,6%
v. 62,0% 77,0% 97,5% 97,5%
t.
v. 45,0% 80,0% 80,0%
t. Botswana, Lesotho
v. 86,0% 86%+47
tariff lines Namibia,
Swaziland
t. 86,0% 44* 3* 86%+47
tariff lines v. Mostly
liberalised
80,5%
t. 100*
v. 69,8% 80,8% 80,8%
t. 83,9% 88,7% 88,7%
v. 62,2% 80,5% 80,5%
t. 72,8% 80,0% 80,0%
v. 50,0%
t.
v. 52,8% 56,0% 61,1% 82,7% 86,9%
t. Caribbean
v: cumulative value of imports from the EU, to be liberalised by the specific year. t: cumulative percentage of tariff lines, to be liberalised by the specified year * additional number of tariff lines to be liberalised by the specified year
Mozambique Côte d'Ivoire Ghana Cameroon Madagascar Mauritius Seychelles Zimbabwe Fiji Papua New Guinea EAC Comoros
Source: ECDPM (2007/2008: 22)
This means that ACP countries have only around 20% for protection of products from competition of European exports, what, as Oxfam (2006:4) notes, “(…) would
effectively squeeze ACP governments into choosing between maintaining tariffs on
valuable revenue-raising imports such as cars and electronics; protecting staple food
Figure 6: Pace and scope of import liberalisation in EPAs (deals initialled in December 2007)
Note: EAC is the East African Community comprising Kenya, Uganda, Rwanda, Burundi and Tanzania; SACU is the Southern African Customs Union. To date, four SACU members (Botswana, Lesotho, Namibia and Swaziland) have submitted a common liberalisation schedule.
Source: Oxfam (2008:15)
longer period than was initially expected and some authors even admit the possibility that these become permanent.
3. EPAs: a Deadlock to ACP Regional Integration Process?
Soon EPAs were dropping one of the pro-developments goals they had flagged when first announced - promote regional integration among ACP countries. This latter has assumed a key role in the Cotonou Agreement and in ACP countries’ development strategies. Advantages associated with regional integration are well known, triggering the creation of custom unions, FTA and even monetary unions around the globe. Wider markets, economies of scale, increases in trade and investment, better diversification and a migration towards the production of higher value added products, trading with a wider and higher number of trading partners are just some of the benefits related to regionalism.
3.1. Constraints to African Regional Integration Process
However, as Ferreira (2005:65) points out, and in what regards to regional integration in Africa, the process assumed more an expression of economic cooperation rather than a real regional market integration, as the economic theory of integration
portends. In fact, not only did Africa’s importance on international trade has diminished
Table 11: Africa’s Intra-Africa and Multilateral Trade, 1994-2000
Source: UNECA (2003)
Whilst acknowledging that EPAs represent a deadlock to African countries regional integration, it is important to bear in mind that the African regional integration process in itself has met little progress since a wave of independences crossed the continent, back in the 60s. Obstacles to regional economic integration in Africa are numerous, holding an economic, political, social, cultural and even historical nature.
hurdles in the work out of economic and politic systems; u) high donors’ dependence; v) foreign countries’ dominance over access to markets; x) unrealistic calendars.
Figure 7: African Countries Overlapping Membership in Regional Economic Communities (number of countries)
Source: UNECA (2003)
3.2. Large Differences of Tariffs among ACP Regional Blocks Negotiating EPAs