M
ESTRADO
D
ESENVOLVIMENTO E
C
OOPERAÇÃO
I
NTERNACIONAL
T
RABALHO
F
INAL DE
M
ESTRADO
D
ISSERTAÇÃO
I
NFORMATION
M
ANAGEMENT IN
D
ISASTER AND
D
EVELOPMENT
:
G
EOGRAPHIC
I
NFORMATION
S
YSTEMS
R
OBERTO
S
AN
M
ARTIN
MESTRADO EM
D
ESENVOLVIMENTO E
C
OOPERAÇÃO
I
NTERNACIONAL
T
RABALHO
F
INAL DE
M
ESTRADO
D
ISSERTAÇÃO
I
NFORMATION
M
ANAGEMENT IN
D
ISASTER AND
D
EVELOPMENT
:
G
EOGRAPHIC
I
NFORMATION
S
YSTEMS
R
OBERTO
S
AN
M
ARTIN
O
RIENTAÇÃO:
J
OANAP
EREIRAL
EITEJ
OSÉM
IGUELO
LIVEIRAC
ARDOSOP
EREIRAAbstract
This research considers the theoretical and practical link between long-term sustainable development and disaster management. The aim is to develop a theoretical framework and a methodology which allows the use of Geographic Information Systems (GIS) to manage the related information. Literature review leads us to understand development and disaster management as part of a learning cycle. Within this context, a common approach to information management is suggested to support the decision-making process in a cost-effective manner. A
“universal” GIS is proposed to integrate information management for development and disaster
while exploring the interactions between projects and project and the related geography which is considered a complex reality full of synergies between space, ecosystem, society, culture and economy. Study of academic production, practical implementations, interviews and a limited GIS application (using ArcMap and QGis) are used to endorse the capabilities of this concept. These capabilities are limited by lack of free information and cost of data gathering, interoperability and other technical issues. Open-source and crowdsourcing may solve some limitations while others need further research.
Key words
Disaster, development, information management, GIS
List of Acronyms
ADW Alliance Development Works
CECIS Common Emergency and Information System
EC European Commission EU European Union
DRR Disaster Risk Reduction
FAO Food and Agricultural Organization
FEMA Federal Emergency Management Agency
GDP Gross Domestic Product
GIS Geographic Information Systems
HHI Harvard Humanitarian Initiative
HC Humanitarian & Emergency Relief Coordinator
HFA Hyogo Framework for Action
HeRAMS Health Resources Availability Mapping System
IASC Inter-Agency Standing Committee ICS Incident Command System
JBGIS Joint Board of Geospatial Information Societies
LogFrame Logical Frame Approach
MIRA Multi-Cluster/Sector Initial Rapid Assessment
NIMS National Incident Management System NRF National Response Framework
ODI Overseas Development Institute OSR Oil Spill Response
PCM Project Cycle Management UN United Nations
UNDP UN Development Programme
UNISDR UN International Strategy for Disaster Reduction
UNEP UN Environment Programme
UNOCHA UN Office for the Coordination of Humanitarian Affairs
USDHS United States Department of Homeland Security
V&TCs Volunteer and technical communities
WB World Bank
Content Overview
1. Introduction 1
2. Methodology 2
3. Theoretical Framework Linking Disaster Management and Long-Term Sustainable
Development 3
3.1. Need for a Common Approach 3
3.2. Disaster Response: Strategies and Information Management 7
3.2.1. UN – Cluster Approach 7
3.2.2. US – National Incident Management System (NIMS) 10
3.2.3. Information Management 11
3.3. Disaster Prevention: Risk Reduction Strategies and Information Management 12
3.3.1. Institutional Framework and Practical Application 13
3.3.2. Information Management 14
3.4. Long-term Sustainable Development: Theory, Practice and Information
Management 16
3.4.1. Practical Implementation of Development: Need for Indicators 18
4. Geographic Information Systems: a Tool to Manage Disaster and Development
Information 19
4.1. GIS concept 19
4.2. GIS capabilities 20
4.3. GIS Applied to Development and Disaster: Advantages and Limitations 21
4.4. GIS: Practical Application in Disaster Management and Development 23
4.4.1. Information Management Using GIS 23
4.4.2. Sources of Information 25
4.4.3. GIS Software Options and Associated Cost 28
4.5. GIS Hypothetical Implementation 30
5. Conclusions: 32
Bibliography 35
Annex 1. Natural Disasters (1990-2011) Economic Lost / Death Toll 39
Annex 2. UN Institutions Involved in DRR 40
Annex 3. Projects Aiming to Standardise Needs Assessment. 40
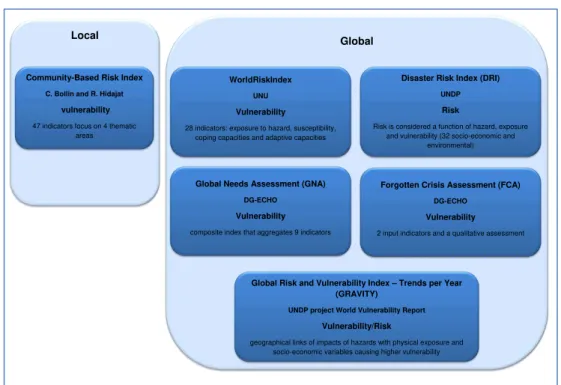
Annex 4. Vulnerability and Risk Quantifying Projects 41
Annex 5. Global Development Indexes 41
Annex 6. GIS - Graphic Examples. 42
1 | P a g e
1. Introduction
This paper considers the information management concept within disaster1
management (prevention/mitigation, preparedness and response) and long-term
sustainable development (planning, monitoring and evaluation)2.
Disaster management and development have synergies and requirements which can be addressed within a common approach. Both require management of structured information, accurate, easily accessed, displayed and updated.
The objective is to develop a conceptual framework and ultimately a methodology which sets the basis to use geographic information systems (GIS) to support that common information management.
Information management cannot be limited to the acquisition, storage, access, and transfer of data. There should be a systematic approach to the information inflow, sharing, analysis and display to support the decision-making process.
To sustain this concept the type of information, management needs and available tools are outlined. This reflection leads to the development of a tool which could deal with a wide range of information linked to both areas.
The project is structured in two parts;
Development of a theoretical and conceptual framework linking disaster
management and long-term sustainable development;
GIS possibilities to managed information related to these activities.
A 4-step approach is applied:
1. Human development and technocratic theories are used to support a link
between disaster management and development, to justify a common approach and to identify shared areas and common requirements;
2. Disaster response methods extensively applied in different types of crisis
along the years are studied; United Nations Office for the Coordination of Humanitarian Affairs (UNOCHA) Cluster approach and US National Incident Management System (NIMS);
1 Disaster:
“A serious disruption of the functioning of a community or a society involving widespread human, material, economic or environmental losses and impacts, which exceeds the ability of the affected community or society to cope using its own resources.” (ISDR 2009)
http://www.unisdr.org/we/inform/terminology 2
2 | P a g e
3. Approach to disaster prevention based in theories backed by the
international community and the Disaster Risk Reduction (DRR) strategies defined by them;
4. Approach to development based on a comprehensive consideration of the
human development theory including the need for a long-term scheme and the preservation of the environmental balance.
Development and disaster management are revealed part of the same learning process needing structured information management. This process is also affected by crosscutting issues as gender and social equity, climate change, etc.
The second part, studies the development of a tool which could address common requirements with the advantages of geographically organising information.
GIS is introduced as a tool to support information management within the decision-making process. Technical possibilities and limitations are identified to determinate this potential and actual implementations are considered.
In summary, the scope of this paper is to develop a theoretical and conceptual framework and ultimately a methodology which could set the basis to extend the use of GIS for the management of disaster and development information. It opens the way to further research which should determinate the information needed, its acquisition and analysis along with the way to be displayed and used.
2. Methodology
The theoretical framework is based on the review of several studies and literature related to the human development theory and technocratic approaches. The practical implementation of these approaches is studied based on procedures widely supported by the international community. The goal is to contemplate the path from the academic to the political domain. For each point, the information management needs are outlined and interactions identified to develop a common approach.
3 | P a g e
3. Theoretical Framework Linking Disaster Management and Long-Term Sustainable Development
3.1. Need for a Common Approach
The link between development and disaster management may be studied from different perspectives. The traditional/neoclassical approach and human development theories are both considered.
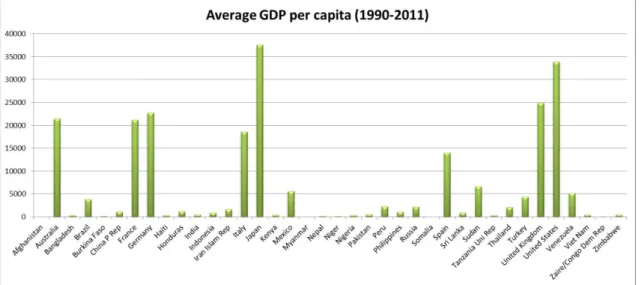
A traditional approach could be applied comparing the effects of disasters in societies with different levels of development (UNDP 2004). In general, disasters in rich countries cause more material cost but take fewer lives (Ferris 2012).
To endorse this assertion the death toll and economic cost caused by natural disasters from 1990 until 2011 are compared (Annex 1). The number of deaths is a reliable indicator while economic loss calculations usually comprise only direct cost (indirect and secondary cost, which may be higher, are not computed).
Difference in impact becomes evident when crosschecked with the “traditional”
development indicator; average gross domestic product (GDP) per capita.
Country GDP Deaths Economic Loss
Haiti US$411 237,623 US$8,332,620
Bangladesh US$391 159,758 US$13,661,800
Japan US$37,590 27,160 US$418,098,300
USA US$33,899 8,775 US$568,857,440
Table 1 - Information extracted from Annex 1.
Disregarding factors like total population or number of occurrences, one explanation is that a more developed economy can afford to pay the cost of
“technocratic” measures to minimise the effects of disasters. The US government can pay for barriers to control the sudden increase of sea levels. Japan can implement earthquake-proof construction policies. While poorer countries cannot afford to prepare themselves for coming hazards and disasters are paid with lives.
A similar logic could be applied to procedures for early warning, measures to mitigate the effects of a disaster or to post-disaster recovery. More economically developed communities can pay their way out of disastrous situations and set the path to recovery faster than poorer ones.
4 | P a g e
they cannot be matched. This consideration can be extended to comparing development between communities. Communities face development in different ways. Comparisons based on GDP or per capita income lack many elements essential to the development paradigm.
A universal approach to development may be desirable, but it should also consider political, cultural, social and environmental issues. We should shift from theory to practice in order to overcome the problem of homogeneity that this universal concept may entail.
Sen’s work opens the concept of development (Sen 1981; 1984) based on the
capabilities approach which places the people at the centre of development to
improve community entitlements and resilience. The idea “what people can do”
replaces “what people have”. The question is no longer to increase income but to
enlarge people’s choices. Development is understood as a process where people
help each other to gain entitlements, to obtain access capacity; “human
development” replaces “economic development” (Haq 2008).
Following this paradigm, the relation between lower per-capita income and increased rates of disaster related fatalities is linked to reduced coping capacities of poorer communities. This suggests that high income countries have less
vulnerability and better coping capacity; extreme events are less likely to become
disasters (UNEP 2002b).
When enlarging entitlements, one of the main objectives is reducing people’s
vulnerability to increase resilience. Vulnerability is a key concept in disaster
management. Notions like preparedness3 or disaster risk reduction4 are based in
the reduction of people’s vulnerability to the consequences of hazardous events (UNOCHA 2012). The consequence of implementing this concept is an evolution from ad hoc response to systematic risk management.
3 Preparedness:
“The knowledge and capacities developed by governments, professional
response-and-recovery organizations, communities and individuals to effectively anticipate respond to, and recover from the impact of likely, imminent or current hazards events or other emergency situations, including conflicts and generalized violence, warranting humanitarian
response” (UNOCHA 2012).
4 Disaster risk reduction:
“The concept and practice of reducing disaster risks through systematic
efforts to analyse and manage the causal factors of disasters, including through reduced exposure to hazards, lessened vulnerability of people and property, wise management of land and the
5 | P a g e
Following this logic, development leads to disaster prevention. Less vulnerable communities are less affected by the exposure to hazardous situations, have a better reaction to the effects and are more capable to re-establish normal conditions. The results of the UN Development Programme (UNDP) project World Vulnerability Report confirmed this role of development in resilience capacity (UNEP 2001/2/3/3b). Disasters can be mitigated through development.
However, it is a complex issue. Hazards and development are geographically confined and have a high level of interaction. Vulnerability may be reduced but also increased through development. In addition, disasters may limit development.
In cases, disasters can be considered cause and result of failed development. Low levels of development may lead to higher number of casualties but also disaster prone areas may have low socio-economic development since infrastructures are destroyed, crops lost and investors disappear (UNEP 2001/2/3/3b). The development process may modify natural hazards. Unplanned urban development may create areas where hazardous events become large-scale disasters (UNDP 2004). Global environmental and demographic change and rapid urbanization are drivers of disaster risk increase (GO-Science 2012).
It is essential to embed DRR into development planning to address vulnerabilities, increase coping capacity and to avoid development placing people, or environment, at risk.
In general, prevention is cheaper than response but sometimes the risk has to be accepted due to cost-benefit analyses (GO-Science 2012). A well informed decision-making process by sound institutions that consider the interactions and synergies between DRR and development should lead to the adoption of cost-effective measures (WB 2010). To achieve this goal disaster risk information should be included in development policies. DRR data should be collected and feed to development planning tools (UNDP 2004).
6 | P a g e
Stepping from theory to practice, the relation between disaster management and development has already been acknowledged by the main political actors. UN structure (Annex 2), is a good example. The final document of the UN summit on
Sustainable Development “Rio+20: The future we want” makes a clear reference5. The concept has become part of the political vocabulary.
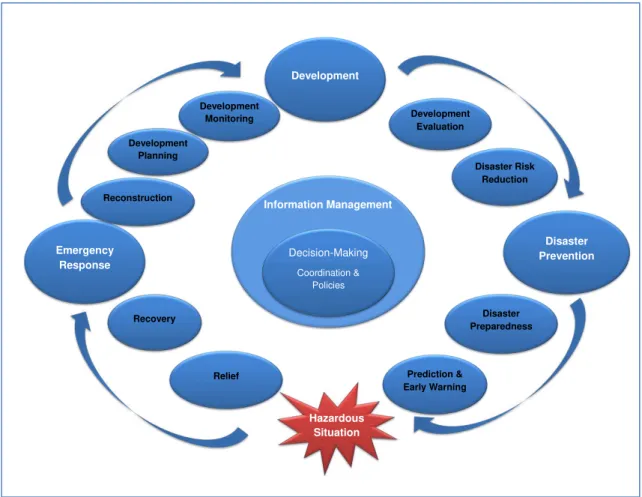
Disaster management and development can be considered a learning process to improve human wellbeing in changing environmental and socio-economic conditions. It requires assessment of needs, vulnerability, capacity, coping and resilience to facilitate planning and implementation. Planning and implementation are improved by monitoring, evaluation, impact assessment and review (Desai 2002). Since disaster is multi-causal and development a complex process, research should be multidisciplinary. A common approach and common tools are needed to provide integrated cost-effective solutions. The figure below was created to illustrate this learning cycle.
Figure 1 - Disaster and Development learning cycle (graphic by author).
55
“Rio+20: The future we want” points 186 to 189.
Information Management
Hazardous Situation
Prediction & Early Warning
Disaster Preparedness
Decision-Making
Coordination & Policies
Emergency Response
Disaster Prevention
Disaster Risk Reduction Development
Planning
Development
Monitoring Development Evaluation
Relief Recovery
Reconstruction
7 | P a g e
3.2. Disaster Response: Strategies and Information Management
The immediate response to an emergency is fundamental to minimise negative effects. Independently of the causes, the response to a crisis is multi-faceted and coordination plays a fundamental role. Institutions and organisations from different countries may be involved in delivering different types of humanitarian support in diverse areas of intervention.
Groups of experts take quick decisions based on available information. The implementation of these decisions has to be monitored and accounted for. Finally, the response has to be de-escalated and resources de-mobilised when entering the recovery phase.
Two different approaches to incidents requiring complex decisions by multi-command structures are studied: UN Cluster Approach and USA NIMS. They have been chosen due to their connotations and the significance of
implementation (UN coordinates billions of dollars of humanitarian aid6).
These approaches are described to identify main actors, information management requirements, sources of information and analysis performed to rationalise the decision-making process.
3.2.1. UN – Cluster Approach
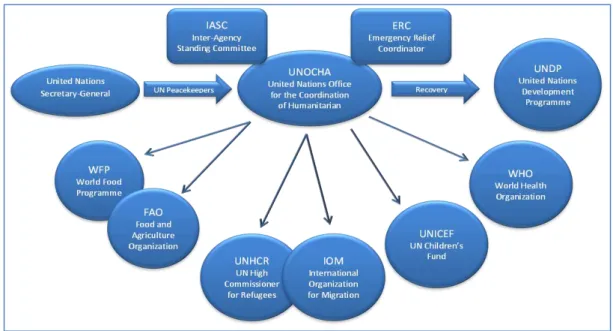
In response to major disasters different UN institutions provide support to the local response. UNOCHA provides coordination, information management and facilitates financing (Figure 2).
Humanitarian leadership is critical. To provide coordination and emergency funding UNOCHA establishes different levels: Humanitarian & Emergency Relief
Coordinator (HC), Cluster Leaders, Country Cluster Leaders … Their decisions
are based on the available information.
The HC can trigger a Flash Appeal for humanitarian funding to address acute needs following a major disaster (first edition within a week). The decision is
based on the rapid appraisal of the disaster compared to local capacities.
Decisions are managed on the ground and have to be quick and well justified. The
6 Humanitarian aid programming for 2012 was US$8.78 billion to relief 54 million people
8 | P a g e
base for the intervention is information gathered on the spot through need
assessments. Information management becomes central to emergency response.
Figure 2 - UN Emergency Response institutions overview (graphic by author, source: ISDR 2011).
UNOCHA has established some information management tools. 3W database7 is
designed to provide information concerning which organizations (Who), are running which activities (What), in which locations (Where). This web-based information is essential to coordinate avoiding gaps or duplication. However, this approach is quite general and does not intend to manage detailed information.
ReliefWeb8 and IRIN News9 are also UNOCHA’s information management tools
providing humanitarian news and analysis. However, they lack interoperability. Information flow is unidirectional losing opportunities and the possibility of a community based approach.
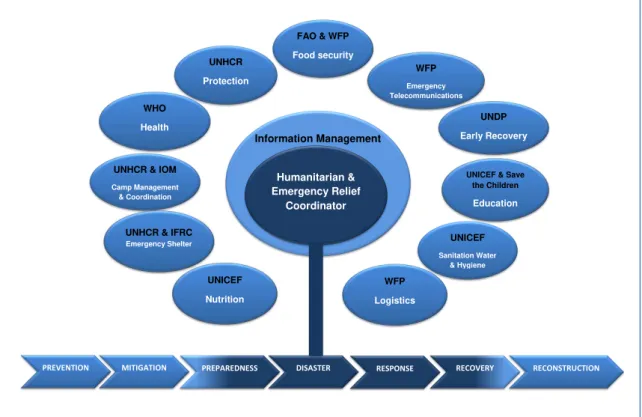
The main coordination tool is the cluster approach (Figure 3). Clusters address
cross-cutting issues (Protection, Camp Coordination/Management, and Early Recovery), functions (Logistics and Telecommunications) or thematic response (Protection, Education, Emergency Shelter, Water and Sanitation, Health and Nutrition)
7
http://3w.unocha.org/WhoWhatWhere/ 8
http://reliefweb.int/ 9
9 | P a g e
Figure 3 – Cluster Approach (Source www.unocha.org8 December 2012).
The Multi-Cluster/Sector Initial Rapid Assessment (MIRA) is used to identify
humanitarian priorities during the initial phase. The main goal is to show an operational picture based on information from primary and secondary sources.
The results are presented in a Preliminary Scenario Definition (within 72 hours)
and a MIRA Report (after 2 weeks) (IASC 2012). In addition, the different clusters
perform “in-house” initial rapid assessments, followed by inter- and intra-cluster needs assessments and single agency assessments (IASC 2012b).
MIRA Report, needs assessments and response information are consolidated in
the Humanitarian Dashboard10 designed by IASC. It provides a structured format
and presents a common cross-sectorial analysis. UNOCHA uses this tool to facilitate the coordination process. It shows data, indicators, information and analyses used by the UN.
The advantages of this matrix approach are the possibility of detecting gaps in the response, monitoring the development of the situation and performing baseline, inter-sectorial and cross-sectorial analysis. However, the decision-making process could also benefit from a more graphic approach.
10 http://ochanet.unocha.org/p/Documents/2012_Guidance_Dashboard_CAP.pdf Information Management UNHCR Protection WHO Health Humanitarian & Emergency Relief Coordinator
UNHCR & IOM
Camp Management & Coordination
UNICEF & Save the Children
Education
UNICEF
Sanitation Water & Hygiene
UNHCR & IFRC
Emergency Shelter
FAO & WFP
Food security WFP Emergency Telecommunications UNDP Early Recovery UNICEF Nutrition WFP Logistics
10 | P a g e
3.2.2. US – National Incident Management System (NIMS)
US NIMS is a systematic approach to disaster management which aims to coordinate different stakeholders (government, NGOs and private sector). It is applicable to incidents independently of cause, size, place or complexity. The goal is to lessen the loss of life and property and environmental damage (USDHS
2008). Together with the National Infrastructure Protection Plan (and its 17
sector-specific plans), works within the context of the National Response Framework
(NRF) which is part of a larger National Strategy for Homeland Security. NIMS is
the template for incident management while the NRF focuses on national policy.
The NRF is supplemented by 15 Emergency Support Function annexes assigned
to specific sections. The system is further developed and implemented at local, state and federal level by different institutions under the coordination of the Federal Emergency Management Agency (FEMA).
The decision-making process is based in situation assessment. The planning
process consists in five phases: “understand the situation; establish incident
objectives and strategy; develop the plan; prepare and disseminate the plan; and
execute, evaluate and revise the plan.11” In parallel, the response is based on: “gain and maintain situational awareness, activate and deploy resources and
capabilities, coordinate response actions and demobilize.12”
The information management needs are addressed through standard templates:
Incident Command System Forms (ICS). These forms support the implementation
of the Incident Action Plan. They contain information in the form of map, sketch,
charts, matrix and text. The information provided includes: resources, “SMART13”
objectives, command/reporting lines, timelines, location, logistic needs,
communications… (FEMA 2010). It includes also references to Analytical Data (specifically public health and environmental monitoring), Geospatial Information and Management Information Systems (related to the use of resources). NIMS is focused in information sharing. Incident reporting and documentation procedures are considered the pillar to the response organisation. The system answers the usual questions: who, what, when, where, and how.
11 USDHS 2008 page 121. 12 USDHS 2008b page 32.
11 | P a g e
However, ICS forms provide information but do not facilitate analysis. Information is made available to the command structures but does not facilitate the decision-making process. Information management is mainly considered between the institutions able to provide assistance and resources (federal, estate, local, NGOs and private sector) and to the public. The information flow is internal and/or unidirectional. It reflects US technocratic approach based in preparedness, response and short-term recovery.
3.2.3. Information Management
Both approaches have information management needs; while the US mainly uses capacities assessments, the UN basis the response on needs assessments and rights-based approaches which should not be considered in opposition but as complemented. They may be different in detail but have a common base; to obtain data, transform it into information which can be analysed and displayed together with the results of the analysis.
Information assessment and analysis should be the basis of the decision-making process to guarantee that response is appropriate, proportionate and impartial (Darcy 2003). In cases, this analysis is not facilitated by the information management tools delaying and jeopardizing the effectiveness of the response. The use of technology can improve the analysis. In addition, assessments should be standardised to improve interaction. This has already been acknowledged by several projects aiming to Standardise Needs Assessment (Annex 3).
During emergency situations is difficult to set a base-line to quantify needs, damages, losses, resources available, etc. Response managers require pre-disaster knowledge of the affected area to evaluate the situation.
Once the initial decisions have been taken and the response is progressing, implementation should be monitored and results evaluated. Finally, response should develop into recovery, resources demobilised and organisations account for the funds expended. The information about disasters, causes, consequences and response should be made available to decision-makers (UNISDR 2005).
12 | P a g e
3.3. Disaster Prevention: Risk Reduction Strategies and Information Management
A theoretical approach to disaster prevention is to consider disasters (casualties and damages) the result of hazards on human vulnerability. However, it is also possible that vulnerable societies take risk to interact with hazards resulting in death and economic loss. The first approach may lead to technocratic measures to reduce exposure to inevitable disasters. The second approach places societies at the centre of the disaster. In combination with the human development theories this approach provides societies with the possibility of preventing disasters improving the community resilience through enlarged entitlements. UN Cluster approach and NIMS represent these different pre-disaster conceptions (with the exception of prediction and early warning which are a shared concern for both).
The analysis of disasters should be focused on prevention to know what happened and why hazards became disasters. Lessons learned have to be gathered, analysed and shared. This information should lead to proper development planning (WB 2010). DRR should be embedded in socio-economic development practices, especially in fields as: food-security, health, livelihood income diversification, safety-nets and education. Environmental factors and use of natural resources should be considered within a disaster prevention perspective. Development strategies and land-use planning should integrate interaction with hazards, considering actual and future climatological factors, to improve resilience. Critical infrastructures and environmental buffers have to be identified and protected.
13 | P a g e
3.3.1. Institutional Framework and Practical Application
UN is committed to disaster prevention (Annex 2). The 2005 world conference on disaster reduction was held in Hyogo (Japan) as a follow-up to 1994 Yokohama
Strategy. The conference established a Framework for Action 2005-2015 (HFA)
which may be considered a base for systematic approaches to reduce vulnerability and risk to hazards by improving community resilience (UNISDR 2005). The integration of DRR in development programs may be further reinforced if it is included in the post-2015 development goals. It would provide indicators for risk quantification agreed by the international community (Mitchell 2013).
DRR includes reducing hazard exposure, decreasing the vulnerability of people and property and improving coping capacities and preparedness for disaster. The
process starts assessing and monitoring disaster risk through risk and
vulnerability assessments, establishing early warning mechanisms, developing
technological and scientific capacities and databases (UNISDR 2005).
DRR requires a wide array of knowledge and capacities from different types of institutions and organisations including public, private sector, NGOs and civil society. The practical application of these principles should be carried out through
multi-sectorial national platforms for DRR. Coordination is basic to reduce
underlying risk factors, preparedness, and developing a culture of safety and resilience through education (UNISDR 2010).
Firstly, the platform should establish a baseline on how communities are affected by disasters to develop a risk assessment based in historical data and available information. The UNDP has developed the Global Risk Identification Programme
(GRIP14) to support national platforms in this task (UNISDR 2010).
Capacity assessment should follow to set a starting position for a capacity
development process. Previous disasters data should be analysed and the DRR progress measured. HFA provides indicators (inputs, outputs, results and impact) that allow monitoring the capacity development process. This community driven process should develop technical and functional capacities (UNISDR 2010).
14
14 | P a g e
3.3.2. Information Management
Risk and vulnerability are at the centre of the debate. Quantifying risk and vulnerability is less developed that hazard mapping and quantification (Birkmann 2007). Hazard assessment includes the likelihood of natural or human events to occur in a geographical area. Vulnerability assessment provides the information about the potential consequences to the population, economy, social structures and environment (UNISDR 2010) which would depend on the sensitivity and the coping and adaptive capacities. Social, economic and institutional actors, and their interactions, are the object of vulnerability and resilience analysis. Local context and priorities should be taken into account to forecast vulnerability (GO-Science 2012). They are complex and multidimensional concepts with temporal and spatial dimensions.
Risk implies the probability of hazard exposure and the consequences of that exposure. Thereby, risk assessments can be understood as the overlay analysis of hazard exposure and vulnerability assessments, linked with information related to coping and the resources available to minimise the risk.
The metrics to quantify risk can be obtained through different types of indicators based on impacts, outcomes, outputs or inputs. The choice determinates the information management; the possibilities of modelling, the type of analysis, the influence in the decision-making process and associated costs (Mitchell 2013). However, measuring outputs is an imperfect method that misses the pain and anxiety caused by disaster. Other indicators have to be used to estimate the live disruption caused by disasters (WB 2010).
15 | P a g e
Risk may be misperceived by the individuals (WB 2010). Information has to reach the different groups within the community in a timely and understandable manner to build a safety culture and assure a proper reaction to early-warning. In addition, local knowledge and understanding of risk are important sources of information. Communication tools are important to facilitate this process.
In summary, risk and vulnerability to multiple hazards is about integrating data from different sources in a particular context. Information management plays a relevant role in this process. Information should be analysed to find measures to reduce risk and to mitigate the vulnerability to prevent disaster. Results should be available to the community and the decision-makers. Public and private sectors should coordinate to develop appropriate capacity-building projects and take cost-effective preventive measures reducing underlying risk factors (UNEP 2002b).
The spatial dimension is represented by the scale of the study. There are several projects quantifying risk and vulnerability from global and local perspective (Annex 4). Both approaches have advantages and limitations. The question of down/up-scaling the study of vulnerability reflects a debate of universal versus grass-roots not only related to DRR but to development; a debate that should not be exclusive since both approaches have advantages and limitations.
Global approaches are based in the possibility of downscaling to support communities which lack the institutional structure to face DRR (Birkmann 2007). However, they may lack data for some locations, results simplistic in the choice of indicators, show a shortage of details and lose the community possession of the project which could have reduced their vulnerability.
16 | P a g e
3.4. Long-term Sustainable Development: Theory, Practice and Information Management
"The objective of development is to create an enabling environment for people to
enjoy long, healthy and creative lives15"
Haq and Sen’s work expands the concept of development (Sen 1981, 1984; Haq
2008). People’s capabilities become the centre of a process. The idea “what
people can do” replaces “what people have”. Human development becomes a process which has to be planned, monitored and evaluated. In this context, economic indicators are no longer the only measure for development.
For an important part of the humanity, basic rights and capabilities for subsistence are the immediate and essential. However, even if some economists consider that
environmental damage may suppose an economic benefit16, in the long-term
economic development cannot be opposed to ecological sustainability.
The concept of sustainable development strengths the need for a holistic approach to address the fact that development occurs within the context of a larger entity. Environment is central to human existence providing resources and protection. Development should not be a burden to the environment but to be contextualised within. The resources that the environment provides to enable human development should be known, understood and preserved. Development aiming for a better future should consider that human actions have an impact. Environmental impact assessments are a basic tool for development planning. Environmental indicators and baselines are needed to plan, monitor and evaluate.
Whether we consider that a healthy environment is needed to guarantee human wellbeing or that only an economically developed society can afford the measures to protect the environment, in the long-term there is a strong interaction between economic growth, human development and environmental preservation. Government and civil society have to work in coordination with businesses and ONGs to reach common targets. Consensual decisions have to be facilitated by the use of common information management tools.
15 MAHBUB UL HAQ
Human Development Report 1990 “Chapter 1: Defining and Measuring
Development” page 9 http://hdr.undp.org/en/reports/global/hdr1990/chapters/
16 This consideration is usually based in cost-benefit analysis which may not consider all factors
17 | P a g e
Globalisation means that environmental and development issues are no longer restricted by boundaries. Local human actions have global impact. Globalisation of environmental degradation takes the form of destruction of global commons, demographic expansion (with associated pollution and use of resources) and trans-boundary pollution. Many issues (desertification, climate change, resources
depletion, environmental degradation…) cannot be understood within a national
context (Blewitt 2008). There is also a need for global coordination of efforts.
Geography is a complex reality full of synergies between space, ecosystem, society, culture and economy. Development policies should be focused in long-term adaptive environmental strategies based on principles embedded in each community. These actions should be included in a global context by national and international institutions. Synergies between the different programs and projects should be explored and developed. A common language is needed. Common indicators and analysis tools should be at the heart of that new language as expression of the development paradigm.
Decentralisation, community and regional ownership of the decision-making process, in addition to communication, education and acquisition of local knowledge, have been considered necessary to empower the community and to achieve a participatory and inclusive approach to face the challenges of development creating awareness of threats and opportunities (Blewitt 2008). Information management tools should allow participation, with special attention to disfavoured groups and women, to choose development targets and indicators.
Invulnerable development is development designed to address vulnerabilities. It integrates a holistic approach to development and disaster management from inside the community through self-reliance and local capacity building (Weichselgartner 2001).
18 | P a g e
3.4.1. Practical Implementation of Development: Need for Indicators
Sustainable development can be founded in science and ecology but political decisions are the ultimate expression of this process. These policies are complex and comprise many stakeholders, crosscutting issues and uncertainties. They are difficult to plan by conventional methods.
Human and non-human interest can be considered through different tools usually based in indicators and associated baselines. The right questions should be placed in order to choose the right indicators which might be changed or adapted to unfolding situations. Base on those indicators, initial planning is accompanied by monitoring, learning and adaptation (Hummelbrunner 2013). They are also important to incorporate DRR strategies in the development programmes.
In this context the global versus local controversy, already mentioned, is significant. There are several global development indexes (Annex 5) used by international institutions to develop policies. The practical expression of these policies is programmes which are implemented through projects. Governments, international institutions, civil society and private sector are donors or receivers of the financial resources for the implementation.
Project Cycle Management (PCM) is a set of tools based on the Logical Frame Approach (LogFrame) which is the core to plan, monitor and evaluate development projects. In addition, PCMs presented by the on-field organisations are the base to fund the projects (EC 2004). In the LogFrame, the different goals, purposes and outputs are measure through indicators (process and impact indicators). The activities and inputs needed are determined from the analysis of this information. The progress is then evaluated against baselines.
19 | P a g e
4. Geographic Information Systems: a Tool to Manage Disaster and Development Information
Information management is a vital piece in the disaster and development cycle.
The amount of information, the type of analysis, the number and diversity of stakeholders, crosscutting issues and uncertainties require the use of computers to reach conclusions and facilitate the decision-making process.
One of the main relations is “geography”; disaster prevention and development
should be built from the community related to this geography. A logical conclusion is the use of GIS, in conjunction with other tools, to manage this information.
4.1. GIS concept
GIS used to be about putting maps into computers. Now, GIS are related to the management of geographic data to abstract the real world into two dimensions. Ultimately, GIS are a channel for communication (Gold 2006).
GIS are spatial information management tools. They are based on software which allows us to comprehend, question, understand and visualize data in different ways exposing relationships, patterns, and trends. Information takes the format of maps, globes, reports, and charts.
Representation and modelling are needed due to the limitation of our senses
versus the complexity of the world. GIS data-models are limited representations of
reality. The information is communicated via GIS atoms. Each one encloses
location, time and attribute. Location is the base of the system (defines the point by coordinates: x, y, c); allow us to map, to link based on the same place, to measure distances and areas. Time expresses the variation of the information. Attribute associates more information to the point.
The information, organised in layers, can be objects (discrete, countable) and
fields (variable) which are represented by different formats known as
data-structures (point, line, polygon, area...). It is related to what can be “computed”.
20 | P a g e
Geo-relational data-models give us the possibility of relating information or
attributes to a data-structure. Object-oriented data modelling include relationships
representing the objects natural rules in the real world. GIS behaviours are attribute rules and specific interaction rules between objects (e.g. lighthouse -
shoreline). In this context a customise data-model is a practical working template
(feature classes, associated attributes and relationships).
4.2. GIS capabilities
Nowadays, geospatial data are used everywhere; from the maps in our phones and car navigation to videogames. Why? What are GIS advantages?
Managing the location-based information through GIS would allow the user to: visualise, analyse, compare, relate and share data.
Data are often abstract and not easy to handle by our limited brain capacities. Visualising data is a method to deal with this limitation allowing quick communication, understanding and analysis of information. Visualisation cannot
replace analytical skill but infographics are easier to apprehend that statistics. “A
picture is worth a thousand words” is not just a proverb but the endorsement that complex information can be easier to transmit and absorb through the eyes.
Other GIS feature is to support spatial analysis. There are several categories and some may be applied in the context of this paper: Queries and reasoning as a result of the possibility of visualising the information; Transformations create new
data as result (i.e. overlay, interpolation, windows, density estimation…);
Descriptive summaries (i.e. spatial statistics); Optimization allow us to find the best solution for a given problem based on the considerations provided (i.e. ideal
locations, routes); Simulation allows “what if” analysis.
The function used could be: binary models (multiple maps for a yes/no solution), ranking models (range of solutions), rating model (average solutions) or weighted rating model (different importance is given to the different data). Each approach is used with different goals and produces different outputs with the same information.
21 | P a g e
not represent an accurate hazard mapping for earthquakes if geological information like unstable soils is not included) (Monmonier 1997). It is also
possible to “extend” the model by adding data layers; considering other
information. For example an analysis of landslide susceptibility could be performed by the rating analysis of 3 main data layers, 3 critical factors (terrain steepness, soil type and vegetation cover). This analysis could be extended by
adding more layers (i.e. extreme weather, historical, manmade disturbance…).
And also “road”, “building” or “proximity to” layers to study the associated hazard.
If one of the factors has more importance (i.e. vegetation cover) we could use a weighted rating model. The analysis could be extended to risk by weighting road
or building categories based on their traffic, economic value, population…
GIS technologies are commonly used to display and share data in a user-friendly and cost-efficient manner. Information is quickly updated and distributed to the different stakeholders to facilitate the decision-making process and to the public to allow transparency and participation.
GIS spatial analysis can also be made available online through web-mapping or web-GIS, including location-based services provided through mobile computing (i.e. mobile-phones, tablets). These systems allow any user to manage the information from any place. This option reduces the cost of real-time maps, dissemination, content personalisation and sharing of geographic information.
4.3. GIS Applied to Development and Disaster: Advantages and Limitations
Disaster management and development require a holistic and dynamic approach. The different actors and factors have to be studied considering space, time, interactions and feedback-loops which result in vulnerability. To manage the amount of information the use of technology is needed; GIS, remote sensing,
internet … (Weichselgartner 2001).
Hazard mapping is a basic tool to improve emergency preparedness and decision-making in DRR (Monmonier 1997).
The geographical integration of information allows visualising interactions and synergies between projects and projects and external factors (economic, social,
22 | P a g e
deductive and inductive reasoning. Also overlay analysis in which many layers of information are combined to identify areas of maximum or minimum impact.
The comparison of information over time shows evolution. It used to be made between static maps comparing snapshots of information. GIS can produce animations to allow easier understanding.
The timeframe to obtain and analyse the data during a crisis is important. IASC, for example, considers 4 phases: 72 hours, weeks 1-2, weeks 3-4, week 5 onwards (IASC 2012b). It is important how quick information management systems can process data. GIS can contain pre-crisis information from development projects. During an emergency, the information in GIS can be updated and shared in almost real time.
Data sharing through GIS can be a first step in a participatory approach. Communication tools that not only transmit information to the public but allow information to be managed (input, formatting, geoprocessing, creating maps and performing analyses) can lead to community engagement. Technology cannot replace social structures or face to face interaction but it can improve inclusivity and learning culture (Blewitt 2008). This approach could promote networking and data sharing through established standards.
Other advantage is the possibility of tapping into the knowledge of local and international community simultaneously. Several projects (i.e. Wikipedia,
InnoCentive17, OpenStreetMaps18) give an idea of the potential of crowd-sourcing
web-based tools. They are open-source platforms used to gather and share information from the community, public and private institutions and organisations.
Moreover, the integration of GIS with other computer tools may lead to solve complex problems which have socio-economic, environmental and political dimensions. This integration may be achieved through different techniques ranging from loose coupling to software interoperability.
However, there are also limitations. The debate previously exposed around global versus local becomes relevant. The level of detail determinates the size of the representation. This may especially affect the retrieval of information because of
17
http://www.innocentive.com/ 18
23 | P a g e
the size of the files to be downloaded through internet. It requires aggregating, generalizing and approximating to maintain the size within limits that can be handled. Greater detail cost time and money but not always guarantees better or more efficient results. Even if missing information could be as dangerous as introducing wrong data, the goal is to develop a tool with enough level of detail to be useful while cost-effective (Monmonier 1997).
GIS are only as good as the data contained in the system. Moreover, since there is always a distortion of a 3-D world represented in a 2-D abstraction, GIS are
only as good as the “display” of this data. The analysis techniques used to
process the information also affect the significance of the application of GIS. The advantages of using GIS are limited to the quality and quantity of the available information and to the way this information is analysed and displayed. Users have to be aware of these limitations and uncertainties. Errors and uncertainties should be described within the metadata.
In addition, security issues may limit the availability of information and the possibility of sharing it. Data sharing may also be limited due to software license and interoperability. This has become one of the most serious limitations in the actual implementation of GIS to development and disaster management.
4.4. GIS: Practical Application in Disaster Management and Development
Information cannot be solely managed using GIS. However, GIS represent an important tool to support the decision-making process.
4.4.1. Information Management Using GIS
GIS are being used for disaster management and development.
24 | P a g e
The Global Disaster Alert and Coordination System19 used by partners in the UN
cluster approach and the EU is an operating system providing worldwide real-time natural disasters alerts, including map catalogues and Virtual On-Site Operations Coordination Centre.
Early warning is often based on tracking and modelling of hazards to determinate
the areas of exposure (i.e. US National Hurricane Center20).
The European Emergency Response Centre (formerly Monitoring and Information
Centre21) is a 24/7 centre at the heart of the Community Mechanism for Civil
Protection which functions as focal point for communications, provides information
and early warning and coordinates response for 32 participating countries22. The
information is managed through the Common Emergency and Information System (CECIS) which is not properly a GIS but a web-based alert application developed to facilitate communication and information management during any type of
crisis23. Through this application the EU Member States can create alerts and
access to emergency response inventory and specialised emergency response teams for quick deployment (12 hours). In addition, the European Earth
Observation Programme (Copernicus)24 is an information management system
which includes several thematic GIS extensively used not only for emergency management but also in other areas.
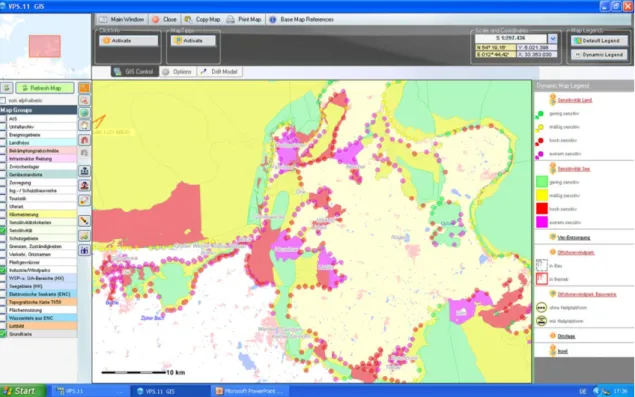
A system parallel to CECIS works for oil spill response (OSR). Indeed, many countries base their OSR strategies in GIS. Coast sensitivity mapping is implemented as a form of pre-crisis impact assessment and contingency planning which are used in conjunction with oil behaviour modelling to prioritise areas of intervention. In addition, resources location can also be planned, monitored and
shared through GIS25 (Annex 6).
19
http://www.gdacs.org
20
http://www.nhc.noaa.gov/gis/
21 The European Emergency Response Centre (ERC) was officially inaugurated on 15 May 2013. 22 EU 28, the former Yugoslav Republic of Macedonia, Iceland, Liechtenstein and Norway.
23 Marine pollution is managed through a parallel system recently established due to the need for
coordination with other countries outside of the EU context.
24 Six thematic areas: land, marine, atmosphere, climate change, emergency management and
security http://copernicus.eu/ 25 i.e. German oil spill response
25 | P a g e
Resources management has a geographical component. US-FEMA dedicated
department26 uses GIS to optimise mobilisation and demobilisation while
facilitating communication and accountability (USDHS 2008).
The World Food Program has a Vulnerability Analysis and Mapping27 service with
on-line Spatial Data Infrastructure containing online mapping services and metadata. Also the Food and Agricultural Organization (FAO) has developed the
public domain software WinDisp28 as a form of GIS applied to early warning for
food security (FAO Global Information and Early Warning System) and the Vulnerability Information and Mapping Systems.
As early as 1999 UNEP-GRID Sioux Falls29 developed an interactive map of
Central America displaying vulnerability to different natural hazards.
WorldRiskIndex30 includes risk and coping capacities. It has been developed by
the UN University and considers exposure to hazard, susceptibility, coping and adaptive capacities through 28 indicators. The lack of coping capacities and adaptive capacities combine in a vulnerability index. The indicators are freely available in the internet and are analysed by a GIS. The WorldRiskReport was first published in 2011 (ADW 2012).
The European Soil Data Centre31 has several initiatives in conjunction with the
Join Research Centre to map soils to allow sustainable development of the agricultural sector. These projects, initiated in Europe, have been extended to Africa and Latin America.
These are just some examples of the widespread use of GIS especially in disaster management but also for development. There are many other projects which could be mentioned but is out of the scope of this paper to list them all.
4.4.2. Sources of Information
The learning process requires assessment of needs, vulnerability, capacity, coping and resilience to facilitate planning and implementation. Planning and implementation are improved by monitoring, evaluation, impact assessment and
26
http://gis.fema.gov/MissionsAndFunctions.html 27
http://vam.wfp.org/ 28
www.fao.org/giews/english/windisp/windisp.htm 29
http://grid.cr.usgs.gov 30
www.worldriskreport.com 31
26 | P a g e
adaptive review. Community capacity building, transparency and accountability are the results. The practical application of GIS to disaster and development can be implemented using the geographically related indicators from the information management tools identified.
Throughout a crisis the information can be disaster related, baseline data, utility and infrastructure data, and terrain and natural resources data (JBGIS 2010). During the initial response one of the first challenges for UNOCHA is the collection and integration of primary source information. The MIRA is based on
the Community Level Assessment (CLA). It should also include pre-crisis
information, which could serve as baseline for assessing the impact of the disaster, and in-crisis secondary information (IASC 2012). IASC guidelines to
conduct the MIRA32 provide a description of the information (sources,
characteristics and analysis performed).
To cope with the profuse number of sources of information, IASC contemplates a standardised vision of needs assessment and their analysis. This consideration is
reflected in a needs assessment “mapping” exercise (UNOCHA 2009) and a “preliminary” list of humanitarian indicators33. In addition, the Common
Operational Datasets34 (supplemented by the Fundamental Operational Datasets)
facilitate information sharing between the different clusters. This descriptive list of assessment (Annex 3) and indicators are valuable to identify sources of information and information management needs.
On the other hand, NIMS bases the response in situation assessments. Information management needs are addressed through ICS Forms.
Risk management includes risk, response and vulnerability assessments, previous disasters data, capacity assessment, hazard mapping, early warning mechanisms and vulnerability, resources and coping capabilities and resilience analysis. HFA can provide information for this process. Also, UNDP GRIP and
UNISDR “Local HFA: Local Government Self-Assessment Tool” provide indicators
to monitor the capacity development process. The integration of DRR in the
32 IASC 2012.
33 The IASC has been developing a list of key humanitarian indicators identified by global clusters
www.humanitarianinfo.org/iasc/downloaddoc.aspx?docid=4927&type=pdf (Retrieved on 4 March
2013).
34
27 | P a g e
2015 development goals could also provide indicators for risk quantification. In
addition, the Disaster Risk Assessment Portal35 (by UN-HABITAT) is a disaster
risk assessment website for tools exchange and case studies.
Other initiatives like Charter Space and Major Disasters36, Sentinel Asia37 or
GMES Emergency Response Service38 provide geo-data during disasters.
Development information is related to planning, monitoring and evaluating. Indicators and associated baselines are available in LogFrame matrixes and environmental impact assessments.
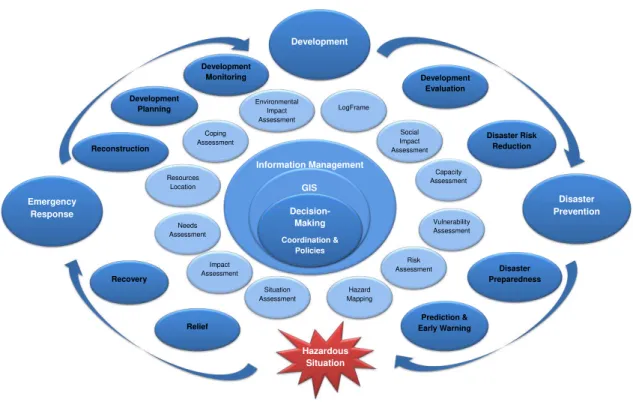
The information geographically related obtained from these sources can be included in GIS; different projects, indicators, resources (social, environmental, disaster response and others). It could be classified in layers, analysed and shared between the different stakeholders to support, in combination with other tools, the decision-making process. The graphic below was created to illustrate this process.
Figure 4 - Learning cycle with GIS support (graphic by author).
28 | P a g e
4.4.3. GIS Software Options and Associated Cost
There are multiple GIS packages from different software providers. The main issues are interoperability and licensing. Commercial GIS are licensed which increases costs and interoperability issues but provide stable software and the
possibility of tailor-made solutions. There are many “free” GIS options39 easy to
install and often fast and efficient.
Open-source does not mean free but software which source code is available to the community. The dilemma of proprietary versus open-source software has numerous legal and copyright issues out of the scope of this research but especially interesting within the context of development. Other benefits of open-source are related to sharing and crowdsourcing since it supports wider variety of platforms and formats. On the downside, it often needs lots of customized programming, it is hard to link to server tools and it has a limited ability to integrate into proprietary systems.
Other important choice is the use of desktop versus web applications. Desktop applications are reliable and can be used independently of the conditions (internet connection). Web applications allow further interaction and crowdsourcing in line
with a participatory approach. A “hybrid” option could be possible since there is
software that can bridge between both.
The cost associated to the implementation and maintenance of a GIS depends on the software and the methods to populate the system. Usually, governments
subcontract these services. Jens Rauterberg40, responsible for the implementation
of German OSR GIS41, gives a very positive assessment of GIS capabilities.
However, he also points out the cost (€1.8m) for the initial implementation of the
system (pilot phase & 1st version 1998) which had more than 18 subcontractors
studying the coastline. Thereafter, the annual cost of developing the system,
training the users and updating the information (€190,000-€240,000).
It is important to consider the interoperability between databases, software and formats. One of the main problems is the lack of universal standards. There are
39
www.freegis.organdhttp://opensourcegis.org/ 40 Interviewed on 5 July 2013.
41 Contingency Planning System and Sensitivity Mapping for German coastal states and the
29 | P a g e
no standards on environmental parameters to define hazards, nor for archiving data or on development related indicators. The analysis and exchange of the
information becomes challenging. The Open GIS Consortium42 has established
some standards for spatial features to improve GIS interoperability. The UN
Geographical Information Working Group43 is also working in this direction. At an
EU level, the EC INSPIRE44 directive aims to standardise geoinformation for
environmental purposes. However, this is still one of the main barriers to explore the synergies between different GIS. The use of open-source software could facilitate and made cost-effective this task (WB 2010).
Information management during the response to Haiti 2010 earthquake was somehow different from previous crisis and is a relevant example. Volunteer and
technical communities (V&TCs) like OpenStreetMap45, Ushahidi46, Sahana47 and
CrisisMappers48 played a decisive role which challenged the traditional
humanitarian structures. These platforms aggregated, analysed and integrated
information coming from the community (i.e. SMS, social media… ) with satellite
imagery (provided by GeoEye49/Google and Digital Globe50) to provide reliable
mapping and updated on-the-ground information. Many V&TCs work with open-source software allowing others to exchange data and collaborate (HHI 2011).
One of the problems was to collaborate with established information management structures within the cluster approach. The tools used by the different clusters were not ready to deal with the inflow of information coming from the V&TCs. Moreover, most of the clusters rely on proprietary software that does not even facilitate the interaction and information sharing between them (HHI 2011).
Following that experience, projects like Humanitarian OpenstreetMap Team51,
MapAction52 or ACAPS53 are starting to work not only in disaster response but in
30 | P a g e
4.5. GIS Hypothetical Implementation
In order to evaluate the potential of this theory, a simplified version of a GIS is developed following the bases exposed. The implementation contained real and fictional information aiming to achieve a realistic simulation (Annex 7).
The software used are: ArcGIS10 by ESRI54, which is a commercial desktop GIS
tool and Quantum GIS55 desktop version 1.8.0 official project of the Open Source
Geospatial Foundation licensed under the GNU General Public License. Further research is needed for the implementation of web-based applications.
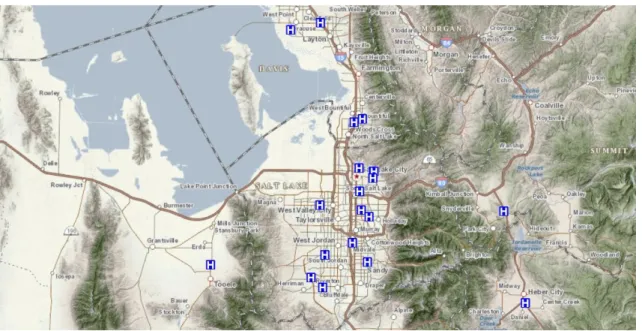
Considering a limited geographical area around Salt Lake City56 and focused on
healthcare, the goal is to use geographically related indicators significant during the disaster-development learning cycle obtained from sources previously identified.
Information normally managed to monitor development is used as baseline and resources location during a disaster. The condition of resources during an emergency is easily updated to adequate disaster relief and recovery. Those indicators together with the consequences of pass crises and simulation of future ones are used to prevent disasters and to embed DRR in development planning.
LogFrame, MIRA Report57, World Health Organization (WHO) Health Resources
Availability Mapping System (HeRams)58 (based in the Sphere standards59) are
taken as a reference for metadata (time, data collector and data source) and indicators.
The indicators considered are: Health infrastructures: Hospitals (secondary and tertiary care), health centres (primary care), health units (community care) and mobile clinics (emergency medical services); Number of health workers: doctors, nurses and midwifes; Population; Transportation: airports.
The first issue is the base map, topographic and/or imagery (satellite or orthophotography). The use of imagery was initially considered but to avoid the
excessive “weight” of the files a raster terrain map is used instead. The different 53
http://www.acaps.org/ 54
www.esri.com 55
www.qgis.org/
56 Area defined by to the availability of free GIS information (
http://gis.utah.gov/) 57
http://assessments.humanitarianresponse.info/mira-reports 58
www.who.int/hac/global_health_cluster/guide/tools/en/ 59