BAR, Rio de Janeiro, v. 15, n. 2, art. 3, e170120, 2018
http://dx.doi.org/10.1590/1807-7692bar2018170120
Financial Reporting Quality, Debt Maturity, and Chief Executive
Officer Career Concerns on Investment Efficiency
Darlin Aulia1 Sylvia Veronica Siregar1 Universitas Indonesia, Faculty of Economics and Business, Depok Indonesia1
Received 12 October 2017; received in revised form 2 February 2018; accepted 2 February 2018; first published online 22 May 2018.
Abstract
The purpose of this research is to investigate the effect of financial reporting quality, debt maturity, and CEO career concerns on investment efficiency in Indonesia. This study used a sample of 680 observations from non-financial companies in Indonesia during the period from 2012 to 2015 using panel regression. The results show that financial reporting quality does not affect investment efficiency. This might be because the quality of financial reporting has no effect in the overinvestment scenario. Under this condition, financial reporting quality cannot mitigate the occurrence of overinvestment due to the high level of agency problems. However, financial reporting quality has a significantly positive effect under condition of underinvestment, which means that financial reporting quality can reduce the occurrence of underinvestment because it can be used to attract external funds so that companies can avoid underinvestment conditions. The debt maturity has a negative effect on investment efficiency. In particular, debt maturity has no effect on underinvestment, but it does have an effect on overinvestment, because by using short-term debt, the company has funds that can be used to make investments to enable overinvestment. CEO career concerns have no effect in underinvestment conditions because companies do not experience funding constraints, so the CEO career concerns do not mitigate underinvestment. Whereas in conditions of overinvestment, career concerns have a positive effect. Thus, CEO career concerns can reduce the occurrence of overinvestment.
BAR, Rio de Janeiro, v. 15, n. 2, art. 3, e170120, 2018 www.anpad.org.br/bar
Introduction
Various countries have policies to increase investment from domestic and foreign capital. This is done by governments because the investment activity will also encourage the country’s economic activities, increase its output, and achieve savings of foreign exchange or even increase incoming foreign investment. In general, investment can be interpreted as a decision to spend current funds to buy real assets or financial assets with the purpose of obtaining income (Haming & Basalamah, 2010). Therefore, it is expected that companies can utilize their resources to achieve investment efficiency or avoid investment inefficiency conditions. Therefore, it is important to examine factors affecting this investment efficiency.
One of the factors affecting investment efficiency is financial reporting quality. The relationship between financial reporting quality and investment efficiency is related to the reduction of information asymmetry between firms and external capital providers. For example, higher financial reporting quality would allow firms with capital needs to attract additional capital by displaying projects that have a positive NPV to investors and mitigate adverse selection issues in securities issuance (this will mitigate underinvestment). Higher financial reporting quality can limit managerial incentives to engage in activities that degrade corporate value, such as empire-building in companies with excess capital (in other words, limiting overinvestment). This can be achieved if better financial reporting quality enables better contracting to prevent inefficient investment and enhance investors’ ability to monitor management's investment decisions (Biddle, Hilary, & Verdi, 2009).
One way to mitigate the presence of information asymmetry is to improve financial reporting quality (Bushman & Smith, 2001; Healy & Palepu, 2001). McNichols and Stubben (2008) also argue that asymmetry of information can be minimized by improving the quality of financial reporting, because this will also increase outsiders’ ability to monitor management. Therefore, if associated with investment efficiency, with high financial reporting quality then the problem of underinvestment (rejecting positive net present value/NPV projects) and overinvestment (carrying out negative NPV projects) will be reduced.
In addition to financial reporting quality, several other factors also affect investment efficiency. One of them is debt maturity. As mentioned by Gomariz and Ballesta (2014), the management of corporate funds is also a concern in improving investment efficiency, because managing the activities of operational and non-operational companies requires funds. Funding sources can include obtaining loans from certain parties. Every loan has its own maturity. Gomariz and Ballesta (2014) found that the use of short-term debt can mitigate investment inefficiency. Shorter maturities on debt can be used to mitigate information asymmetry problems because, from the borrower’s perspective, firms are able to signal the lenders that they are good firms and thus able to obtain better loan terms in subsequent loan renewal; and from the perspective of the lender, shorter maturities will enable them to have more control and increase monitoring of management. The role of debt is relevant in the context of Indonesia: based on data on the Indonesia Stock Exchange, Indonesia has a relatively low number of debt issuers when compared with other ASEAN countries. Thus, it can be deduced that private debt is still a major financial source for many companies, in addition to issuing shares.
Non-financial factors should also be considered when discussing organizations’ investment efficiency. Such factors include the role of parties that exist within a company or organization. There are various stakeholders in the organization, which all have goals and interests to be achieved. This study also considers the role of the CEO, which is responsible for determining strategic policy, mainly related to companies’ investment policies, in accordance with the duties and responsibilities contained in Law No. 40 year 2007 Limited Liability Companies Act (Law n. 40, 2007).
age and CEO appointment. According to Xie (2015), CEO age and appointment have an influence on a company’s investment decisions. Young and newly appointed senior CEOs are considered to be more efficient in investing because they are more willing to take risks to enter new business lines, thus avoiding underinvestment and cautious attitudes towards investment, as they want to build a good reputation that will mitigate the condition of overinvestment. On the other hand, older and long-standing CEO tend to keep the status quo, and their investment decisions are thus inefficient (Xie, 2015).
Based on the above explanations, the purpose of this research is to analyse the effect of financial reporting quality, debt maturity, and CEO career concerns on investment efficiency. Previous studies tend to focused more on analysing financial factors, whereas this research combines both financial and non-financial factors that can affect investment efficiency. This study extended previous studies by examining financial reporting quality and debt maturity as examined in Gomariz and Ballesta (2014) and CEO career concerns in Xie (2015).
Literature Review
Financial reporting quality and investment efficiency
There are several ways to overcome the problem of information asymmetry. One of them is by improving the quality of financial reporting. High quality financial reporting can improve the monitoring of management to prevent opportunistic actions. The role of high quality financial reporting in mitigating information asymmetry is mainly related to investment decisions.
Investment efficiency can be improved by improving the quality of financial reporting (see, for example, Biddle & Hilary, 2006; Bushman & Smith, 2001; Healy & Palepu, 2001; Lambert, Leuz, & Verrecchia, 2007). The relationship between financial reporting quality and investment efficiency is related to the reduction of information asymmetry between firms and external capital providers. Higher financial reporting quality makes managers more accountable by allowing better monitoring, and can mitigate information asymmetry so that adverse selection and moral hazard can be avoided. On the other hand, higher quality financial reporting can also improve investment efficiency by enabling managers to better make investment decisions through better identification of projects for internal decision makers (Bushman & Smith, 2001; McNichols & Stubben, 2008). If external parties suspect that the quality of information in financial reporting is low, then they will tend not to invest in the company, which will limit the company’s ability to exploit positive NPV projects, and will cause underinvestment conditions. Lower financial reporting quality, which means higher information asymmetry will mitigate outsider ability to monitor management, will increase moral hazard. This would include management that makes investment decisions for the purpose of empire building, such as undertaking negative NPS projects (hence overinvestment).
Biddle and Hilary (2006), Biddle, Hilary and Verdi (2009), and Gomariz and Ballesta (2014) find that high financial reporting quality can mitigate the problem of overinvestment and underinvestment. Based on the previous explanation, we propose the following hypothesis:
H1: Financial reporting quality is positively associated with investment efficiency.
H1a: Higher financial reporting quality can mitigate overinvestment.
H1b: Higher financial reporting quality can mitigate underinvestment.
Debt maturity and investment efficiency
BAR, Rio de Janeiro, v. 15, n. 2, art. 3, e170120, 2018 www.anpad.org.br/bar
the company can signal that it is a good company, and thus potentially allow it to obtain better price conditions at the next loan renewal. Meanwhile, from the lender perspective, the shorter maturity allows better control and monitoring of managers (Diamond, 1991, 1993). Theoretical models (Childs, Mauer, & Ott, 2005; Myers, 1977) predict that the greater flexibility of shorter debt maturity is useful in improving investment inefficiency, although there is limited evidence for this, particularly in relation to overinvestment. The role of a manager's discretion in reducing debt and making disciplined investment decisions has been discussed in the literature (Jensen, 1986; Myers, 1977), and there is some evidence that debt mitigates overinvestment (D’Mello & Miranda, 2010). However, the literature has also emphasized the role played by debt maturity under conditions of asymmetric information, which indicates that the use of short-term debt is the mechanism that could mitigate the asymmetric information and agency costs between shareholders, creditors, and management.
From the point of view of creditors, Flannery (1986) suggests that under conditions of asymmetric information with a good project, a shorter maturity is preferable to send signals to the market and mitigate the problem of asymmetric information. From the lenders’ perspective, with asymmetric information, the use of short-term debt is more suitable than long-term debt to monitor the company (Diamond, 1991, 1993; Rajan, 1992). A shorter maturity of debt allows better control of the manager, because the shorter maturity leads to more frequent renegotiation. Lenders thus have close contact with borrowers and can ensure the company’s performance during the first period, and then they can decide whether to update or change the terms of the contract at the subsequent renewal (Ortiz-Molina & Penas, 2008).
Therefore, the use of short-term debt is expected to mitigate the information asymmetry problem. Gomariz and Ballesta (2014) predicted and found that the conditions of overinvestment and underinvestment can be avoided by increasing the use of shorter debt maturity. They assume that short-term maturity allows firms to raise funds to finance their investments, thus reducing the problem of underinvestment, and short-term debt will mitigate overinvestment due to the company’s obligation to repay loan funds. This is also in line with Amrullah’s (2015) findings in Indonesia. Thus, the following hypotheses is proposed:
H2: The use of short-term debt is positively associated with investment efficiency.
H2a: Higher use of short-term debt can mitigate overinvestment.
H2b: Higher use of short-term debt can mitigate underinvestment.
CEO career concerns and investment efficiency
Li, Low and Makhija (2011) state that CEO career concerns have an effect on investment decisions, with the assumption that younger CEOs are driven by the desire to build a good reputation and want to change the base assets of a company by way of entering new business segments. Career concerns of young or newly appointed CEOs tend to focus more on benefits, and they invest more efficiently. In particular, young CEOs are more sensitive to new information and make more aggressive investment decisions.In contrast, older and more experienced CEOs tend to invest less efficiently due to fears of diversification of human capital rather than concerns for their own careers. However, the work experience of older CEOs serves to limit errors in investment decisions. Therefore, the relationship between the CEO career concern of the director and investment efficiency is still unclear. The alleged short-term career focus hypothesis predicts that the CEO career concern will be to enhance his or her reputation by taking suboptimal projects that are not in the interest of investors. The long-term hypothesis predicts that CEOs’ career concerns will be focused on their long term reputation and they will take advantage of incentives to improve the efficiency of the company’s investment in order to build a good reputation for the future. In this study, we argue that CEO should have more long-term consideration in making investment decisions, as they want to keep their job as long as possible. Thus, we propose following hypothesis:
H3a: CEO career concerns mitigate overinvestment.
H3b: CEO career concerns mitigate underinvestment.
Research Method
This study used secondary data from the Annual Reports of companies listed on the Indonesian Stock Exchange, as well as data available on Eikon and Thomson Reuters Datastream. The population in this study is non-financial companies listed on the Indonesian Stock Exchange between 2012 and 2015. The determination of 2012 as the start date for this study relates to the revision of OJK regulation number X.K.6 on Submission of Annual Report of Issuers and Public Companies (Regulation number X.K.6, 2012). This regulation includes several improvements, one of which emphases more detailed information disclosure related to directors, including CEOs. One aspect of the information in the annual report is related to CEO age and appointment, which will be used to measure CEO career concerns.
We employed several sample selection criteria. There were 406 non-financial companies listed in the year 2015. From those companies, 106 were first listed after the year 2012, hence there are 300 companies that were consistently listed during 2012-2015. There were several companies that do not have complete data available to compute variables, 130 companies in all, which resulted in a final sample of 170 companies. Thus, we have 680 observations during 2012-2015.
To test the hypotheses, this study used a research model which refers to Gomariz and Ballesta (2014) and Xie (2015):
InvEffi,t = β0 + β1FRQi,t + β2STDebti,t + β3CareerConcernsi,t + β4Tangi,t + β5TobinsQi,t + β6CFOi,t+ β7Levi,t+ β8 Sizei,t+ β9LnAgei,t+ β10Lossi,t+ ei,t
(1)
Where:
InvEff: Investment Efficiency
FRQ: Financial reporting quality measured by an aggregate of Kasznik (1999), Dechow and Dichev (2002), and McNichols and Stubben (2008) models.
STDebt: ratio of short term debt to total debt
CareerConcerns:CEO career concerns, the sum of two dummy variables which are age (1 if the age of the president director is more than 50 years old and 0 if otherwise) and appointment (1 if a new appointment during the observation year and 0 otherwise)
Tang: Ratio of property, plant, and equipment to total assets
TobinsQ: Tobin’s Q
CFO: Cash flow from operations to total assets
Lev: Debt to total assets
Size: Natural logarithm of total revenue
LnAge: Age of the firm
Loss: Dummyfirmloss, 1 if the firm reported losses and 0 if otherwise
BAR, Rio de Janeiro, v. 15, n. 2, art. 3, e170120, 2018 www.anpad.org.br/bar
Investi,t= β0+ β1NEGi,t-1+ β2%RevGrowthi,t-1+β3NEG*%RevGrowthi,t-1+ei,t (2)
Investment represents the total investment of firm i in year t which is defined by the amount of investment in property, plant, and equipment, and research and development minus sales of property, plant, and equipment, and is scaled by lagged total asset i in year t. % RevGrowth is the annual revenue growth rate. The NEG is indicator variable, where 1 for negative revenue growth and 0 otherwise. The model is estimated cross sectionally, by regressing the model each year and each industry. The residual value of this equation reflects the departure from the expected level of investment (or investment inefficiency). A positive residual means overinvestment and a negative residual value means underinvestment conditions. The absolute value of these residuals is then multiplied by -1, so a higher value will indicate a higher investment efficiency.
Based on Gomariz and Ballesta (2014), financial reporting quality (FRQ) is measured using three measurement models developed by McNichols and Stubben (2008), Kasznik (1999), and Dechow and Dichev (2002). The respective measurement models are explained as follows:
McNichols and Stubben’s (2008):
ΔARi,t= β0+ β1Salesi,t+ ei,t (3)
ARi,t is the annual change in the firm’s receivables, whereas sales represent the annual change of
the firm’s sales. All variables are scaled by lagged total assets. The absolute residual value from this model, and is then multiplied by -1, so a higher value shows higher FRQ.
Kasznik’s (1999):
TAi,t=β0+ β1ΔSalesi,t+β2PPEi,t+ β3ΔCFOi,t+ei,t (4)
TA is total accruals, calculated as the change in non-liquid current assets minus the change in current liabilities plus the change in the short-term bank debt, minus depreciation. Δsales is the change
in revenues; PPEi,t is property, plant, and equipment; ΔCFOi,t is the change in cash flow from operations.
All variables are deflated by lagged total asset. Same as the first model, the absolute value of residual
values from the model is then multiplied by -1, so a higher value means a higher FRQ.
Dechow and Dichev’s (2002) Measurement Model:
WCAi,t = β0+ β1CFOi,t-1+β2CFOi,t+ β3CFOi,t+1+ei,t (5)
WCAi,t is working capital accruals, calculated as the change in liquid current assets, minus the
change in current liabilities plus the change in short-term debt. CFOi,t-1, CFOi,t, andCFOi,t+1 are the last
year, current, and next year cash flow from operations. All variables are deflated by total asset. Consistent with the first and second models above, the absolute values of residuals from the model are then multiplied by -1, so that a higher value means higher FRQ.
The second independent variable is short-term maturity. Following Gomariz and Ballesta (2014), STDebt is the ratio of short-term debt to the total debt. A higher ratio value means that the company has a greater short-term debt maturity and vice versa. If the company has a lower ratio value, then it has less short-term debt or more long-term debt.
The career concerns variable in this study are based on age and appointment of CEO. The measurement of this variable is the sum of two dummy variables. The first age dummy variable is 1 if the director is more than 50 years old and 0 otherwise. A second appointment dummy variable is of 1 if CEO is newly appointed in that year and 0 otherwise. The two dummy variables are then summed. This is in accordance with the research conducted by Xie (2015).
(CFO) to measure cash flow on operations, Leverage (Lev) to measure the total debt of the company, (Size) to control company size, LnAge to measure company age, and Loss to measure the position of financial reporting quality, with a dummy variable of 1 for company profit and 0 for company losses.
Results
Analysis: descriptive statistics
As shown in Table 1, below, InvEff has an average value of -0.0417 with a standard deviation of 0.039. This illustrates that the level of investment inefficiency in companies in Indonesia is still low, at -0.0417, while the spread of data on the investment efficiency of the sample companies is 0.39. Regarding investment inefficiency, there are two scenarios: underinvestment and overinvestment. The data indicate that most of the sample companies have an overinvestment problem: 415 observations, representing 61.02% of the total sample. Meanwhile, 265 observations, representing 38.9% of the sample, demonstrate underinvestment.
Table 1
Descriptive Statistics
N Mean Median Std.Dev Max. Min
Inveff Overinvestment Underinvestment Aggreg STDebt CC LnAge Loss CFO Lev Size Tang TobinQ 680 415 265 680 680 680 680 680 680 680 680 680 680 -0.041776 -0.034377 -0.053563 -0,11941 0.628669 1.101471 3.547269 0.225000 0.070706 0.553928 28.23457 0.482285 0.296728 -0.034832 -0.035161 -0.0324463 -0,08120 0.634482 1 3.583519 0 0.052441 0.534425 28.29361 0.473592 0.104352 0.039692 0.017138 0.058076 0,11911 0.229209 0.316457 0.391318 0.417890 0.112309 0.367800 1.821647 0.206998 6.111614 -0.000009 -0.000159 -0.0000096 -0,000214 0.999644 2 4.644391 1 0.662711 6.188641 32.93781 0.980295 3.617156 -0.380712 -0.069472 -0.380712 -0,64059 0.014004 0 2.302585 0 -0.330678 0.011298 23.35688 0.026944 -1.203435
Note. *, **, *** The significance level at 10%, 5%, and 1%. InEff = Investment Efficiency, Overinvestment = Over Investment, Underinvestment = Under Investment FRQ_Nic = discretionary revenue, FRQ_Kaz = discretionary accruals, FRQ_DD = accrual quality, Aggreg = Aggregate FRQ_Nic, FRQ_Kaz, and FRQ_DD, STDebt = total short-term debt / total debt, CC = the sum of dummy variable (1 if more than 50 years and 0 otherwise, as well as 1 if newly appointed and 0 otherwise), LnAge = Company age, Loss = dummy variable (1 if loss and 0 otherwise), CFO = cash flow / total assets, Lev = total debt / total assets, Size = Logarithm natural sales , Tang = total tangible asset, TobinQ = ratio between market value of equity and debt to total assets.
Pearson correlation matrix
BAR, Rio de Janeiro, v. 15, n. 2, art. 3, e170120, 2018 www.anpad.org.br/bar
Pearson Correlation Matrix
InvEff FRQ_Nic FRQ_Kaz FRQ_DD Aggregat STDebt CC Age Loss CFO Lev Size Tang TobinQ
InvEff 1.000000
FRQ 0.056050* -0.044099* 0.014269* 0.321421 1.000000
STDebt 0.034015** -0.118342* -0.148333 -0.142358 -0.117098 1.000000
CC 0.007392*** 0.061861* 0.031668* -0.011755* 0.007371* -0.019695* 1.000000
Age 0.047511** 0.047326** -0.011950* 0.036441* 0.022758* 0.057725* -0.009291* 1.000000
Loss -0.095630* 0.024048** -0.059999* -0.047447* -0.002022* -0.146436* 0.049836** -0.117272* 1.000000
CFO -0.060720* 0.043461** 0.024853* 0.047939* -0.048102* 0.074244* 0.011648* 0.165071 -0.210506 1.000000
Lev -0.073305* 0.007380*** -0.100006 -0.163397 -0.055184* -0.165114* 0.009646* -0.053053* 0.298491 -0.141413* 1.000000
Size 0.077089* 0.149343 0.037116* 0.038486* -0.010701* -0.029110* 0.132340 0.274478 -0.184543 0.243286 0.017627* 1.000000
Tang -0.200805* 0.237664 0.030116* 0.086397* 0.002713* -0.470136 0.037876** -0.053324* 0.296194 -0.066368* 0.131630 -0.042014* 1.000000
TobinQ -0.003013* 0.023245*** -0.003571* 0.018603* -0.018439* 0.093512* 0.018254* 0.116574 0.018155* 0.362767 -0.041561* 0.028183* 0.038054** 1.000000
Regression result - investment inefficiency
The regression results are presented in Table 3 for all samples, Table 4 for Overinvestment scenario, and Table 5 for Underinvestment scenario. The summary results of all main independent variables are presented in Table 6. FRQ is proxied by an aggregate of three models developed by McNichols and Stubben (2008), Kasznik (1999) and Dechow and Dichev (2002). The results showed that for all samples the financial reporting quality do not have significant effect on investment efficiency. This result does not support the hypothesis, which states that the financial reporting quality has a positive effect on investment efficiency. Thus, hypothesis 1 (H1) is not supported.
Table 3
Regression Result - Investment Efficiency
Variable Prediction
InvEff
Coefficient Prob
FRQ STDebt
CC Age Loss CFO Lev Size Tang TobinQ
C
+ + + + - - - + - +
0.007968 -0.012368
0.000671 0.003288 -0.001000 -0.041370 -0.005963 0.001853 -0.048047
0.000533 -0.069245
0.15195
0.0856*
0.4385 0.27495 0.40635
0.0048***
0.10935
0.0633* 0.000***
0.42555 0.0565
R-square F-statistic Prob>F
Obs
0.050757 3.577243 0.000122
680
BAR, Rio de Janeiro, v. 15, n. 2, art. 3, e170120, 2018 www.anpad.org.br/bar
Regression Result – Overinvestment
Variable Prediction InvEff
Coefficient p
FRQ STDebt CC Age Loss CFO Lev Size Tang TobinQ C + + + - - + - + + + 0.010999 -0.000003 0.003176 0.000464 -0.004656 0.023180 -0.000704 0.003025 0.009968 0.000431 -0.127840 0.1118 0.49655 0.08945* 0.4197 0.0131** 0.0035*** 0.3607 0.000*** 0.0187** 0.04535** 0.0000 R-square F-statistic Prob>F Obs 0.160716 7.736277 0.000000 415
Note. *, **, *** The significance level at 10%, 5%, and 1%. InvEff = Investment Efficiency, FRQ = Financial Reporting Quality (the aggregate of FRQ_Nic (discretionary revenue), FRQ_Kaz (discretionary accruals), and FRQ_DD (accruals quality)), STDebt = total short-term debt / total debt, CC = the sum of dummy variable (1 if more than 50 years and 0 otherwise, as well as 1 if newly appointed and 0 otherwise), Age = Company age, Loss = dummy variable (1 if loss and 0 otherwise), CFO = cash flow / total assets, Lev = total debt / total assets, Size = Logarithm natural sales, Tang = total tangible asset, TobinQ = ratio between market value of equity and debt to total assets.
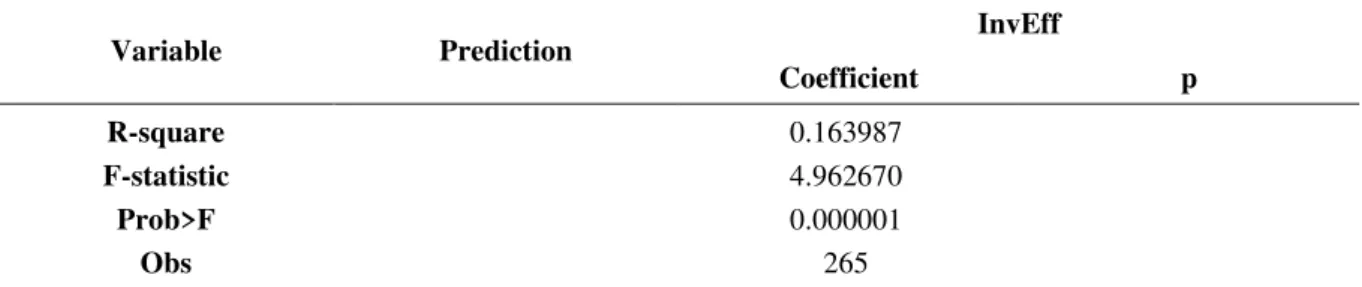
Table 5
Regression Result – Underinvestment
Variable Prediction
InvEff
Coefficient p
Variable Prediction
InvEff
Coefficient p
R-square F-statistic Prob>F
Obs
0.163987 4.962670 0.000001
265
Note. *, **, *** The significance level at 10%, 5%, and 1%. InvEff = Investment Efficiency, FRQ = Financial Reporting Quality (the aggregate of FRQ_Nic (discretionary revenue), FRQ_Kaz (discretionary accruals), and FRQ_DD (accruals quality)), STDebt = total short-term debt / total debt, CC = the sum of dummy variable (1 if more than 50 years and 0 otherwise, as well as 1 if newly appointed and 0 otherwise), Age = Company age, Loss = dummy variable (1 if loss and 0 otherwise), CFO = cash flow / total assets, Lev = total debt / total assets, Size = Logarithm natural sales, Tang = total tangible asset, TobinQ = ratio between market value of equity and debt to total assets.
Following Gomariz and Ballesta (2014) and Xie (2015), observations are then divided into two groups, which are overinvestment and underinvestment. The insignificant result for the overinvestment sub-sample (Table 4) is contrary to the results of Biddle et al. (2009) and Gomariz and Ballesta (2014), which find that high financial reporting quality affects investment efficiency levels under both underinvestment and overinvestment conditions. On the other hand, the financial reporting quality has a significant positive effect on underinvestment (Table 5), so hypothesis 1b is supported. This finding is in line with Biddle et al. (2009) and Gomariz and Ballesta (2014).
The insignificant result of overinvestment scenario is also consistent with the findings of Handayani, Siregar, and Tresnaningsih (2016), which find that the financial reporting quality does not affect overinvestment. This is likely to be caused by high agency problems, so the financial reporting quality does not prevent the manager (agent) from investing more (overinvestment): for example, with the aim of empire building in order to obtain a higher bonus. Meanwhile, under the conditions of underinvestment, the financial reporting quality has positive effect on investment efficiency, which means that higher financial reporting quality will reduce underinvestment.
Table 6
Summary
Variable Prediction InvEff Prediction OverInvestment Prediction UnderInvestment FRQ
STDebt CC
+
+
+
No Sig Sig (-) No Sig
+ +
+
No Sig No Sig Sig (+)
+ +
+
Sig (+) Sig (-) No Sig
Note. InEff = Investment Efficiency, Overinvestment = Over Investment, Underinvestment = Under Investment, FRQ = Financial Reporting Quality (the aggregate of FRQ_Nic (discretionary revenue), FRQ_Kaz (discretionary accruals), and FRQ_DD (accruals quality)), STDebt = total short-term debt / total debt, CC = the sum of dummy variable (1 if more than 50 years and 0 otherwise, as well as 1 if newly appointed and 0 otherwise).
BAR, Rio de Janeiro, v. 15, n. 2, art. 3, e170120, 2018 www.anpad.org.br/bar
possible once it matures so that the conditions for underinvestment will increase. It is thus understandable that the results of this study show debt maturity has negative effect on investment efficiency, under conditions of underinvestment. Meanwhile, in conditions of overinvestment, STDebt had no significant effect on investment efficiency. This is in line with the results of a study conducted by Mauludy (2015), which indicates that debt maturity has no significant effect on overinvestment.
Two proxies are used in measuring the career concerns of CEO, namely age and time since appointment. Regression results indicate that CEO career concerns have no significant effect on investment efficiency (this does not support H3). To examine the specific effect of CEO career concerns on investment efficiency, companies are classified into two scenarios, namely overinvestment and underinvestment. Based on the regression result, the career concerns of the main CEO variable has a significant positive effect on overinvestment (in support of H3a), but does not have a significant effect on the underinvestment scenario (does not support H3b).
The insignificant result of all samples is likely due to underinvestment conditions, which also shows insignificant result. Based on the descriptive statistics, most of observations may not be constrained by funding problems, as indicated by the high proportions of property, plant, and equipment, so the career concerns of the CEO, primarily related to age and time since appointment, are not significant under conditions of underinvestment. The positive and significant effect of overinvestment on investment efficiency is in support of hypothesis 3a and consistent with finding in Xie (2015). Xie (2015) argues that CEOs that have been in office for longer period (and have less career concerns) are likely to keep the status quo and to be inefficient in making investments.
The results show that overinvestment is affected by the control variables Loss, CFO, Size, Tang, and TobinQ. Tang has a significant and positive effect on investment inefficiency, with the assumption that the greater the amount of tangible assets that exist in the company, the higher the possibility of overinvestment, because the assets can be used as guarantees for external funding. The control variables CFO, Size, and TobinQ are closely related to firm size, as well as the company’s financial condition. It can thus be assumed that the greater the availability of funds, the more likely the company is to experience inefficiencies in the overinvestment scenario. The Loss control variable has a negative and significant influence on overinvestment, with the assumption that a higher loss rate will mitigate investment inefficiency in the form of overinvestment, assuming that if the company suffers losses in the current year, it will subsequently be less likely to overinvestment due to limited funds. These results are consistent with the results of research conducted by Gomariz and Ballesta (2014). The LnAge and Lev control variables in the overinvestment scenario do not affect investment inefficiency. The control variables that affect investment inefficiency in the underinvestment scenario are Tang, CFO, and Lev. Under underinvestment conditions, control variables that have no significant effect are LnAge, Loss, Size, and TobinQ.
Conclusion
effect only on overinvestment scenario, whereas in the sample as a whole and also under the conditions of underinvestment, CEO career concerns do not have significant effect. CEOs that are newly appointed (having more career concerns) maybe tend to enhance their reputation by making efficient investment decisions.
The results of this study have several implications. The evidence that financial reporting quality plays a very important role in investment activities (especially in underinvestment conditions), allows regulators to make regulations to improve reporting quality; for example, issuing regulations that can minimize the potential for management to manipulate financial statements. Future studies should expand the research related to investment efficiency and identify other factors that affect it. The finding of shorter debt maturities can negatively affect investment efficiency in underinvestment conditions, suggest that the companies should pay attention to their debt policy. CEO career concerns have significant effect in overinvestment conditions. Therefore, companies may need to consider age as one of the factors in appointing a new CEO and to set a limit as to how many times a CEO can be re-elected
There are several limitations of this study. It only examined non-financial companies listed on the Indonesian Stock Exchange. Future research may examine financial companies, to see whether the results hold in this industry. This study only employed a simple model to measure investment inefficiency, which is based on revenue growth (following Gomariz & Ballesta, 2014). Further research may develop more complex measures to capture investment efficiency. This study already used aggregate measures of financial reporting quality (based on 3 models), but it is possible that these models do not comprehensively measure financial reporting quality. Therefore, future research could use other proxies to measure the quality of financial reporting, such as readibility (Biddle et al., 2009). Future studies may also incorporate other variables that may affect investment efficiency, such as corporate governance variables.
Contributions
Concept: 1st author and 2nd author Design: 1st author and 2nd author
Writing and analysis of the manuscript: 1st author and 2nd author Discussion of results: 1st author and 2nd author
Participated in final revision and final approval of the paper: 1st author and 2nd author
References
Amrullah, Z. (2015). The effect of financial reporting quality and debt maturity on investment
inefficiency in Indonesia. Retrieved from
http://www.academia.edu/16307995/The_Effect_of_Financial_Reporting_Quality_and_Debt_ Maturity_on_Firm_s_Investment_Efficiency_in_Indonesia
Berger, A. N., & Udell, G. F. (1998). The economics of small business finance: The roles of private equity and debt markets in the financial growth cycle. Journal of Banking and Finance, 22(6/8), 613-673. https://doi.org/10.1016/s0378-4266(98)00038-7
BAR, Rio de Janeiro, v. 15, n. 2, art. 3, e170120, 2018 www.anpad.org.br/bar
investment efficiency?. Journal of Accounting and Economics, 48(2/3), 112-131. https://doi.org/10.1016/j.jacceco.2009.09.001
Bushman, R. M., & Smith, A. J. (2001). Financial accounting information and corporate governance. Journal of Accounting and Economics, 32(1/3), 237-333. https://doi.org/10.1016/s0165-4101(01)00027-1
Chen, F., Hope, O.-K., Li, Q., & Wang, X. (2011). Financial reporting quality and investment efficiency of private firms in emerging markets. The Accounting Review, 86(4), 1255-1288. https://doi.org/10.2308/accr-10040
Childs, P. D., Mauer, D. C., & Ott, S. H. (2005). Interactions of corporate financing and investment decisions: The effects of agency conflicts. Journal of Financial Economics, 76(3), 667-690. https://doi.org/10.1016/j.jfineco.2004.06.012
Dechow, P. M., & Dichev, I. D. (2002). The quality of accruals and earnings: The role of accrual estimation errors. The Accounting Review, 77(s-1), 35-59. https://doi.org/10.2308/accr.2002.77.s-1.35
D’Mello, R., & Miranda, M. (2010). Long term debt and overinvestment agency problem. Journal of Banking and Finance,34(2), 324-335. https://doi.org/10.1016/j.jbankfin.2009.07.021
Diamond, D. W. (1991). Debt maturity structure and liquidity risk. Quarterly Journal of Economics, 106(3), 709-737. Retrieved from http://www.jstor.org/stable/2937924
Diamond, D. W. (1993). Seniority and maturity of debt contracts. Journal of Financial Economics, 33(3), 341-368. https://doi.org/10.1016/0304-405x(93)90011-y
Flannery, M. J. (1986). Asymmetric information and risky debt maturity choice. The Journal of Finance,41(1), 19. https://doi.org/10.2307/2328342
Gomariz, M. F. C., & Ballesta, J. P. S. (2014). Financial reporting quality, debt maturity and investment efficiency. Journal of Banking & Finance, 40, 494-506. https://doi.org/10.1016/j.jbankfin.2013.07.013
Haming, M., & Basalamah, S. (2010). Project and business feasibility study. Jakarta: Bumi Aksara.
Handayani, U. T., Siregar, S. V., & Tresnaningsih, E. (2016). Kualitas pelaporan keuangan, mekanisme governance, dan efisiensi investasi. Jurnal Akuntansi Multiparadigma, 7(2), 270-287. https://doi.org/10.18202/jamal.2016.08.7021
Healy, P. M., & Palepu, K. G. (2001). Information asymmetry, corporate disclousure, and the capital markets: A review of the empirical disclousure literature. Journal of Accounting and Economics, 31(1/3), 405-440. https://doi.org/10.1016/s0165-4101(01)00018-0
Jensen, M. C. (1986). Agency costs of free cash flow, corporate finance, and takeovers. The American Economic Review, 76(2), 323-329. Retrieved from www.jstor.org/stable/1818789.
Kasznik, R. (1999). On the association between voluntary disclosure and earnings management.Journal of Accounting Research, 37(1), 57-81. https://doi.org/10.2307/2491396
40 of 2007 concerning limited liability company. Retrieved from https://cdn.indonesia- investments.com/documents/Company-Law-Indonesia-Law-No.-40-of-2007-on-Limited-Liability-Companies-Indonesia-Investments.pdf
Li, X., Low, A., & Makhija, A. K. (2011). Career concerns s and the busy life of the young CEO [Working Paper nº 2011-03-004]. Fisher College of Business, Columbus, OH. Retrieved from https://ssrn.com/abstract=1761523
Mauludy, C. I. (2015). Analisis pengaruh kualitas pelaporan keuangan, debt maturity, dan foreign ownership terhadap efisiensi investasi pada perusahaan non-keuangan di Indonesia periode 2009-2013 (Skripsi). Fakultas Ekonomi dan Bisnis Universitas Indonesia, Indonesia.
McNichols, M. F., & Stubben, S. R. (2008). Does earnings management affect firms’ investment decisions. The Accounting Review, 83(6), 1571-1603. https://doi.org/10.2308/accr.2008.83.6.1571
Myers, S. C. (1977). Determinants of corporate borrowing. Journal of Financial Economics, 5(2), 147-175. https://doi.org/10.1016/0304-405x(77)90015-0
Ortiz-Molina, H., & Penas, M. F. (2008). Lending to small business: The role of the loan maturity in dressing information problems. Small Business Economics, 30(4), 361-383. https://doi.org/10.1007/s11187-007-9053-2
Rajan, R. G. (1992). Insiders and outsiders: The choice between informed and arm’s‐length debt. The Journal of Finance, 47(4), 1367-1400. https://doi.org/10.2307/2328944
Regulation number X.K.6. (2012). Rule number X.K.6 - Obligation to submit annual report for issuers or public companies. Jakarta, Indonesia: Otoritas Jasa Keuangan.
Xie, J. (2015). CEO career concerns s and investment efficiency: Evidence from China. Emerging Markets Review, 24, 149-159. http://dx.doi.org/10.1016/j.ememar.2015.06.001
Authors’ Profiles
Darlin Aulia
FEB UI Campus Widjojo Nitisastro, Jl. Prof. Dr. Sumitro Djojohadikusumo, Kukusan, Beji, Kukusan, Beji, Depok City, West Java 16424, Depok, West Java, 16424, Indonesia. E-mail address: [email protected]. https://orcid.org/0000-0003-2411-5630
Sylvia Veronica Siregar