1
Sonophoresis efficiency: Consequences of methyl donors supplementation
at early developmental stage in gilthead seabream (Sparus aurata). Effects
on growth, nutrient metabolism, egg and larval quality, and methylation
patterns of larvae and juvenile fish.
André Lopes
Tese de Mestrado
Mestrado em Aquacultura e Pescas
Trabalho efectuado sob a orientação de: Doutora Sofia Alexandra Dias Engrola
The thesis was done in the University of Algarve, Faculty de Science and Technologies, in the Aquaculture Research Group (AQUAGROUP) from the Centre of Marine Sciences (CCMAR). This work was funded under the EU 7th Framework Programme by the ARRAINA project nº 288925: Advanced Research Initiatives for Nutrition & Aquaculture.
2
Abstract
It is essential that the vegetable ingredients that will be use in Aquaculture feeds can maintain the growth parameters in fish when compared with the fish meal diets. Studies have shown that the replacement may be achieved until a certain level without affecting the growth parameters. Sometimes the vegetable diets lack essential amino acids that need to be supplemented in the feeds, one of the amino acids that sometimes is lacking is the Methionine. In this study the gilthead seabream (Sparus aurata, L. 1758) eggs were supplemented with Methionine to understand if the supplementation had an effect in the larvae growth. The supplementation was performing using the innovative technique Sonophoresis. The amount of Methionine that entered the supplemented eggs was 33.1-fold higher than in the eggs that were not supplemented. Due to the supplementation the oil globule area of the larvae of the treatment MET was higher in the 2 and 4 days after hatching (DAH), also the dry weight was higher in the larvae of treatment MET during the first week. After the first week the larvae of both treatments presented similar growth parameters so a later supplementation was planned and performed at 57 DAH. This second supplementation was done using a Vegetable feed (VEG) supplemented with methionine. At the end of the experiment the juveniles that were from the eggs supplemented and were fed with VEG diet (METVEG) presented higher condition factor (K). In conclusion the Sonophoresis technique was a success, which allowed the alteration of the composition of the egg with the methionine, the early supplementation was able to promote growth in gilthead seabream larvae. The VEG diet did not negatively affected the survival and promoted fish to achieve similar weight to the FM diet.
3
Index
1. Introduction
2. Materials and Methods
2.1 Sonophoresis prototype system
2.1.1 Gilthead seabream eggs supplementation 2.2 Larvae rearing
2.2.1 Challenge period 2.3 Experimental Inert diets 2.4 Sampling
2.5 Biochemical determinations 2.5.1 Proximal composition 2.5.2 Total lipids in the eggs
2.5.3 Free amino acids and one-carbon metabolites in the eggs
2.6 Determination of larval robustness 2.6.1 Specific activity index (SAI) 2.6.2 Acute and chronic stress test 2.6.3 Point of no return (PNR) 2.6.4 Fulton`s Condition factor (K) 2.7 Statistical analysis 3. Results 3.1 Supplementation 3.2 First period 3.3 Rearing period 3.4 Challenge period
3.5 Lipids and proteins in the feed 4. Discussion
4.1 Sonophoresis: as a tool to enrich fish eggs
4.2 Early methyl donor supplementation: influence during early development
4.3 Nutritional programming: diet methyl donor supplementation 5. Conclusions 6. References 4 10 10 11 11 13 13 14 15 15 16 16 16 16 17 19 19 19 19 19 22 26 28 33 33 33 34 36 39 39
4
1. Introduction
Gilthead seabream (Sparus aurata) (Linnaeus, 1758) is a demersal fish, that can live in depth that range between 0- 150 meters but usually is found in 0-30 meters, it can be found in seagrass beds, sandy bottoms and rocky areas (FAO, 2016). It is euryhaline, often enters in brackish waters (Palvlidis and Mylonas, 2011). It is a sedentary fish that lives in solitary or small groups (Palvlidis and Mylonas, 2011). It lives in the Subtropical area, ranging between 62°N- 15°N, 17°W - 43°E (FAO, 2016). It is distributed in the Eastern Atlantic, Mediterranean and black sea (Fig. 1).
Figure 1. Distribution of gilthead seabream (FAO, 2016).
It is a carnivorous fish; it feeds on shellfish, crustaceans and fish (Palvlidis and Mylonas, 2011). Protandric hermaphrodite specie, this mean that is first male and then female, this passage occurs after the second year or third year of age (20-30 cm, maximum length is 70 cm) (FAO, 2016). The spawning season in the wild is generally from October to December with sequenced spawning (FAO, 2016). Spawning in captivity is easily achieved and a female can lay 1 million eggs per kg each year, in several successive spawning’s (FAO, 2016). Females may lay eggs all year in captivity, if the temperature and the duration of the day (by increasing the number of hours with light in the broodstock tanks) is controlled (FAO, 2016). The fertilized eggs are incubated for 2 days at 16-17°C. The average egg size is around 0.9-1.1 mm while the average length of the larva at hatching is 2.5-3.0 mm (FAO, 2016). Usually gilthead seabream is reared in land-based hatcheries, and broodstock tanks contain between 1 year old males till 10 years old females, with a ratio of 3:1 males to female (Palvlidis and Mylonas, 2011). Larval stages last about 50 days at 17.5°C or about 43 days at 20°C (FAO, 2016), they are consider juveniles when the gastric gland becomes functional (Palvlidis and Mylonas, 2011). This species is very popular in the Southern Europe and, the main markets are Spain and Italy. The main producers in Europe (Figure 2) are Greece, Turkey, Spain and Italy,
5 producing near 75 000, 41 700, 16 800 and 8 400 Tones, respectively (FEAP, 2013). In Portugal its consumption is much appreciated. In 2013 the production was 1 500 tons (FEAP, 2013). The price varies by country, and it is near 5 €/kg in Spain and Portugal (Fig. 2).
Before 1980 the culture of seabream was manly extensive, in costal lagoons and saltwater ponds, but in the 80s the intensive rearing systems were developed and the production shifted to semi-intensive (FAO, 2016). The first successful reproduction in captivity was obtained in a small-scale hatchery in Italy (Palvlidis and Mylonas, 2011). It is a specie very suitable for intensive aquaculture because presents a high adaptability to intensive rearing conditions and due to its high market price. During the ongrowing phase the production is usually done in offshore cages and/or land facilities, but the eggs and larvae are maintained in indoor tanks (hatchery) (FAO, 2016). The standard system for intensive larval rearing is based on living prey during the first weeks, usually rotifers and Artemia sp. The weaning is started around the 5th week by co-feeding inert diet.
Figure 2. Main country producers of gilthead seabream (FEAP, 2013).
One of the main goals of Aquaculture has been to reduce the feeding cost (Ai and Xie, 2005), since feeding accounts for more than 50 % of the productions costs (Rana et al., 2009). Also global fish meal production will decline in the near future and fish meal price
6 will increase, so feed manufacturers will need to turn to less expensive protein sources (Drew et al., 2007; Sánchez-Muros et al., 2003) like proteins from vegetables origins. Fish have a high dietary protein requirement, especially carnivorous fish, so protein usually accounts for 40–50% of feed dry matter (Deng et al., 2006; Dersjant-li, 2002; Oliva-Teles, 2000). Fish meal (FM) is very important in commercial feeds for fish, due to factors like protein quality, peptide profile and palatability (Drew et al., 2007; Robaina et al., 1995). Protein is a basic component of fish diets, both in terms of quantity and quality, fish meal should provide an adequate balance of amino acids(AA) so that the fish sustain optimal growth and development, especially larvae (Aragão et al., 2007). To reduce the use of fish protein in the diets there is a need to find substitutes; the vegetable proteins are the most promising candidates (Aragão et al., 2003; Dias et al., 2009). Some of the most promising are sunflower, soy bean, pea, wheat and corn meal.
It is important that the vegetable protein used in the Aquaculture feeds maintains or increases the levels of feed intake, feed conversion efficiency, growth rate and survival in fish when compared with FM diets (Li et al., 2009a). Some studies have showed that the replacement may be achieved until a certain level. Pea seed meal might be use to replace fishmeal till 20% of replacement, since a replacement higher than 20% reduced the performance of juvenile seabream (Pereira and Oliva-Teles, 2002). Gilthead seabream juveniles fed a diet with a 12% inclusion of sunflower meal, showed better growth and lower feed conversion ratio(FCR) when compared to fish fed 24 or 36% sunflower meal inclusion (Sánchez-Lozano et al., 2007). Regarding the replacement of fish meal by soybean meal (SBM) some studies have showed that the replacement of marine ingredients with SBM negatively affected the performance of the gilthead seabream juveniles. Seabream juveniles that were fed a diet with 30% inclusion of SBM had no detrimental effect on feed intake; however diet digestibility was lower when compared to a commercial diet (Robaina et al., 1995). Gilthead seabream (9-50 g) digestibility was not affected when the fish were fed diets with an inclusion of 20% to 45% of SBM however FCR was negatively affected by the inclusion (Venou et al., 2006). Senegalese sole postlarvae fed a diet that included soy protein concentrate (60% of substitution) showed similar growth performance to fish fed standard diet (Aragão et al., 2003).
In gilthead seabream fingerlings fed diets containing up to 100% (50, 75 and 100%) of vegetable mixture (corn gluten, wheat gluten, extruded peas, rapeseed meal and sweet
7 white lupin) and supplemented with indispensable amino acids (IAA) presented lower growth probably due to a lower intake and not a poor nutrient utilization (Gómez-Requeni et al., 2004). The decrease of fish performance may be attributed to an imbalance of amino acid profile in the diets, or to the presence of anti-nutritional factors (protease inhibitors, phytic acid, among others) (Francis et al., 2001).
A replacement of 40 or 60% of FM by a complementary mixture of vegetable ingredients (soy, peas, corn gluten, wheat gluten and wheat) had no detrimental effect on growth performance of the gilthead seabream (Dias et al., 2009). A similar growth (similar to the standard diets) of gilthead seabream juveniles was observed until a 90% replacement of fish meal probably because an adequate amino acid profile for fish growth was achieved through the combination of rice and pea protein concentrates (Sánchez-Lozano et al., 2009). Usually the vegetable protein meal have deficiency in one or more indispensable amino acid (IAA), so when formulating a fish diet is necessary to combine various protein sources or supplement with crystalline AA that are in deficiency in order to achieve a diet with a balance of IAA (Conceição et al., 2003; Dias et al., 2009).
Amino acids (AA) are defined as organic substances containing both amino and acid groups, all AA have an asymmetric carbon and exhibit optical activity except for glycine, which do not have an asymmetric carbon. The configuration of AA (L- or D-isomers) is defined with reference to glyceraldehyde (Wu, 2009). Amino acid imbalances will result in inevitable amino acid losses; there is always an amino acid loss due to being used as energy source (Conceição et al., 2003; Aragão et al., 2007). The ideal dietary AA profile depend on the absorption efficiency of the AA, the profile of proteins being synthesized and the preferential use of AA for energy or other purposes (Conceição et al., 2003). Amino acid (AA) are classified as Indispensable AA (IAA) and Dispensable AA (DAA), IAA are the ones that cannot be synthetize by the animal they need to be supplied. For seabream the IAA are Arg, His, Ile, Leu, Val, Lys, Met, Phe, Thr and Trp. The DAA are Ala, Asp, Glu, Gly, Pro, Cys, Ser, Gln, Asn and Tyr (Aragão et al., 2007; Dias et al., 2009; Gómes-Requeni et al., 2004).
Methionine is an indispensable amino acid for normal growth of most animals including fish (Mai et al., 2006), is required in the synthesis of cysteine, taurine and methyl-donor in cellular metabolism (Kwasek et al., 2014). Some studies have shown that substitution of FM by vegetable protein can be done till a certain level of substitution and methionine
8 supplementation might improve the fish growth as well the feed efficiency of vegetable diets. Nevertheless excessive intake of methionine may cause toxicity that results in poor growth, which in the case of the yellow croaker (Pseudosciaena crocea) was probably due to disproportionate amounts of methionine affecting the absorption and utilization of other amino acids (Mai et al., 2006). For instance in hybrid striped bass (Morone chrysops
× M. saxatilis) the methionine deficiency in the feeds may reduce or exhaust reservoirs
of antioxidants such as ascorbic acid, glutathione and vitamin E in various tissues of the fish, which may result in irreversible oxidative stress, further aggravating growth retardation, feeding depression and mortality (Li et al., 2009b). In yellow croaker growth rate was higher when the diets were supplemented with methionine (0.25; 0.5; 0.75; 1.0; 1.25 %/kg diet), also the feed utilization was improved (Mai et al., 2006). In European seabass the methionine supplementation appeared to have a positive effect on the immune status by improving the peripheral leucocyte response followed by higher complement activity and bactericidal capacity (Machado et al., 2015).
Methionine is the precursor of S-adenosylmethionine (SAM); it is the principal donor of methyl groups in animals. SAM donates a methyl group and the methyltransferase enzymes add the methyl group to DNA, RNA, lipids, and proteins (Shorter et al., 2009) (Fig. 3). The balance between S-adenosylhomocysteine (SAH) (SAH results of the transfer of the methyl group of SAM) and S-adenosylmethionine (SAM) regulates the maintenance of methyl groups and homocysteine homeostasis (Kwasek et al., 2014). The ratio can be affected by S-adenosylhomocysteine hydrolase (SAHH) activity, which is involved in the hydrolysis of SAH to homocysteine and adenosine (Kwasek et al., 2014). The homeostasis of homocysteine is dependent on genetic factors and nutrient intake (Folic acid, vitamin B6, and vitaminB12), and it may be regulated via conversion back to methionine (remethylation) or transition to cysteine and taurine (transsulfuration) in reactions requiring cystathionine β-synthase (CBS) (Kwasek et al., 2014). Betaine-homocysteine methyltransferase(BHMT) and methionine synthase are the two major enzymes involved in the remethylation pathway, BHMT's major role is catalysis of methyl group transfer from trimethylglycine to homocysteine with end products methionine and dimethylglycine (Kwasek et al., 2014).
9
Figure 3. Methyl donor metabolic pathway (Shorter et al., 2009).
L-methionine is the natural isomer, the animals may absorbed and use it efficiently (Li et al., 2009a). In mammals this occurs in the liver thru the transmethylation, remethylation, transsulfuration and is likely present in fish, in different amounts depending of the species (Li et al., 2009a). Most of the studies with methionine supplementation were done in juvenile or adult fish; there is a lack of knowledge regarding the effects in the early stages of development. Nutritional programing is the use of a nutritional a stimulus or various stimuli in early development stage that affect permanently the individuals (Mathias et al., 2014; Izquierdo et al., 2015; Rocha et al 2015). During early development the animal is more sensitive to the stimulus and the effect may last during a longer-period or even been seem at later developmental stages (Lucas, 1998). In recent years some studies have been exploring the concept of nutritional programing, in broodstock (Izquierdo et al., 2015) or in the early development stages (Geurden et al., 2014; Fang et al., 2013; Rocha et al., 2015; Rocha et al., 2016; Vagner et al., 2007).
Gilthead seabream broodstock fed with diets containing different amounts of fish oil (FO) and linseed oil (LO), produced less eggs when FO was replaced by LO at 80% substitution and also, the larvae grow less with the increasing of LO (Izquierdo et al., 2015). Seabass larvae fed at mouth opening with diets containing low levels of HUFA (stimulus) when challenged during juvenile phase, were able to show an amplified stimulation of ∆6 Desaturase mRNA but that did not allow the fish to have an adaptation to the low dietary HUFA content diets (Vagner et al., 2009). In zebrafish larvae (Danio rerio) a stimulus (diets with high carbohydrates) applied at first feeding till yolk-sac exhaustion, persist in the long-term, inducing adaptation and potential capacity in the fish to use diets with high
10 carbohydrates (Fang et al., 2013). Zebrafish embryos injected with glucose solution and later (25 days post fertilization) challenged with a high-carbohydrate low-protein diet showed an improved capacity for glucose phosphorylation and a lower glucose retention in viscera (Rocha et al., 2015). A glucidic stimulus performed at mouth opening in gilthead seabream larvae caused some immediate responses at a molecular level and induced some short-term changes in the post-larval glucose metabolic phenotype, by an increase in glucose oxidation, and also a proportionally higher use of glucose for lipogenesis (Rocha et al., 2016). Nutritional programing is an interesting field but is a challenging concept and more studies need to be performed.
To be called programing the stimulus need to be implemented in the early life stages (Luca, 1998), in fish the ideal period should be during egg phase however the lack of nutritional modulation techniques has been a bottleneck in fish programming. To modulate the nutritional reserves of a fish egg, new tools have to emerge. Studies confirming the efficacy of low-frequency ultrasounds (sonophoresis) in enhancing the transport of compounds across skin epithelia, gills and embryo membranes have been reported in fish (Bart et al., 2001; Navot et al., 2011) but are still quiet scarce. The incorporation of a specific nutrient in fish egg is the cornerstone of nutritional programming in aquaculture.
Therefore the objective of this work was to investigate how the supplementation of methionine at early developmental stage (egg phase), using an innovative nutritional modulating technique like sonophoresis, could influence gilthead seabream larvae growth performance and homeostasis, and physiological methylation indicators.
2.
Materials and methods
2.1 Sonophoresis prototype system
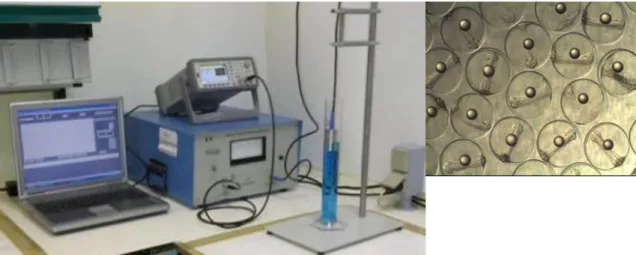
The sonophoresis prototype system is comprised of a signal generator, a signal amplifier and an ultrasound immersion transducer (Fig. 4). Signal programming can be performed directly on the equipment or through a remote (USB or Ethernet) portable computer. The output of the amplifier is connected to the submerged ultrasound transducer which has a diameter of 2.5cm and is designed for a centre frequency of 1kHz. The equipment is available at the CCMAR facilities (Fig. 4).
11
Figure 4. Sonophoresis prototype developed by Aquaculture Research Group (CCMAR).
Figure 5. Seabream eggs.
2.1.1. Gilthead seabream eggs supplementation
The supplementation was performed using Sonophoresis that was applied to the eggs (Fig. 5), using Low frequency ultra sounds, two pulses each one with the duration of 150 sec, with a frequency 80 000 Hz, and Amplitude between 150 mV.
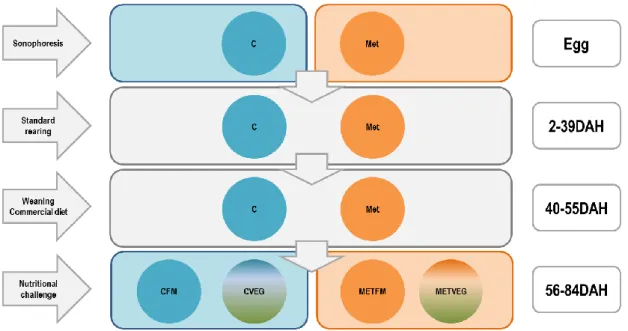
The Long-term experiment had two treatments the Control (CRTL) – no supplementation, and MET50X – Methionine (50X) supplementation (L-Methionine 0.510 mg/ml) in Ringer solution for teleost fish (204.4 g/L NaCl, 8 g/L KCl, 2.25 g/L CaCl2, 3.65 g/L MgCl2 + 6H2O, 2.25 g/L NaHCO3 , pH 8.2). There were 6 replicates per treatment, randomly distributed for 12 tanks (100L capacity). At 57 days after hatching (DAH) the larvae were tested with a nutritional challenge, where each of the two initial treatments were divided in two treatments, one feed with FM and the other fed with VEG diet. The long term experiment lasted till 84 DAH. It was also performed balneation in some eggs, putting the eggs in the MET50X solution for 5 min, 3 replicates (n=100).
2.2 Larvae rearing
Sparus aurata eggs were obtained from a captive broodstock (MARESA - Mariscos de Estero S.A. (Huelva, Spain)). Hatched larvae were reared in 100 L cylindroconical fiber glass tanks in a closed recirculation system, at 18 ± 1ºC, with a salinity between 34-36 ‰ in the dark till the larvae open the mouth (2 DAH), after photoperiod was changed to 12h
12 (Light):12h (Dark) at the Ramalhete facilities (Universidade do Algarve/CCMAR; Faro, Portugal). Environmental parameters were measured daily. The initial density of larvae in experiments was 300 larvae/L, from 7 DAH the density was below 200 larvae/L(because of the sampling). Constant aeration was provided and the oxygen dissolved in water was always above 80% of oxygen saturation in water. The experimental system was equipped with a mechanical filter (custom made), a submerged biological filter, a protein skimmer (AquaMedic, Germany) and a UV sterilizer (TMC, UK). Filters with 150μm mesh were used at mouth opening and filters with 500μm mesh were used in the tanks when the larvae started to be fed with Artemia.
Larvae were fed rotifers (Brachionus rotundiformis) enriched with Easy DHA SELCO (INVE, Belgium), two meals of enrichment (2 x 0.05g/L) 0.10g/L at 3h and 6h before the first feeding of the larvae, the amount of rotifers used were calculated using the Table 1 (Fig. 5). From 14 DAH till 29 DAH the larvae were fed with Artemia AF480 (AF) (INVE, Belgium), then at 20DAH the larvae were feed also with Artemia GSL (EG) (INVE, Belgium) enriched with Easy DHA SELCO (2 x 0.2g/L) (INVE, Belgium) and MicroFeed AgloNorse (2 x 0.2g/L) in two meals 11h and 5h before the first feeding till. Live preys were offered to the larvae three times per day, once in the morning (10:00h), early afternoon (14:30h) and in late afternoon (17:00h). The green water technique (with frozen
Nannochloropsis oculata) was used when the larvae were fed live preys.
Table 1. Gilthead seabream feeding plan.
Age (DAH) Rot (ml) na AF (ml) M24 (ml) Inert diet (mg)
3 15 4 - 13 20-26 14 - 23 28 - 10 1.5 24 - 29 1.0 – 1.2 0.5 – 8.0 30 - 50 10.0 – 1.0 51-60 0
13 2.2.1 Challenge period
Weaning was done using a feeding strategy during 11 days. Larvae started the co-feeding regime with Artemia metanauplii and commercial inert diet at 40 DAH. After 51 DAH fish were fed exclusively with inert diet.
At 57 DAH fish were challenged with two experimental diets: FM (marine based diet) and VEG (vegetable diet). The initial supplemented eggs, Treatment C and Treatment MET, where divide each in two groups during the challenge period that were fed with one of each diets. The treatment C was fed FM or VEG diet and passed to be Treatment CFM and CVEG, respectively. The MET treatment were fed with the experimental diets and passed to be treatment METFM and METVEG (Table 2).
Figure 5. Experimental design.
2.3 Experimental Inert diets Manufacturing and composition
Experimental diets formulation is shown in Table 1. The diets were formulated to be isonitrogenous (≈ 65 %), isolipidic (≈ 18 %) and isoenergetic (23 kj g -1 dry matter). The diet formulation of the experimental diets is shown in Table 2.
Table 2. Diet formulation of the two diets (FM and VEG) used in the experiment.
Ingredient FM diet VEG diet
14
Fish meal 47.0 9.0
Fish soluble protein 7.0 7.0
Pea protein concentrate 5.0 20.5
Wheat gluten 5.0 20.5 DL-Methionine 0.0 1.0 Betaine HCl 1.0 1.0 Taurine 0.6 0.6 Lysine 0.0 0.6 Tryptophan 0.0 0.3 Fish oil 3.0 2.0 Linseed oil 0.0 2.2 Olive Oil 0.0 1.0 Krill Oil 3.0 0.0
Soy lecithin powder 6.3 10.0
Pea starch 2.0 1.5
Vit & Min Premix 2.2 2.2
NaH2PO4 4.0 6.0
Calcium carbonate 1.5 1.5
Binders 5.4 5.9
TOTAL 100.0 100.0
The main difference between experimental inert diets 1 (FM) and 2 (VEG) was the high level of inclusion of plant ingredients in VEG, at the expense of marine ingredients (fish meal) present in FM. Both diets were formulated to contain non-limiting levels of all known required nutrients in fish. Diets were manufactured at Sparos Lda. (Olhão, Portugal), where powder ingredients were initially mixed accordingly to each target formulation in a double-helix mixer, being thereafter ground twice in a micropulverizer hammer mill (SH1, Hosokawa-Alpine, Germany). The oil fraction of the formulation was subsequently added and diets were humidified and agglomerated through low-shear extrusion (Italplast P55, Italy). Upon extrusion, feeds were dried in a convection oven (OP 750-UF, LTE Scientifics, United Kingdom) for 4 h at 60 ºC, being subsequently crumbled and sieved to desire size ranges.
2.4 Sampling
During experiment the eggs were sampled for dry weight (DW) and egg diameter (n= 100 eggs) from each replicate before sonophoresis protocol. In order to evaluate sonophoresis efficiency samples were taken per replicate (n= 100 eggs) to determine total protein and total lipids. For the metabolites of the methionine cycle (SAM, SAH and
15 HCys), Free Amino acids (FAA) and Trimethylglycine (TMG) samples were taken in triplicates (n= 50). To evaluate the impact of supplementation on gene expression eggs were sampled to measure betaine-homocysteine methyltransferase (Bhmt), cystathionine β-synthase (Cbs), S-adenosylhomocysteine hydrolase (Sahh), Igf and Myogenin (Myog). Bhmt was determined using 800 mg of eggs, Sahh was measure in 800 mg of eggs, CBS was determined in 400 mg of eggs, Myog was determined in 50 eggs per replicate, Igf was determined in 50 eggs per replicate, Dnmts was determined in 50 eggs per replicate. These samples are still under analysis and are not included in this Thesis.
Larvae DW, Standard length (SL) and Total length (TL), protein and lipids was determined at Hatching (n=50), 2 DAH (n=100), 4 (n=50), 6 (n=50), 8 (n=50), 20 (n=10), 29 (n=10), 40 (n=15), 57 (n=20) and 84 DAH (n=40) per replicate. FAA, SAM+SAH, Homocysteine, were analyzed at Hatching (n=50), 2 DAH (n=50), 4 (n=50), 6 (n=50), 8 (n=50), and at 84 DAH only sampled to FAA and SAM+SAH (n=20) per replicate. Bhmt were determined at 57 DAH in 10 larvae per replicate. Sahh were measure at 84 DAH in 20 larvae per replicate. Dnmts was determined at 57 (n=15) and 84 DAH (n=15) per replicate. Myog was determined at Hatching (n=40), 2 DAH (n=40), 4 (n=40), 6 (n=40) and 8 DAH (n=40) per replicate. Igf was determined at Hatching (n=40), 2 DAH (n=40), 4 (n=40), 6 (n=40), 8 (n=40), and 84 DAH (n=10) per replicate. Glutathione (GLU) was measured at 84 DAH in 20 larvae per replicate.
Egg diameter, total length, standard length Oil globule area (OGA) and the yolk sac axis were measure using ImageJ software. The dry weight measurements were obtained from freeze-dried samples using a precision scale (0.001 mg). Oil globule area (OGArea) was determined as OGArea = (OGA/2)^2*pi (mm2). Yolk sac area (YSArea) was calculated as YSArea = (YSAM/2)*(YSAm/2)*pi (mm2), where YSAM is the Yolk Sac Axis Major (mm) and YSAm is the Yolk Sac Axis minor (mm). Relative growth rate (RGR) was calculated as RGR (% day-1) = (eg-1) × 100, where g = [(ln final weight - ln initial weight)/time] (Ricker, 1958).
2.5 Biochemical determinations 2.5.1 Proximal composition
The total protein in the diets was determined according to the following procedures: dry matter by freeze-drying for 24h, ash by combustion at 550ºC for 12h, crude protein (N x
16 6.25) by CHN Elemental Vario EL III, crude fat after cold methanol and chloroform petroleum (Bligh and Dyer, 1959). Total phosphorus was determined according to Bolin et al. (1952), after perchloric acid digestion.
2.5.2 Total lipids in the eggs
From the samples 10 mg of DW were added to water (0.8 ml of distilled water in sampling tube) for a 1h, then homogenized (adding to the samples 2 ml of Methanol and 1 ml de Chloroform) in ice 60 sec on Ultrathurrax. Adding 1 ml de Chloroform and homogenize in ice 30 sec no Ultrathurrax. Adding 1 ml of distilled water and homogenize in ice 30 sec no Ultrathurrax. Centrifuging 10 min at room temperature at 2000G. Extract the chloroform phase (inferior), (0.5 a 1.2 ml) place the samples in dry baths (60ºC), until the Chloroform evaporate (+/- 5 h) and weight the samples. Adapted from Bligh & Dyer, 1959.
2.5.3 Free amino acids and one-carbon metabolites in the eggs
Free amino acid, SAM, SAH and trimethylglycine analysis of gilthead seabream were performed after homogeneization in 0.1 M HCl on ice, centrifugation at 1500 × g at 4 ºC for 15 min and deproteinization of the supernatant by centrifugal ultrafiltration (10 kDa cut-off, 2500 × g at 4 ºC for 20 min). For free amino acid analysis, samples were pre-column derivatized with Waters AccQ Fluor Reagent (6-aminoquinolyl-N-hydroxysuccinimidyl carbamate) using the AccQ Tag method (Waters, Milford, MA). Samples for SAM, SAH and trimethylglycine analysis were not derivatized. All analyses were performed by ultra-high-performance liquid chromatography (UPLC) on a Waters Reversed-Phase Amino Acid Analysis System, using norvaline as an internal standard. Amino acids and metabolites were identified by retention times of standard mixtures (Waters) and pure standards (Sigma, Madrid, Spain). Instrument control, data acquisition and processing were achieved by the use of Waters Empower software.
2.6 Determination of larval robustness 2.6.1 Specific activity index (SAI)
Specific activity index (SAI) was done according to the method described by Shimma and Tsujigado (1981) in Lanes et al (2012). Twenty newly hatched larvae from each replicate were placed into 50 ml beakers and kept inside the rearing tank. Dead larvae
17 were counted and removed every 24h until there were no survivors. SAI was calculated using the following formula:
𝑆𝐴𝐼 = 1
𝑁∑(N − ℎ𝑖) × i 𝐾
𝑖=1
Where, N is the total number of larvae, hi is the cumulated mortality by i-th day, K is the number of the days elapsed until all larvae died due to starvation.
2.6.2 Acute and chronic stress test
The acute and chronic stress test was performed in the 2, 4, 6 and 8 DAH, using 20 larvae from 6 tanks that were transferred carefully to 50 ml beakers (Fig. 6). In the acute stress test the larvae were in the beakers with 25ml of filtered seawater (33-35‰ salinity) acclimating for 1-2 h checking for dead larvae, two beakers were the control (normal salinity the whole time), in the other four beakers were added water with high salinity to achieve a final salinity of 65‰, then after 5 min larvae were transfer to beakers with normal salinity, dead larvae were counted and removed, the duration of the test was 90 min, in the beakers of the control water was added (with normal salinity) to achieve the same water volume as the salinity beakers . In the chronic stress test the larvae were in the beakers with 25ml of filtered seawater (33-35‰ salinity) acclimating for 1-2 h checking for dead larvae, two beakers were the control (normal salinity the whole time), in the other four beakers were added water with high salinity to achieve a final salinity of 65‰, and dead larvae were counted and removed the duration of the test was 90 min, in the beakers of the control water was added(with normal salinity) to achieve the same water volume as the salinity beakers.
18 Figure 6– Representation of the salinity test layout, A is the representation of the Acute stress test layout and B is the chronic stress test layout.
The stress test performed in 84 DAH was 30 larvae from the 12 tanks, 15 larvae were transferred carefully to 500 ml beakers, with filtered seawater (33-35‰ salinity) and the other 15 larvae were transferred carefully to 500 ml beakers, with seawater at salinity 100‰ salinity.
19 2.6.3 Point of no return (PNR)
The Point of no return was calculated by adding the cumulative mortalities of the 20 larvae per tank, submitted to starvation.
2.6.4 Fulton`s Condition factor (K)
Body condition was evaluated for all individuals by the Fulton’s condition factor (K; Nash et al, 2006), calculated as follows:
𝐾 =
𝑤𝐿3
∗ 100
Where, K is de Fulton’s condition factor, W is the weight of the larvae (mg), L is the total length of the larvae (mm).
2.7 Statistical analysis
Data is presented as arithmetic means ± standard deviation (SD) of treatments replicates (n= 3 or n=6). All percentage data were arcsine (x1/2)-transformed prior to analysis. The data were analyzed by two-way ANOVA or Student t-test. Differences were considered significant at the P≤0.05 level.
3.
Results
3.1 Supplementation
The free amino acids (FAA) were measure in the eggs of the supplementation (Fig. 7), there was only statistical difference in the level of amino acid Met present in the eggs. The Methionine had much higher values in the eggs that were supplemented (MET = 153.9 ± 2.59 mg AA.g egg-1) than treatment C (4.6 ± 0.06 mg AA.g egg-1), it has a 33.1-fold.
20
Figure 7. Free Amino acids in the Gilthead Seabream eggs. Values are means (±SD) of treatment replicates (n=3). Presence of marcs in the figure indicates statistical differences (P<0.05) between the levels of AA in the eggs from different treatment.
21 The levels of metabolites of the methionine cycle (SAM and SAH) were analyze in the eggs of the two treatments, there were no differences (p>0.05) between the eggs of the treatments (Fig. 8 and 9).
Figure 8. Levels of. S-adenosylmethionine (SAM) in Gilthead Seabream the eggs. Values are means (±SD) of treatment replicates (n=3). Absence of letters indicate no statistical differences (p>0.05) between eggs from different treatments.
Figure 9. Level of S-adenosylhomocysteine (SAH) in Gilthead Seabream the eggs. Values are means (±SD) of treatment replicates (n=3). Absence of letters indicate no statistical differences (p>0.05) between eggs from different treatments.
The levels of Trimethylglycine was not different (p>0.05) between the eggs used in the two treatments (Fig. 10).
Figure 10. Level of Trimethylglycine in Gilthead Seabream the eggs. Values are means (±SD) of treatment replicates (n=3). Absence of letters indicate no statistical differences (p>0.05) between eggs from different treatments.
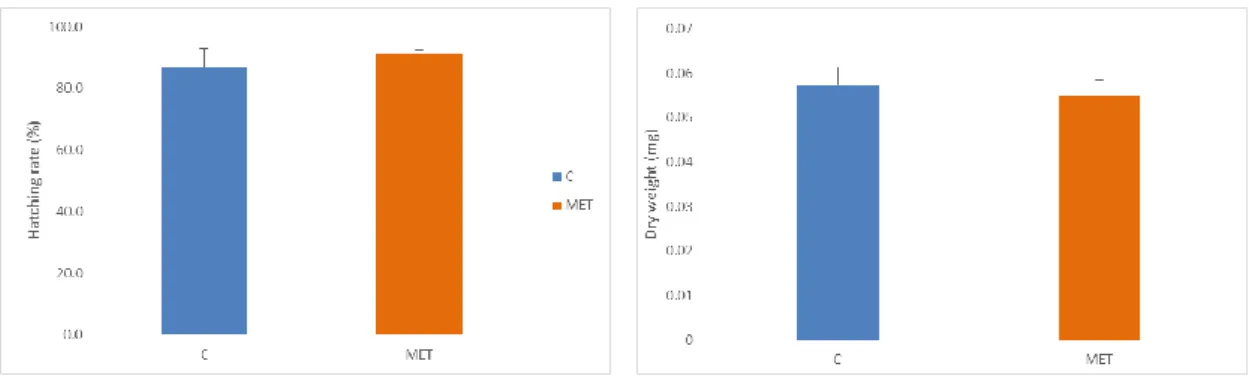
The hatching rate in the control (C) and the group supplemented with methionine (MET) was high, they had a mean of 87% and 91% respectively, the hatching rate was not affected by the supplementation (p>0.05) (Fig. 11). The eggs (n=100 per treatment) were freeze dried and weighted, there were no differences between the eggs of the two treatments (p>0.05) (Fig. 12).
22
Figure 11. Gilthead Seabream hatching rate. Values are means (±SD) of treatment replicates (n=3). Absence of letters indicate no statistical differences (p>0.05) between the different treatments.
Figure 12. Gilthead Seabream dry weight of the eggs. Values are means (±SD) of treatment replicates (n=3). Absence of letters indicate no statistical differences (p>0.05) between eggs from different treatments.
The egg diameter was different between the eggs of the treatments (p<0.05), p=0.027, treatment MET (0.924 ± 0.069 mm) was higher than treatment C (0.908 ± 0.055 mm) (Fig. 13).
Figure 13. Gilthead Seabream Egg diameter. Values are means (±SD) of treatment replicates (n=3). Different letters indicate statistical differences (p<0.05, Student t-test) between larvae from different treatments at the same age.
3.2
First period
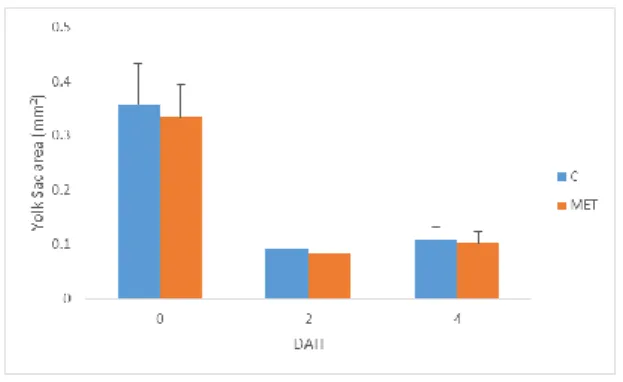
The Yolk sac area was measure in the larvae (the larvae used to TL and SL) of 0, 2 and 4 DAH, there were no differences between the larvae of the treatments (p>0.05) (Fig. 14). The Oil globule area was measure in larvae (the larvae used to TL and SL) of both treatments in 0, 2, 4 and 6 DAH (Fig. 15), there was difference between the larvae of treatments in the 2 and 4 DAH. At 2 and 4 DAH the larvae of treatment C exhibits higher area than larvae of treatment MET.
23
Figure 14. Gilthead Seabream Yolk sac area (0 to 4 DAH). Values are means (±SD) of treatment replicates (n=3). Absence of letters indicate no statistical differences (p>0.05) between egg from different treatments at the same age.
Figure 15. Gilthead Seabream Oil Globule area (0 to 6 DAH). Values are means (±SD) of treatment replicates (n=3). Different letters indicate statistical differences (p<0.05, Student t-test) between larvae from different treatments at the same age.
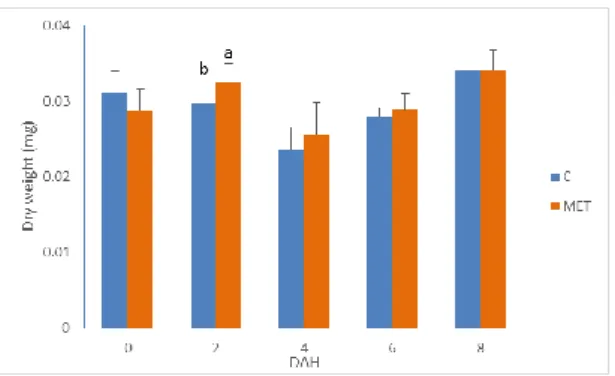
The dry weight of the larvae increase with age, this is normal because the fish are growing, there was difference between the larvae of treatment C and treatment MET (p<0.05), p=0.019, larvae of treatment MET (0.0325 ± 0.0024 mg) were heavier than larvae from treatment C (0.0298 ± 0.0027 mg) (Fig. 16). The standard length (SL) of the larvae increase through the experiment as expected (Fig. 17); there were differences between (p<0.05) the SL of the larvae of the treatments, at 0 DAH the larvae of treatment C (3.14 ± 0.20 mm) had higher values than the larvae of treatment MET (2.95 ± 0.23 mm), and a p-value = 0.0001.
24
Figure 16. Gilthead Seabream dry weight (0 to 8 DAH). Values are means (±SD) of treatment replicates (n=3). Different letters indicate statistical differences (p<0.05, Student t-test) between larvae from different treatments at the same age.
Figure 17. Gilthead Seabream standard length (0 to 8 DAH). Values are means (±SD) of treatment replicates (n=3). Different letters indicate statistical differences (p<0.05, Student t-test) between larvae from different treatments at the same age.
The Condition factor (K) from the 0 DAH till 8 DAH was not different between the treatments (Fig. 18). Larvae from the two treatments were submitted to starvation to analyze the Point of no return (PNR), there were no differences between the larvae of the two treatments (p>0.05) (Fig. 19).
Figure 18. Gilthead Seabream condition factor (K) (0 to 8 DAH). Values are means (±SD) of treatment replicates (n=3). Different letters indicate statistical differences (p<0.05, Student t-test) between larvae from different treatments at the same age.
25
Figure 19. Gilthead Seabream larvae survival rate (0 to 12 DAH). Values are means (±SD) of treatment replicates (n=3). Absence of letters indicate no statistical differences (p>0.05).
In the chronic stress test performed in the larvae of the two treatments on the 2, 4, 6 and 8 DAH (Fig. 20, 21, 22 and 23) presented no difference (p>0.05) between the larvae of the treatments.
Figure 20. Gilthead Seabream larvae (2 DAH) survival in chronic stress test (30, 60 and 90 min). Values are means (±SD) of treatment replicates (n=3). Absence of letters indicate no statistical differences (p>0.05).
Figure 21. Gilthead Seabream larvae (4 DAH) survival in chronic stress test (30, 60 and 90 min). Values are means (±SD) of treatment replicates (n=3). Absence of letters indicate no statistical differences (p>0.05).
Figure 22. Gilthead Seabream larvae (6 DAH) survival in chronic stress test (30, 60 and 90 min). Values are means (±SD) of treatment replicates (n=3). Absence of letters indicate no statistical differences (p>0.05).
Figure 23. Gilthead Seabream larvae (8 DAH) survival in chronic stress test (30, 60 and 90 min). Values are means (±SD) of treatment replicates (n=3). Absence of letters indicate no statistical differences (p>0.05).
26 Also in the acute stress test on the 2, 4, 6 and 8 DAH there was no statistical differences (p>0.05) between the larvae of the two treatments (Fig. 24, 25, 26 and 27).
Figure 24. Gilthead Seabream larvae (2 DAH) survival in acute stress test (30, 60 and 90 min). Values are means (±SD) of treatment replicates (n=3). Absence of letters indicate no statistical differences (p>0.05).
Figure 25. Gilthead Seabream larvae (4 DAH) survival in acute stress test (30, 60 and 90 min). Values are means (±SD) of treatment replicates (n=3). Absence of letters indicate no statistical differences (p>0.05).
Figure 26. Gilthead Seabream larvae (6 DAH) survival in acute stress test (30, 60 and 90 min). Values are means (±SD) of treatment replicates (n=3). Absence of letters indicate no statistical differences (p>0.05).
Figure 27. Gilthead Seabream larvae (8 DAH) survival in acute stress test (30, 60 and 90 min). Values are means (±SD) of treatment replicates (n=3). Absence of letters indicate no statistical differences (p>0.05).
3.3
Rearing period
The larvae of the rearing period (9 to 57 DAH) were sampled at 20, 29, 40 and 57 DAH. The larvae used to the DW were freeze dried and weighted, there were no statistical differences (p>0.05) between the larvae of the treatments (Fig. 28), only at 40 DAH there was difference (p=0.000184) between the larvae of the two treatments, the larvae of treatment C had in average higher DW that the treatment MET, 1.93 ± 0.76 mg and 1.25 ± 0.85 mg respectively.Before the challenge period (57 DAH) the fish showed similar means of dry weight (2.9 ± 1.20 – 3.0 ± 1.87 mg, MET and C respectively). Regarding the RGR there was no differences (p>0.05) between the larvae of the two treatments,
27 treatment C was 7.91±0.99 % day-1 and treatment MET was 8.33±0.73 % day-1, p-value= 0.2525.
Figure 28. Gilthead Seabream dry weight (20 to 57 DAH). Values are means (±SD) of treatment replicates (n=3). Different letters indicate statistical differences (p<0.05, Student t-test) between fish from different treatments at the same age.
The SL of the larvae was statistically different (p<0.05) between the larvae of the treatments on 20 and 40 DAH (Fig. 29), at 20 DAH the SL of the larvae of the treatment MET (5.89 ± 0.32 mm) were higher than treatment C (5.64 ± 0.54 mm), p-value = 0.031, and at 40 DAH the larvae of the treatment C (9.56 ± 1.46 mm) were higher than the treatment MET (8.70 ± 1.35 mm), p-value = 0.0055. Regarding the TL (Fig. 30) the fish from MET treatment presented a higher total length at 20 DAH when compared to larvae from C treatment (6.12 ± 0.33 and 5.83 ± 0.53 mm, respectively), p-value = 0.0145, however opposite results were observed at later developmental stages. Fish from C treatment at 40 and 57 DAH presented higher TL than fish from MET treatment, p-value = 0.0076 and p-value = 0.0027 respectively.
Figure 29. Gilthead Seabream standard length (20 to 57 DAH). Values are means (±SD) of treatment replicates (n=3). Different letters indicate statistical differences (p<0.05, Student t-test) between fish from different treatments at the same age.
Figure 30. Gilthead Seabream total length (20 to 57 DAH). Values are means (±SD) of treatment replicates (n=3). Different letters indicate statistical differences (p<0.05, Student t-test) between fish from different treatments at the same age.
28 The Condition factor (K) from the 20 DAH till 57 DAH did not differ (p>0.05) between the larvae of the treatment C and MET (Fig. 31). The survival of the fish till the beginning of the challenge was in average higher in the treatment C than the treatment MET (Fig. 32), 8.19 ± 4.20 % and 6.96 ± 3.62 % respectively, but there were no statistical differences between the two treatments (p>0.05).
Figure 31. Gilthead Seabream condition factor (20 to 57 DAH). Values are means (±SD) of treatment replicates (n=3). Absence of letters indicate no statistical differences (p>0.05).
Figure 32. Gilthead Seabream survival (at 57 DAH). Values are means (±SD) of treatment replicates (n=6). Absence of letters indicate no statistical differences (p>0.05).
3.4
Challenge period
In the challenge period the initial treatments (C and MET) were divided each into two groups (FM and VEG), so in total there were four treatments (CFM, CVEG, METFM and METVEG). The juveniles of the treatments feed with VEG (CVEG and METVEG) had higher means but there were no statistical difference (p>0.05) between the juveniles of the four treatments (Fig. 33). Regarding the FCR there was no differences (p>0.05) between the juveniles of the four treatments, CFM was 6.14±3.94 % day-1, CVEG was 5.82±3.72 % 1, METFM was 6.48±4.00 % 1, METVEG was 5.93±3.30 % day-1.The standard length of the larvae in the challenge period was different between the treatments (p<0.05) (Fig. 34), the METFM and CVEG were higher (33.99 ± 10.39 mm and 32.60 ± 9.02 mm, respectively) than the CFM and METVEG (28.53 ± 8.13 mm and 27.11 ± 9.82 mm, respectively). The total length of the larvae was different between the treatments (Fig. 35), the METFM and CVEG were higher (41.83 ± 13.01 mm and 39.07 ± 11.92 mm, respectively) and different from the CFM and METVEG (33.54 ± 11.36 mm
29 and 33.39 ± 12.93 mm, respectively). During the challenge period the K was different between the larvae of the treatments (Fig. 36), the juveniles of treatment METVEG had higher K and were different from the juveniles of the others treatments, the juveniles of treatment CFM were the second higher and was different from the juveniles of METFM but not different from the juveniles of CVEG; the juveniles of treatment CVEG were also not different of the juveniles of treatment METFM. The Relative growth rate (RGR) was different between the fish of the treatments (Fig. 37), the fish from treatment CFM had higher RGR and were different from the other treatments; the fish from treatment METVEG were the second higher and were different from the CFM and CVEG; the fish from the treatment METFM were the third higher and were different from the CFM. For the challenge period were used 1145 fish in each tank and the survival of the fish in the end was not different between the fish of the four treatments (it varies between 52.05 ± 3.78 % - 58.02 ± 8.48 %) (Fig. 38).
Figure 33. Gilthead Seabream dry weight (87 DAH). Values are means (±SD) of treatment replicates (n=3). Absence of letters indicate no statistical differences (p>0.05).
Figure 34. Gilthead Seabream standard length (87 DAH). Values are means (±SD) of treatment replicates (n=3). Different letters indicate statistical differences (p<0.05) between juveniles from different treatments at the same age.
30
Figure 35. Gilthead Seabream total length (87 DAH). Values are means (±SD) of treatment replicates (n=3). Different letters indicate statistical differences (p<0.05) between juveniles from different treatments at the same age.
Figure 36. Gilthead Seabream condition factor (87 DAH). Values are means (±SD) of treatment replicates (n=3). Different letters indicate statistical differences (p<0.05) between juveniles from different treatments at the same age.
Figure 37. Relative growth rate (RGR) of the Gilthead seabream (87 DAH). Values are means (±SD) of treatment replicates (n=3). Different letters indicate statistical differences (p<0.05) between juveniles from different treatments at the same age.
31
Figure 38. Gilthead Seabream survival (87 DAH). Values are means (±SD) of treatment replicates (n=3). Absence of letters indicate no statistical differences (p>0.05).
In the stress test performed in the fish of the 4 treatments on the 84 DAH (Fig. 39) presented no difference (p>0.05) between the fish of the treatments.
32
Figure 39. Gilthead Seabream survival in the stress test (30, 60 and 90 min) at 84 DAH. Values are means (±SD) of treatment replicates (n=3). Absence of letters indicate no statistical differences (p>0.05)
33 3.5 Lipids and proteins in the feed
The percentage of Lipids in the dry Feed were measure, the percentage of lipids of the two feeds used in the challenge period were not statistical different (p>0.05), the average percentage of lipids in the FM was 19.7 % and in the VEG was 16.3 %. The percentage of protein in the two feeds used in the challenge period was not statistically different (p>0.05), the average of proteins in the FM diet was 62.7 % and in the VEG diets was 62.9 %.
4. Discussion
4.1 Sonophoresis: as a tool to enrich fish eggs
This work presents one of the first data on supplementation of AA in fish eggs, and also one of the first about sonophoresis as a tool of supplementation in the eggs. Currently, the opportunities to exert a nutritional stimulus during fish embryogenesis are almost restricted to maternal transfer and the onset of exogenous feeding. Some methodologies might be performed prior to mouth opening to incorporate nutrients before exogenous feeding (eggs or larvae), however these techniques need to be species-and nutrient specific. One of the objectives of the present study was to test if sonophoresis technique could modify fish eggs composition through direct nutrient supplementation. In the experiment a 33.1-fold increase in the free methionine was observed after the supplementation (Fig. 7). Studies confirming the efficacy of low-frequency ultrasounds (sonophoresis) in enhancing the transport of compounds across skin epithelia, gills and embryo membranes have been reported in fish (Bart et al., 2001; Navot et al., 2011). Sonophoresis used to introduce AA in trout achieve a hatching rate around 60% and around 80-90% in Seabream (Engrola et al., 2014). Sonophoresis methodology was able to change trout egg composition when performed with aspartate, showed an almost direct dose-response to the supplementation, around 4.5-fold incorporation and with leucine where a 2-fold increase was observed. Other techniques like microinjection might also be suitable to modify egg composition. However, it is a technique that can be applied to gilthead seabream egg (Beirão et al., 2006) but it is not feasible to large scale industries like maternities and in larvae of Zebrafish (Danio rerio), induces lower survival in the injected larvae (Rocha et al, 2014). Zebrafish is a model species, robust commonly used in to perform experiences and less sensitive than gilthead seabream, also in trout it cannot
34 be applied (Engrola S. personal comment). One technique that caused similar impact on fish eggs viability is electroporation, briefly consists in a high voltage electric field that induces a transient state of permeability of the cell membrane, it can be used in eggs, and presents high survival (close to 95% in the lower Voltage used) but like microinjection it cannot be applied to large scale (Allon et al, 2016). In the present study egg viability was determined 1h after the procedure. The high survival rates obtained (100%) indicate that is a technique with low impact on fish viability when compared to microinjection. In the present study, balneation was tested as an alternative methodology that can be applied in large scale but the trial conducted with methionine supplementation was not effective in modifying the egg composition.
Sonophoresis technique was successfully used to modify egg composition with the selected nutrient. The high viability rates after the procedure and the amount of egg that might be processed with this technique makes this methodology quiet suitable for large scale application in fish hatcheries.
4.2 Early methyl donor supplementation: influence during early development A nutritional stimulus applied in early life stages that will last till later developmental stages is the base for the concept of Nutritional programing (Lucas, 1998, Mathias et al., 2014; Izquierdo et al., 2015; Rocha et al 2015). Fish larvae have high requirement of AA, that mostly are used for protein deposition (muscle) and catabolism, among other uses (Ronnestad et al., 2003). Methionine, is an IAA for the normal growth of seabream (Finn and Fyhn, 2010) that usually is deficient in the vegetable diets.
The supplementation did not affect the hatching rate, the egg hatching rate was high and was between 87% - 91% in treatment C and MET, respectively. The early supplementation was able to include more Methionine in the egg (33.1-fold), this probably affected the yolk sac nutrients utilization by the larvae. Larvae from treatment MET had similar area of yolk sac when compared with larvae from treatment C. However when comparing the oil globule (lipids) volume, a larger volume was observed in fish from treatment C at 2 and 6 DAH. The yolk is the major source of energy and materials for developing larvae of oviparous species and when is absorbed by the developing embryo and larvae provides the materials to be deposited in the newly forming or growing tissues and supplies energy (Kamler, 1992). So the reduction of the oil globule in
35 treatment MET can indicate that the larvae were using more lipids for catabolism and sparing the amino acids for growth. This hypothesis is confirmed when comparing the dry weight, since a higher DW was observed in larvae from treatment MET during the first week. Fast growth is of vital importance for larval fish as predation susceptibility decreases with increasing body size (Blaxter 1988). In order to grow, larvae should be efficient in metabolizing the available nutrients. In the present study the methionine supplementation was able to change the growth pattern by increasing the amount of free methionine in the yolk sac. This yolk modification was sufficient for the larvae from Treatment MET to grew faster and present a higher K (6 DAH). In a commercial marine hatchery this advantage might be the turning point from a low survival to a high survival rate.
The larva dry weight in the present study was lower than the ones obtained by Rocha et al.(2016) and Aragão et al.(2004), 0.06 mg at 8 DAH and 0.034-0.043 at 0-10 DAH respectively, in the present study the larvae had a DW of 0.031 at 0 DAH and 0.034 at 8 DAH. The larvae of the experiment had length similar to other studies (Pavlidis and Mylonas., 2011; Rocha et al., 2016) 4.44 mm at 8 DAH, and higher values than Çoban et al.(2009), 2.82 mm at 12 DAH, in the present study the larvae length was 4.28 at 8 DAH. Larvae are usually susceptible to stress, especially because of the sampling so it is important that the larvae can withstand the stress and survive. The supplemented larvae did not have limitation of methionine, which could be use as substrate to produce glutathione that is an important substance when the fish are affected by stress. In the stress test (chronic and acute) the larvae survival of both treatments was similar. It is known that lipids are important to larvae in terms of the stress response. Larvae of gilthead seabream feed enriched rotifers and Artemia with arachidonic acid show better survival to acute stress (Van Anholt et al., 2004; Koven et al., 2001). In Japanese flounder (Paralichthys olivaceus) feed diets with soybean phosphatidylcholine (PC) survive better when expose to stress (Tago et al., 1999). Dietary levels of HUFA enhance the milkfish larvae response to stress (Gapasin et al., 1998). In the present study the larvae of both treatments showed high survival in the stress test, possibly the stress test was not robust to identify the possible differences, so the stress test performed at 84 DAH was done with salinity of 100 ‰ instead of 65 ‰ to produce more severe stress.
36 The larvae were submitted to Specific activity index (SAI) test since the hatching, there were no differences between the larvae of the treatments, so the supplementation did not affected the time that the larvae can survived to starvation, even though the larvae of treatment MET used more the reserves (yolk sac) and grow more in the beginning the use of the reserves did not affected the time that the larvae could resist to starvation.
In the present study the methionine supplementation was able to change the growth pattern by increasing the amount of free methionine in the yolk sac. This yolk content modification (Treatment MET) was able to promote growth in gilthead seabream larvae. No other measured parameter was affected by the supplementation.
4.3 Nutritional programming: diet methyl donor supplementation
The early supplementation did not seem to cause great effects till 57 DAH. So the Challenge period of the experiment was planned to test if the early supplementation could still cause effects and perform a second supplementation period thru the feed. The challenge period was the phase when the larvae were feed with dry feed. The eggs supplemented with MET and the C treatments were divided each in two other treatments, which were feed FM or VEG diets. There were 4 treatments each one with three replicates, the CFM, CVEG, METFM and METVEG. The supplementation of methionine in the VEG diets was to ensure that MET was not a limitative amino acid. The treatments CFM and CVEG were fish that belonged to the group of eggs that were not supplemented with methionine and the treatments METFM and METVEG were the ones that the fish belonged to the eggs supplemented with Methionine. The fish accepted well the VEG feed and the fish survival was similar in the 4 groups (52-58%).
There are some studies regarding nutritional programing in fish. Vagner et al. (2009) tested the nutritional programing by feeding larvae of seabass with diets that have low levels of HUFA since the opening of mouth. That stimulus allow the fish (juvenile phase) to show an amplified stimulation of ∆6 Desaturase mRNA. Fang et al. (2013) perform the programing also at the first feeding but in zebrafish larvae (Danio rerio) with diets that have high carbohydrates, the stimulus was till the yolk-sac exhaustion. The effects persisted, inducing an adaptation and potential capacity in the fish to use diets with high carbohydrates. Rocha et al. (2015) did the nutritional programing early than the previous studies reported, it did the stimulus by injecting Zebrafish embryos with glucose solution.
37 The outcome of the programing as tested at 25 days post fertilization, they challenged the fish with a high-carbohydrate low-protein diet and the fish showed an improved capacity for glucose phosphorylation and lower glucose retention in viscera.
There are also some works in Gilthead seabream (Izquierdo et al., 2015; Rocha et al., 2016). Izquierdo et al. (2015) did the stimulus in the broodstock, feeding with diets containing different amounts of fish oil (FO) and linseed oil (LO). The females produced fewer eggs when FO was replaced by LO at 80% substitution and also, the larvae grow less with the increasing of LO. Rocha et al. (2016) performed a glucidic stimulus at mouth opening in gilthead seabream larvae. This stimulus caused some immediate responses at a molecular level and induced some short-term changes in the post-larval glucose metabolic phenotype, by an increase in glucose oxidation, and also a proportionally higher use of glucose for lipogenesis.
The DW of the fish was similar between the 4 groups, so it seems the VEG feed used has a good AA balance and allows the fish sustain a normal growth in terms of DW. In terms of length the fish of the treatments CVEG and METFM show higher values than the other 2 treatments. The fish of treatment CVEG had higher length than the fish of treatment CFM, so it seems that the VEG feed possibly allows a better grow than FM feed on the fish in terms of length, so as referred before the VEG diet might have a good AA balance and so it can be used to substitute the FM diet. The fish of the treatment METFM had higher length than CFM, so it seems that the supplementation in the eggs might have allowed the larvae of treatment METFM to utilize better the FM feed.
It is reported by several studies that it is possibly to incorporate vegetable proteins in the feeds and some levels of substitution without affecting the growth, only one source or mixtures. For example with soybean (Robaina et al., 1995), in feeds given to gilthead seabream had no detrimental effect on growth till 30% of substitution and with feed that contained Lupine seed did not affect the growth of gilthead seabream till 20 % of substitution; attained good growth of southern catfish (Silurus meridionalis) till 39 % of substitution; Pereira e Oliva-Teles (2002), obtained growth of Gilthead Seabream similar to the commercial feed when the fish were feed with a feed that had 20 % substitution of fish protein to pea seed proteins. Sánchez-Lozano et al 2007, obtained no detrimental effects in growth of gilthead seabream till 12 % of substitution of fish proteins per sunflower. Soybean and poultry offal (Quartararo et al., 1998) in feed used on Australian
38 snapper (Pagrus auratus) were possible till 64 % of replacement without affecting the performance of the fish. Pea and rice in the feeds (Sánchez-Lozano et al, 2009), did not affect the growth of seabream till 90% of substitution. A diet formulation with soy, peas, corn gluten and wheat (Dias et al, 2009) used in gilthead seabream was possible till there is only 13 % of protein from fish origin. Those are some of the vegetable products used in the feeds to substitute the fish proteins. In this study the VEG diet had a substitution of 39%. There are some studies were the use of the vegetable products affected the growth of the fish, Kissil et al (2000), obtained inverse relationship between the growth of gilthead seabream and the levels of soy or the levels of Rapeseed; also with soy products Ai and Xie (2005), and Deng et al (2006), had bad effect on growth of Japanese flounder (Paralichthys olivaceus). It is reported that supplementation of methionine in the feeds can help the fish performance (Machado et al, 2015; Naz and Turkmen, 2009; Mai et al, 2006; Kwasek et al, 2014) and some studies have used supplementation with methionine, for example Soybean and methionine (Cheng et al, 2003; Sánchez-Muros et al, 2003; Venou et al, 2006; Aragão et al 2003), methionine and white tea (Pérez-Jiménez et al, 2012a; Pérez-Jiménez et al, 2012b), and obtained no detrimental effects on the growth. Fish of treatment METVEG were supplemented in the eggs and in the feeds, and were the group that when calculated the K had the higher values, so the feed allowed a good performance, as reported before, and it seems that the early supplementation helped the fish to better utilize the feed.
Even performing the stress test with 100‰ of salinity the survival of the fish in the 4 treatments was similar, so nor the early supplementation nor the VEG diet seems to help the fish to survive better to the stress.
In the present study the VEG treatments present similar results to the FM treatments, the fact that the VEG diet did not affected the survival and helped the fish attain similar weight indicates that this died can possibly be use in the culture of Gilthead Seabream as substitution of the commercial died that is used now. Also the fact that the treatment with higher value of K was the group of fish that was supplemented with methionine in the egg and feed with the VEG diet can possibly indicate that the supplementation in the egg probably as effects that helped the fish to better utilize the VEG diet.
39
5. Conclusions
The egg of the treatment MET presented a 33.1-fold increase of free methionine. The Sonophoresis technique was a success, which allowed the modification of the composition of the egg with the selected nutrient. The early supplementation was able to promote growth in gilthead seabream larvae, having the larvae of treatment MET higher DW in the first week. In the challenge period the VEG diet did not negativelyaffected the survival and helped the fish attain similar weight to the FM diet. The fact that the treatment with better K was the METVEG, may indicate that the supplementation in the egg may have helped the fish to better utilize the VEG diet. The METVEG seems to be a sustainable alternative to the commercial feeds being used currently in the gilthead seabream production.
6. References
Ai, Q. H., & Xie, X. J. (2005). Effects of replacement of fish meal by soybean meal and supplementation of methionine in fish meal/soybean meal-based diets on growth performance of the southern catfish Silurus meridionalis. Journal of the World
Aquaculture Society, 36, 498–507.
Allon, G., Gaon, A., Nixon, O., Bitan, A., Tandler, A., & Koven, W. (2016). A novel approach to introduce nutrients into the fish egg; the effect of egg taurine on first feeding gilthead sea bream (Sparus aurata) performance. Aquaculture, 451, 93–98. Aragão, C., Conceição, L. E. C., Dias, J., Marques, A. C., Gomes, E., & Dinis, M. T.
(2003). Soy protein concentrate as a protein source for Senegalese sole (Solea
senegalensis Kaup 1858) diets: Effects on growth and amino acid metabolism of
postlarvae. Aquaculture Research, 34 (15), 1443–1452.
Aragao, C., Conceição, L. E. C., Fyhn, H. J., & Dinis, M. T. (2004). Estimated amino acid requirements during early ontogeny in fish with different life styles: gilthead seabream (Sparus aurata) and Senegalese sole (Solea senegalensis). Aquaculture,
242, 589–605.
Aragão, C., Conceição, L. E. C., Lacuisse, M., Yúfera, M., & Dinis, M. T. (2007). Do dietary amino acid profiles affect performance of larval gilthead seabream? Aquatic
Living Resources, 20 (2), 155–161.
Bart, A. N., Kindschi, G. A., Ahmed, H., Clark, J., Young, J., & Zohar, Y. (2001). Enhanced transport of calcein into rainbow trout, Oncorhynchus mykiss, larvae using cavitation level ultrasound. Aquaculture, 196 (1-2), 189-197.
Beirão, J., Robles, V., Herráez, M. P., Sarasquete, C., Dinis, M. T., & Cabrita, E. (2006). Cryoprotectant microinjection toxicity and chilling sensitivity in gilthead seabream (Sparus aurata) embryos. Aquaculture, 261, 897–903.
40 Blaxter, J.H.S., 1988. Pattern and variety in development. In: Hoar, W.S., Randall, D.J. (Eds.), Fish Physiology Vol XI, The Physiology of Developing Fish Part A: Eggs and Larvae. Academic Press, San Diego, CA, pp. 1-58.
Bligh, E. G., & Dver, W. J. (1959). A Rapid Method of Total Lipid Extraction and Purification. Canadian Journal of Biochemistry and Physiology, 37, 911-917. Bolin, D. W., King, R. P., Klosterman, W. W., (1952). A simplified method for the
determination of chromic oxide (Cr2O3) when used as an inert substance. Science, 116, 634-635.
Cheng, Z. J., Hardy, R. W., & Blair, M. (2003). Effects of supplementing methionine hydroxy analogue in soybean meal and distiller’s dried grain-based diets on the performance and nutrient retention of rainbow trout [Oncorhynchus mykiss (Walbaum)]. Aquaculture Research, 34, 1303–1310.
Çoban, D., Kamaci, H. O., Suzer, C., Saka, Ş., & Firat, K. (2009). Allometric Growth in Hatchery-Reared Gilthead Seabream. North American Journal of Aquaculture, 71 (3), 189–196.
Conceição, L. E. C., Grasdalen, H., & Ronnestad, I. (2003). Amino acid requirements of fish larvae and post-larvae: New tools and recent findings. Aquaculture, 227 (1-4), 221–232.
Deng, J., Mai, K., Ai, Q., Zhang, W., Wang, X., Xu, W., & Liufu, Z. (2006). Effects of replacing fish meal with soy protein concentrate on feed intake and growth of juvenile Japanese flounder, Paralichthys olivaceus. Aquaculture, 258, 503–513. Dersjant-li, Y. (2002). The Use of Soy Protein in Aquafeeds. Avances en Nutrición
Acuícola VI, 541–558.
Dias, J., Conceição, L. E. C., Ribeiro, A. R., Borges, P., Valente, L. M. P., & Dinis, M. T. (2009). Practical diet with low fish-derived protein is able to sustain growth performance in gilthead seabream (Sparus aurata) during the grow-out phase.
Aquaculture, 293 (3-4), 255–262.
Drew, M. D., Borgeson, T. L., & Thiessen, D. L. (2007). A review of processing of feed ingredients to enhance diet digestibility in finfish. Animal Feed Science and
Technology, 138, 118–136.
Engrola, S., Colen, R., Rocha, F., Barrios, C., Rema, P., Conceição, L.E.C., Aragão, C., Dias, J. 2014. In ovo delivery of nutrients using a sonophoresis protocol. Aquaculture Europe 2014 “Adding value“, October 14th-17th, Donostia-San Sebastian, Spain.
Fang, L., Liang, X.-F., Zhou, Y., Guo, X.-Z., He, Y., Yi, T.-L., Liu, L-W., Yuan, X-C., Tao, Y.-X. (2014). Programming effects of high-carbohydrate feeding of larvae on adult glucose metabolism in zebrafish, Danio rerio. The British Journal of Nutrition,