Published in:
Gamito, S., 2008. Three main stressors acting on the Ria Formosa lagoonal system (Southern Portugal):
Physical stress, organic matter pollution and the land–ocean gradient. Estuarine, Coastal and Shelf
Science 77, 710–720.
Three main stressors acting on the Ria Formosa lagoonal system
(Southern Portugal): Physical stress, organic matter pollution
and the land-ocean gradient
Sofia Gamito
IMAR, Faculdade de Ciências do Mar e do Ambiente, Universidade do Algarve, Campus de Gambelas, 8005-139 Faro, Portugalˆ
Abstract
Keywords: benthic invertebrates; distribution patterns; water renewal; eutrophication; physical stress; coastal lagoons
1. Introduction
Elliott (2002) considered that anthropogenic activity re-sulted in particular pressures in the marine ecosystems, such as the effects of bottom trawling, the discharge of cooling water from power stations or of sewage effluents. Recently, Dauvin (2007) designates as pressures particular environmen-tal stressors, including direct pressures such as emissions. In
fact, environmental stressors, either of natural origin or as a re-sult of anthropogenic activity, can rere-sult in particular pressures in the ecosystem. Furthermore, some natural stressors can be modified by human intervention. For instance, physical stress due to high residence time can have a natural origin but its effects or pressure can be changed by anthropogenic activity such as the construction of a dam or the digging up of a chan-nel to increase water circulation.
Coastal lagoons are usually among the marine habitats with the highest biological productivity (Alongi, 1998). As a conse-quence, lagoons play an important ecological role among the
During the last 15 years of the 20th century, several researchers carried out extensive sampling of benthic macrofauna communities in the Ria Formosa lagoon. The main objective of this paper is to discern the main communities of benthic fauna of the Ria Formosa and the leading stressors that limit them based on this large data set.
The high species richness and high diversity values observed at most of the stations or groups of stations indicate a good ecological status, with the exception of the sewage-impacted areas and the physically stressed areas. It was possible to define three main stressors acting on the Ria Formosa. The most important is the physical stress imposed by the limited water renewal in some areas of the Ria Formosa. The second is the nutrient and organic matter pollution that is limited to the vicinity of the sewage outfall stations and to some locations of the Ria Formosa. This is due to the dual effects of the low residence time of water, but also due to a degradation of water quality in places of relatively restricted water circulation but with high primary production, symptoms of eutrophication. The third stressor is the natural land-ocean gradient, denoting the influence of seawater exchanges and emersion time, attenuated by the high water exchange rates of Ria Formosa.
It was possible to differentiate the anthropogenic stress from the natural physical stress through the application of multivariate analysis. However, both structural (species richness and diversity indices) and functional indicators (trophic composition) indicate the same trend - low species richness, low diversity indices, and a community dominated by detritivores species at the locations characterized by high anthropogenic impact or by physical stress. The physically stressed areas were dominated by chironomid larvae and hydrobiid gastropods and the most polluted areas were dominated by oligochaetes, mainly tubificids.
coastal zone ecosystems, providing a collection of habitat types for many species (Clark, 1998) and maintaining high levels of biological diversity. However, most lagoons are sub-jected to human exploitation through fishing, aquaculture, tourism, and urban, industrial and agricultural development, which induce changes that affect their ecology (Gamito et al., 2005).
Depending on their geomorphology and hydrology, these shallow coastal environments may be characterized by gradual or sharp daily and seasonal variations in physicalechemical water parameters. These variations are integrated by the ben-thic communities present in the coastal lagoons. Due to their limited mobility, benthic organisms can integrate environmen-tal conditions over time better than pelagic organisms and are commonly used in the monitoring of anthropogenic impacts (Warwick et al., 1990) or the assessment of ecological patterns.
In a coastal lagoon several environmental gradients are ex-pected to occur. The most important may be the landeocean gradient that is reflected in the sediment grain-size, with fine muddy or sandy mud particles on the land side and coarser sediments near the seaside (Quintino and Rodrigues, 1989). This results from the decreasing hydrodynamic energy as dis-tance from the sea inlet increases. This landeocean gradient is also related with a salinity decrease towards the land side in lagoons with an important freshwater input, or an increase of salinity in lagoons with little freshwater input and important evaporation losses. Guelorget and Perthuisot (1984) call this landeocean gradient a ‘‘confinement’’ gradient. Gamito (1997, 2006) pointed out the importance of water renewal rate in semi-natural lagoons, which may be related with the landeocean gradient, with lower water renewal rates in the inner side of the lagoons, causing persistent physical stress. Another gradient in tidal lagoons is the intertidal/subtidal (and depth) gradient, with few species supporting long emer-sion periods. Other gradients might be resultant from anthro-pogenic activity, such as the release of urban and industrial sewage into the lagoons.
The Ria Formosa is a mesotidal shallow coastal lagoon, with five sand barrier inlands and six inlets, with a wet area of about 100 km2, including tidal channels (29.5 km2) and
an extensive intertidal area constituted by salt marshes (32.1 km2), mud and muddy sand flats (10.1 km2), sandy
sed-iments (14.2 km2) and macrophytes’ beds (8.2 km2), according
to aerial photographs from 1989 (Fidalgo, personal communi-cation). The average depth relative to sea level is 2 m and the flooded surface in spring tides averages 84 km2 (Andrade
et al., 2004). The tidal amplitude ranges from 3.3 m on spring tides to 1.0 m on neap tides, which causes important semi-diurnal and fortnightly tidal amplitude variations, with an esti-mated average water residence time of 1.5 days (Saraiva et al., 2007). However, tidal flushing is not uniform throughout the lagoon and in the upstream locations it may not be well mixed, thereby increasing the residence time of water (Newton and Mudge, 2003; Tett et al., 2003). There are no major freshwater discharges in the western lagoon, where salinity ranges from 13 (due to episodic run-off that occurs from rainfall during
winter) to 36.5, and temperature from 12 to 27 C (Newton and Mudge, 2003).
During the last 15 years of the 20th century, several large studies of benthic macrofauna communities were carried out in the western side of Ria Formosa. These studies had different objectives in view: Austen et al. (1989) sampled two possible gradients of sewage pollution; Calvário (personal communication) sampled a possible gradient of confinement and also four low intertidal stations,
representing the following biotopes: sand, muddy sands, sandy mud and Zostera bed; Gamito(1997, 2006) sampled four water reservoirs of salt pans (Salinas) and of a tidal mill, with different water renewal rates, and a fifth water reservoir, of a semi-intensive fish farm; Sprung (1994) sampled three intertidal stations, a Zostera noltii bed, a sand flat and a mudflat, with the main objective of determining the secondary production of these areas.
Based on the analysis of this large data set, the main objective of this paper was to describe the main
communities of benthic fauna of the Ria Formosa and the leading stressorsthat explain or limit them.
2. Methods
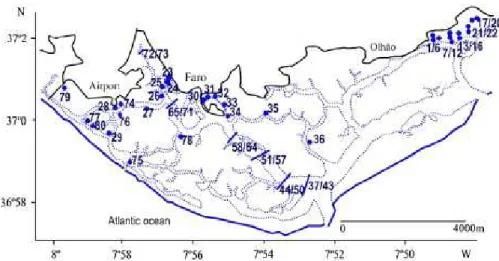
A map with the approximate location of the sampling sta-tions of the four research groups is presented in Fig. 1.
Gamito (1997, 2006) sampled two (sites C, D and E e stations 13/16, 17/20 and 21/22) or three stations (sites A and B e stations 1/6 and 7/12) in each water reservoir, depending on their size and shape. At each station, two cores of 0.01 m2 each
were taken (2 Â 0.01 m2 ¼ 0.02 m2), and the sediment sieved
with 1-mm mesh, except in the fifth reservoir, where four cores were taken (4 Â 0.01 m2 ¼ 0.04 m2) at each station and a
0.5-mm mesh sieve was used. Macrofauna was sampled for 2 years, every second month, at the first four sites, in 1985 and 1986. Site E was sampled from March 1996 to June 1997 every month. The water reservoirs were about 0.4- to 1-m deep, with deeper zones near the tidal gates. The fifth water reservoir was approximately 2-m deep.
Austen et al. (1989) sampled 14 sandy mud stations on the lower intertidal (between MLWN and MLWS), seven stations on each of two transects, during summer 1987 and winter 1988. On transect A (stations 23e29), the sewage outfall drained almost immediately into the Faro channel, a large navigation channel connected to the Atlantic Ocean. At low tide, the sewage from the outfall on transect C (stations 30e36) drained in an enclosed area of mudflat before it met the Faro channel and the rest of Ria Formosa at station 34. Five macrofauna samples were collected with either 10.3 cm (5 Â 0.008 m2 ¼ 0.04 m2) or 12.0 cm (5 Â 0.01 m2 ¼ 0.05 m2)
diameter cores, at each station, and sieved with 0.5-mm mesh sieves. The organisms were identified to family level (see Austen et al., 1989, for details).
Calvário (personal communication) sampled six zones of the Faro channel (stations 37-73), from near the inlet to the city of Faro, in spring, summer, autumn and winter 1989. In each zone a transect was sampled, perpendicular to the main channel, with one station at the bottom of the channel and
Fig. 1. Approximate location of the sampling stations: stations 1-22: Gamito (2006) sites A, B, C, D and E. Stations 1/6 - site A; stations 1 and 4 - near the reservoir gate, first and second year of sampling, respectively; stations 2, 3, 5 and 6 - inner stations, first and second year of sampling. Stations 7/12 - site B; stations 7 and 10 - near the gate, first and second year; stations 8, 9, 11 and 12 - inner stations, first and second year. Stations 13/16 e site C; stations 13 and 15 - near the gate, first and second year; stations 14 and 16 -inner stations, first and second year. Stations 17/20 - site D; stations 17 and 19 - near the gate, first and second year; stations 18 and 20 - inner stations, first and second year. Stations 21/22 - site E; station 21 - near the gate; station 22 - inner station. Stations 23-36: Austen et al. (1989). Stations 23-29 - transect A. Station 23 is the nearest station to the sewage outflow. Stations 30-36 - transect C. Station 30 is the nearest station to the sewage outflow. Stations 37-77: Calvário data set. 37/43; 44/50; 51/57; 58/64; 65/71 - transects along the Faro channel. The first three stations of each group represent the southern margin stations and the last three the northern margin. The middle station corresponds to the deepest station, in the channel. Stations 1, 5, 8, 12, 15, 19, 22, 26, 29 and 33 - spring low water level; stations 2, 6, 9, 13, 23, 27, 30 and 34 e middle littoral zone; stations 3, 7, 10, 14, 17, 21, 24, 28, 31 and 35 - high water level. 72/73 - last transect, station 72 corresponds to the southern margin, spring low water level and station 73 – middle channel station. Station 74 - Zostera bed; station 75 - sand bottom; station 76 - muddy sand bottom; station 77 e sandy mud bottom. Stations 78/80: Sprung (1994). Station 78 - Zostera noltii bed; station 79 - mudflat; station 80 - sand flat.
three intertidal stations on either side of the channel; one station was situated high up in the intertidal zone (MHWS), another in the center (MTL) and the third close to the spring low water mark (MLWS). The innermost part the channel was only some decimeters deep at low tide and samples were taken from the bottom of the channel and at one site from the margin, which lead to 37 stations in total. In the intertidal zone, 15 cores were taken at each station, covering a total area of 0.3 m2. From the bottom of the channel six
sam-ples were taken using a van Veen grab, covering a total area of 0.3 m2
. The sediment was sieved with 1-mm mesh sieves. From January 1990 to January 1991, Calvário (personal com-munication) also sampled, every month, four common bio-topes, in the Ria Formosa, near the spring low water level (MLWS), sand, sandy mud, muddy sand and Zostera bed, using the same methodology used for the intertidal stations (stations 74-77).
Sprung (1994) examined, every second month, 20 cores of 0.01 m2each (20 x 0.01 m2 = 0.2 m2), at each station and
sampling period, between July 1990 and October 1990, and four cores of 0.065 m2each, from December 1990 until
December 1991. The sediment was sieved with 1-mm mesh sieves (stations 78-80).
Previous studies showed that, for several multivariate methods, analyses based on two, three, four or five replicates produced the same main underlying gradients (Gamito and Rafaelli, 1992). However, due to the different sampling strat-egies and taxonomic identifying effort, the data were orga-nized at family level and as relative densities, in percentage. Some mobile fauna such as fish, shrimps and mysids, and
also small crustaceans such as ostracods were not considered in the global data matrix, since they were not sampled with the appropriate techniques. In a first step, the annual average family densities were determined, for each station of the four different teams, and then the relative densities deter-mined. The data referent to a winter and a summer situation were also analyzed as well as a reduced data set considering the families with the higher total relative abundances. The main data patterns were analyzed by using the following ordi-nation techniques: Multidimensional Scaling with PRIMER software, version 5.2, and Correspondence Analysis with CANOCO software, version 4.5. No further transformation of the data was preformed, as the data were already trans-formed in ‘‘relative densities in percentage’’.
Some stations or groups of stations were considered for fur-ther analysis at species level: the data from the deepest stations of the Calvário data set (stations 40, 47 and 54) were assem-bled, but the stations representing the different sediment types were kept separate (stations 74-77). Stations from each sam-pling site of Gamito data set were also assembled. The results from previous analyses showed that the differences among the sites were much larger than the differences among the stations of each site (Gamito, 2006).
For these stations or groups of stations, the total species richness was determined. The average values of species rich-ness, density and Shannon-Wiener diversity and evenness were also determined. The results were presented with the deepest stations group in first place and the other stations or group of stations ordered by decreasing species richness. Dif-ferences in number of species due to different sampling effort
were avoided since the stations with low sampling effort were grouped and the total sampled area considered. Only stations where the sediment was sieved with 1-mm mesh were considered.
The relative abundance of the main trophic groups was also estimated for these stations or groups of stations and for three other stations or groups of stations. To assign the trophic group of each species a detailed literature research was carried out (see Appendix). When no information was obtained, the gen-era or even the family level was considered. The following tro-phic groups were considered e suspension feeders (plankton and detritus); deposit feeder (detritus and microphytobenthos); suspension/deposit feeders (species which have the two feed-ing modes dependfeed-ing on food availability) and herbivorous (macroalgae and macrophytes). The carnivorous, parasites, omnivorous and scavengers were grouped all together, follow-ing Valentine et al. (2002). In fact, most carnivores are also omnivores and scavengers, frequently being included in the same trophic group (see, for instance, Word, 1978 and Dauvin et al., 2007.
Finally, all species data from Calvário, Gamito and Sprung were aggregated, together with some Austen data set families, to give an overall idea of the species diversity of macrobenthic species from the Ria Formosa. All fish species were excluded from the data matrix, as well as some other taxonomic groups such as ostracods, since they were not captured with the appro-priate techniques. All species and families’ names were up dated according to Costello et al. (2004).
3. Results
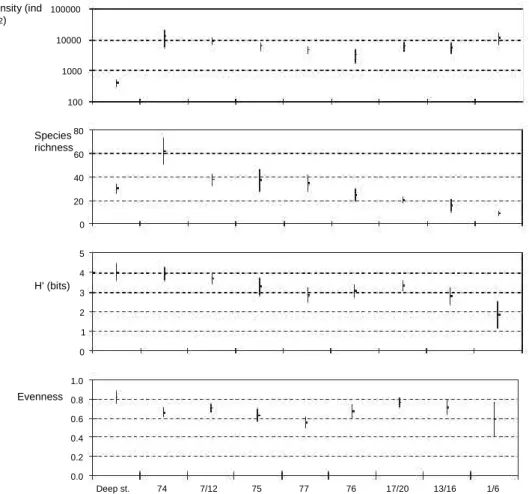
The total number of macrobenthic taxa reported to Ria For-mosa by Austen, Calvário, Gamito and Sprung was high - 328 taxa (Appendix). The total species richness was high in the deep channel stations of Calvario (94 species). However, the density was very low when compared to the other sites sam-pled, about 377 individuals m2as well as the average species
richness, but average diversity attains the highest value (S = 30; H’= 4.0; j =0.82) (Fig. 2). Species richness reaches its maximum in the Zostera bed (station 74), with 130 taxa. The lowest value was found in group stations 1/6, with only 22 taxa. However, the lowest richness must have occurred in station 30, where Austen et al. (personal communication) only found Tubificid oligochaetes and Talitrid amphipods, during the summer sampling and no individuals during the winter sampling. The highest densities were found by Calvário at the Zostera bed (station 74), with an average density of 12.7 x 10³
individ-uals m2and by Gamito at stations 1/6 with 11.4 x 10³
indi-viduals m2(Fig. 2). Although with comparable densities, all
the other indicators were different. The Zostera bed presented a higher average species richness and diversity (S = 62; H’= 3.9 bits; j = 0.66) while stations 1/6 presented a lower average species richness and diversity (S = 9; H’= 1.8 bits; j = 0.59).
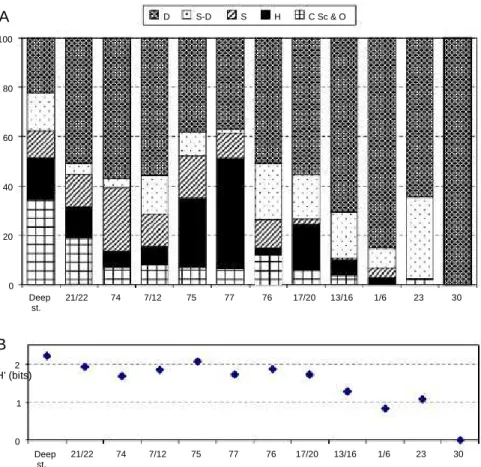
Although with low density of benthic organisms the deep channel stations presented a relative balance of the main feed-ing groups, with a high proportion of the carnivores/scavengers
group (Fig. 3A). The importance of the detritivores group in-creased towards the stations with macrophytes, dein-creased in the sandy and sandy mud stations and increased again in the more stressed locations, such as stations 1/6, exposed to high physical stress due to low water renewal rates and in the pol-luted stations, 23 and 30. At this last station, only detritivores were found, but at low densities (2 x10³individuals m2 dur-ing the summer sampldur-ing, no individuals durdur-ing the winter sampling). Feeding diversity decreases towards the stations or groups of stations dominated by detritivores (Fig. 3B). Although some taxonomic groups were not identified to the family level, such as Ascidea, Cnidaria, Echinoidea, Holothur-oidea, Insecta, Nemertina, Polyplacophora, Oligochaeta, Opis-tobranchia and Sipuncula, the compilation of all data resulted in a matrix of 118 different taxa, reflecting again the high diversity of benthic invertebrates in the Ria Formosa. The distribution of the stations in the MDS plot was not clear (not shown), and the stress value was high (0.18), indi-cating that no much reliance should be placed on this ordina-tion (Clarke, 1993). Nevertheless, staordina-tions from the seaside of the channel transects (Calvário sampling) are seen in the left side of the plot and stations from the physically stressed envi-ronment (Gamito - site A) and polluted envienvi-ronment (Austen et al. - transect C) are seen in the right side.
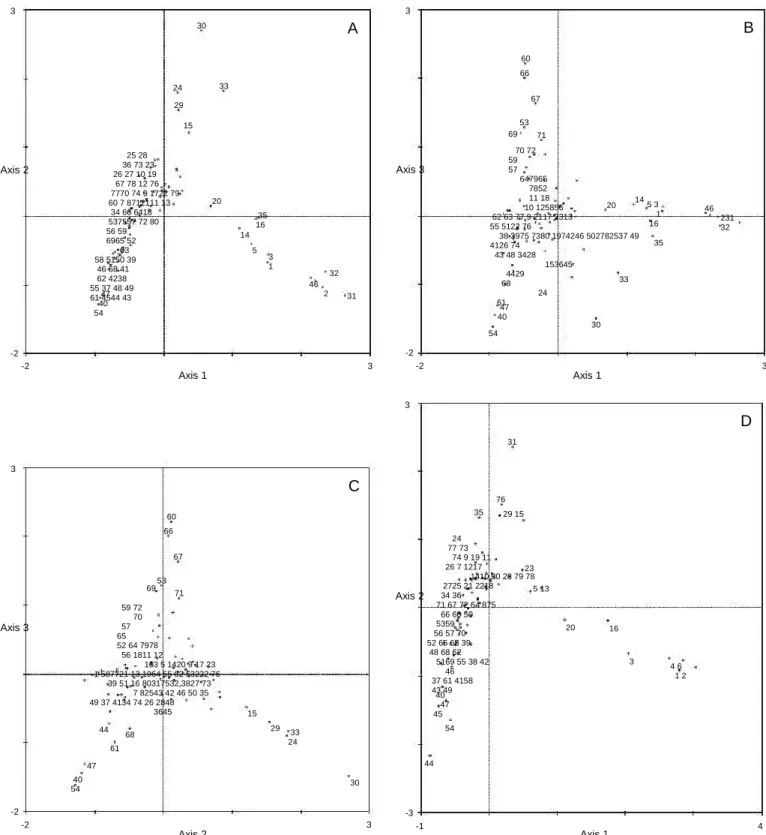
In the Correspondence Analysis plot (Fig. 4A) a clear separation between physically stressed and polluted stations is shown. Axis 1 apparently separates stations subjected to physical stress (right side of axis 1) from all other stations. Axis 2 separates stations from polluted sites (positive side of the axis) from all other stations. The negative side of both axes separates the deeper stations of the main Ria Formosa channel, the Faro channel.
A close look to what happens in axes 1 and 3 (Fig. 4B) al-lows distinguishing in the left side of axis 1 the separation of main channel transect stations along axis 3, the deeper stations and the intertidal stations of the first two Calvário transects in the negative side and the land side stations in the positive side of axis 3, denoting a third gradient e seaside stations sepa-rated from land side stations. Separation of pollution gradient from this last sea-land gradient is only possible by examining axes 2 and 3 (Fig. 4C).
MDS ordinations carried out with winter and summer data gave high stress values (0.23 and 0.21, respectively), and con-sequently the plots are not shown. With Correspondence Anal-ysis, the same general patterns as previously described are seen in axes 1 and 2 (Fig. 4D, E), and in axes 1 and 3, and in 2 and 3 (not shown). However, there were some small changes from the previous analysis with the global data matrix. Only stations 1-6 (Gamito sampling) are projected in the right side of axis 1, in the winter situation. Stations from transect C of Austen et al. had either any living invertebrate at time of sampling (stations 30, 32 and 33) or were projected near the positive side of axis 2. In summer, most of the stations of this transect C were projected near the right side of axis 1, close to stations of the physically stressed site A (stations 1-6), due to the high abundance of gastropods of the family Hydrobiidae. The sta-tions 15 and 20 were projected along the negative side of
Density (ind m-2) Species richness 100000 10000 1000 100 80 60 40 20 0 5 4 H' (bits) 3 2 1 0 1.0 Evenness 0.8 0.6 0.4 0.2 0.0 Deep st. 74 7/12 75 77 76 17/20 13/16 1/6
Fig. 2. Average and standard deviation of: density (individuals mÀ2); species richness; H0 e ShannoneWiener (bits) diversity index; j e evenness, observed in some groups of stations: Deep st - deep channel stations (stations 40, 47 and 54), the other codes are the same as in Fig. 1.
axis 2, related with the polluted gradient. In fact, these stations were previously related with an eutrophication gradient (Gamito, 1997, 2006). Station 29 also was projected in the same side.
The percentage of variance explained by the different anal-yses was low, less than 30% considering the first three axes, but the data sets are very large, with more than 100 families. This implies reducing the information of a multidimensional space of more than 100 dimensions into a space of three dimensions. Reducing the dimensionality, by selection of a subset of data with fewer families, reduces the multidimensional space and may increase the variance explained by the first three axes. In fact, using a subset of data with the 21 families with higher total relative abundance, which corresponds to more than 80% of the total information, produced similar plots and increased the variance explained by the three axes to 42.3%. Further-more, other important gradients are expected to exist, at higher dimensions, such as the tidal level or the sediment type. How-ever, the software used does not allow analyzing families’ and stations’ projections at higher dimensions.
The different mesh size sieves used by the teams do not seem to affect the multivariate analyses results. In fact, most of the Austin’s transect stations were projected near stations from other teams, except the more impacted ones. Also sta-tions from Gamito site E were not separated from the other stations with similar ecological characteristics. Perhaps at
higher dimensions, the mesh size might explain another gradi-ent. Correspondence Analyses performed only with Calvário, Gamito (without site E stations) and Sprung data gave similar results but with an inversion of the second and third gradients. In fact, none of the three teams worked with a ‘‘putative’’ pol-lution gradient. Gamito (2006) identified an eutrophication gradient, due to a deterioration of water quality, during the second year of sampling, in some stations of sites C and D. In the results from the analyses with all the data, these stations were projected in the same direction of the more impacted stations of the pollution gradient. Without this ‘‘putative’’ gra-dient the pollution/eutrophication gragra-dient was the third in importance, being the physical stress the most important, fol-lowed by the land-ocean gradient.
The families Hydrobiidae (gastropods), Capitellidae (poly-chaetes) and Semelidae (bivalves) were the most abundant families in all stations, representing almost 42% of all individ-uals sampled. The family Hydrobiidae was present only in 38 of the 80 stations, but when it was present it could reach high densities, the highest (13.4 x 10³individuals m2) was found
in station 4. The family Capitellidae (4 species, see Appendix) was present in almost all stations (78 out of 80). The family Semelidae (5 species) was present in 67 of the 80 stations. These last two families were projected near the origin of the axes, meaning that they represent the Ria Formosa but no specific gradient (Fig. 5).
A
100 D S-D S H C Sc & O 80 60 40 20 0 Deep st. 21/22 74 7/12 75 77 76 17/20 13/16 1/6 23 30B
H' (bits) 2 1 0 Deep st. 21/22 74 7/12 75 77 76 17/20 13/16 1/6 23 30Fig. 3. (A): Main feeding groups in each of the group of stations considered in Fig. 2 and also in site E stations 21/22 (Gamito data set) and stations A0 and C0 stations 23 and 30 (Austin et al. data set). D deposit feeders; SD suspension/deposit feeders; S suspension feeders; H herbivorous; C, Sc and O -carnivorous, scavengers and omnivorous; (B): feeding diversity in the various stations or groups of stations considered.
The Hydrobiidae, together with Insecta (mostly Chironomus sp. larvae), were projected near the positive side of axis 1, as-sociated with the physical stressed gradient. Asas-sociated with the polluted section were the Oligochaeta, several amphipod families (Ampithoidae, Haustoriidae and Talitridae) and the isopod family Cirolanidae. The Cirolanidae and Haustoriidae were only reported by Austen et al. (personal communication). Present in more than 50 stations out of 80 were the bivalves Cardiidae and Veneridae, the gastropods Cerithiidae and Nas-sariidae, the polychaetes Glyceridae, Nereididae, Nephtyidae and Spionidae, the amphipods Aoridae and Corophiidae and the Phylum Phoronida. These families, together with the fam-ilies Capitellidae and Semelidae, represent the dominant inver-tebrate benthic fauna of Ria Formosa.
4. Discussion
The total number of macrobenthic species reported to Ria Formosa by Calvario, Gamito and Sprung was high - 328 taxa (Appendix), comparable to the vast Italian lagoon of Ven-ice, with 356 macroinvertebrate taxa (Sabetta et al., 2007). The same authors reported to Grado Marano and Valli di Cornac-chio, lagoons comparable in size to Ria Formosa, only 154 and 183 taxa, respectively. Bazairi et al. (2005) reported 147 taxa to a smaller Moroccan lagoon. In some Greek brackish-water lagoons the maximum number of invertebrate taxa was
84 (Reizopoulou and Nicolaidou, 2004), and in southern France the total number of zoobenthos in the less eutrophicated lagoon was only 24 (Mouillot et al. (2005). In Portugal, taxa richness was 268 in Santo André lagoon (da Fonseca et al., 1989) and 119 in Óbidos lagoon (Quintino et al., 1989). Most of the taxa found in the Ria Formosa are characteristic of the Abra communities of estuaries and other sheltered re-gions (Thorson, 1957) or of the ‘‘biocenose lagunaire euryha-line and eurytherme’’ (Pérès and Picard, 1964). The dominant fauna consists of the bivalves Abra segmentum, Cerastoderma spp. and Loripes lacteus, the gastropods Bittium reticulatum and Cerithium vulgatum, the polychaetes Hediste diversicolor, Heteromastus filiformis and Streblospio spp., the crustaceans Apseudes latreillii, Corophium spp. and Microdeutopus spp., also common in Italian (Tagliapietra et al., 2000; Basset et al., 2006), French (Amanieu et al., 1978-1979) and in other Portuguese lagoons (Quintino and Rodrigues, 1989).
In the areas with low water renewal the bivalve Loripes lac-teus is not present and the gastropod Hydrobia spp., the Chi-ronomus insect larvae and the polychaete Capitella capitata dominate. In the more polluted areas all the faunas disappear, or only is represented by Oligochaetes and some amphipod families.
In the Ria Formosa several benthic habitats may be de-scribed: the tidal channels, the seagrass beds, the sandbanks and the mudflats.
3 3 30
A
60 66 33 67 53 69 71 70 72 59 57 647965 7852 11 18 10 125856 62 63 77 9 2117 2313 55 5122 76 38 3975 7380 1974246 502782537 49 4126 74 43 48 3428 153645 4429 68 24 61 47 40 54B
24 29 15 25 28 36 73 23 26 27 10 19 67 78 12 76 7770 74 9 1722 79 60 7 8712111 13 34 66 6418 537557 72 80 56 59 6965 52 63 58 5150 39 46 68 41 62 4238 55 37 48 49 61 4544 43 47 40 54 Axis 2 Axis 3 20 35 16 5 3 1 46 2 20 145 3 1 16 35 46 14 231 32 32 31 33 30 -2 -2 -2 Axis 1 3 -2 Axis 1 3 3D
31 3C
60 66 67 6953 35 76 29 15 59 72 70 57 65 52 64 7978 56 1811 12 103 5 1420 9 17 23 1 587721 13 1964 55 62 63222 76 39 51 16 80317532 3827 73 7 82543 42 46 50 35 49 37 4134 74 26 2848 3645 44 61 47 40 54 68 Axis 3 Axis 2 71 24 77 73 74 9 19 11 26 7 1217 1410 80 28 79 78 2725 21 2218 34 36 71 67 72 64 875 66 60 50 5359 56 57 70 52 65 63 39 48 68 62 5169 55 38 42 46 37 61 4158 43 49 40 47 45 23 5 13 20 16 3 4 6 1 2 15 29 33 24 54 44 30 -2 -2 Axis 2 3 -3 -1 Axis 1 4Fig. 4. (A): Correspondence Analysis carried out with 118 families and 80 stations. Projection of the stations in axes 1 and 2. Percentage variance accounted for by axes: I = 12.3%; I + II = 21.4%; I + II + III =29.4%. Station codes the same as in Fig. 1; (B): projection of the stations in axes 1 and 3; (C): projection of the stations in axes 2 and 3; (D): Correspondence Analysis carried out with 100 families and 77 stations e winter situation. Percentage variance accounted for by axes: I =10.0%; I + II = 17.9%; I + II + III = 25.1%; (E): Correspondence Analysis carried out with 103 families and 80 stations - summer situation. Percentage var-iance accounted for by axes: I = 9.8%; I + II = 17.6%; I + II + III = 24.6%.
A low density fauna can be found in the main tidal channel. This channel may be impacted due to the regular dredging to keep navigation possible and to feed the sand beaches from the ocean side of Ria Formosa, causing a low average density of macrofauna, but globally with a high diversity. The constant
reworking of the sediment due to dredging may have released empty niches ready to be occupied by different species. The relative trophic balance found in this location may be artificial due to the instable sediment reflected in the variable commu-nities found during the different sampling occasions.
3 55
E
54 40 47 37 49 48 43 62 61 45 41 39 44 38 68 46 50 51 5842 65 7556 805211 53 59 57 63 69 9 66 74 7 64 2070 34 77 8 21 10 71 17 18 13 14 7960 72 67 78 22 12 76 27 2326 73 36 28 25 19 29 15 33 16 5 35 1 3 2 6 32 4 31 Axis 2 24 30 -1 Axis 1 Fig. 4 (continued). 3In the seagrass beds the trophic food web is dominated by detritivores, due to the large amounts of debris and organic matter that tend to accumulate as a consequence of a decrease in water circulation, but the other trophic groups were also well represented and the species richness attains its highest values. In the sandbanks the species richness is lower. The diversity decreases again towards the muddy sediments. In stressed zones, species richness decreases even more, and the benthic community may be dominated by a few and small group of resistant species, almost all detritivores.
The seagrasses, mainly Zostera noltii, may be considered as a keystone habitat-structuring seagrass species on intertidal mudflats (Hily and Bouteille, 1999; Diekmann et al., 2005). In fact, it was beneath this habitat where the highest species richness was found. Seagrass can contribute to the food web either directly through grazing on seagrass leaves or indirectly through grazing on the attached epiphytic algae (Heck and Valentine, 2006 and references therein). However, the food web is generally considered to be detrital-based (Cebrian et al., 1997; Vizzini et al., 2002). Sprung (1994) suggests that primary production within Ria Formosa is dominated by macrophytes and macroalgae, whilst planktonic production is mainly imported into the lagoon by tidal exchange. The sea-grass detritus, together with salt marsh plant detritus, feeds the
Fig. 5. Correspondence Analysis carried out with 118 families and 80 stations. Projection of the families and stations in axes 1 and 2 (To be analyzes together with Fig. 4A). Percentage variance accounted for by axes: I = 12.3%; I + II = 21.4%; I + II + III = 29.4%. Group A - families 2, 7, 11, 20, 35, 45, 51, 56, 83, 88, 98, 106 and 105; group B - families 5, 9, 13, 14, 16, 21, 22, 24, 31, 33, 34, 36, 40, 43, 44, 47, 49, 53, 55, 64, 65, 72, 79, 87, 95, 96, 100, 112, 114 and 115; group C - families 1, 8, 15, 39, 54, 58, 59, 63, 66, 68, 70, 73, 80, 84, 86, 91, 93, 103, 108, 116 and 118; group D e families 4, 10, 12, 17, 18, 23, 27, 28, 32, 41, 50, 52, 57, 60, 61, 62, 67, 69, 71, 74, 75, 77, 78, 81, 82, 85, 90, 92, 97, 101, 102, 104, 107, 110, 111, 113 and 117; group E - families 26, 29, 30, 89 and 94. Families’ codes: 1, Ampeliscidae; 2, Ampharetidae; 3, Ampithoidae; 4, Anomiidae; 5, Anthuridae; 6, Aoridae; 7, Aphroditidae; 8, Apseudidae; 9, Arcturidae; 10, ASCIDIA; 11, Callianassidae; 12, Calyptraeidae; 13, Capitellidae; 14, Caprellidae; 15, Cardiidae; 16, Ceri-thiidae; 17, Chaetopteridae; 18, CHORDATA; 19, Cirolanidae; 20, Cirratuli-dae; 21, CNIDARIA; 22, ConiCirratuli-dae; 23, CorbuliCirratuli-dae; 24, CorophiiCirratuli-dae; 25, Cossuridae; 26, Cymothoidae; 27, Dexaminidae; 28, Diogenidae; 29, Donaci-dae; 30, DorippiDonaci-dae; 31, DorvilleiDonaci-dae; 32, ECHINOIDEA; 33, EpitoniiDonaci-dae; 34, Eunicidae; 35, Eusiridae; 36, Fasciolariidae; 37, Flabelligeridae; 38, Gammar-idae; 39, GlycerGammar-idae; 40, GnathiGammar-idae; 41, GoniadGammar-idae; 42, HaustoriGammar-idae; 43, Hesionidae; 44, Holognathidae; 45, Holothuroidea; 46, Hydrobiidae; 47, Ido-teidae; 48, INSECTA; 49, Iphimediidae; 50, Isaeidae; 51, Ischyroceridae; 52, Janiridae; 53, Kelliidae; 54, Lasaeidae; 55, Leptocheliidae; 56, Leptostraca; 57, Leucothoidae; 58, Lucinidae; 59, Lumbrineridae; 60, Lysianassidae; 61, Mactridae; 62, Magelonidae; 63, Maldanidae; 64, Melitidae; 65, Montacuti-dae; 66, MuriciMontacuti-dae; 67, MytiliMontacuti-dae; 68, NassariiMontacuti-dae; 69, NaticiMontacuti-dae; 70, NEM-ERTINA; 71, Nephtyidae; 72, Nereididae; 73, Nuculidae; 74, Oedicerotidae; 75, OFIURIDEO; 76, OLIGOCHAETA; 77, Onuphidae; 78, Opheliidae; 79, OPISTOBRANCHIA; 80, Orbiniidae; 81, Oweniidae; 82, Paguridae; 83, Paraonidae; 84, Pectinariidae; 85, Pholadidae; 86, PHORONIDA; 87, Phyllo-docidae; 88, Pilumnidae; 89, Pisionidae; 90, Polynoidae; 91, POLYPLACO PHORA; 92, Pontoporeiidae; 93, Portunidae; 94, Psammobiidae; 95, Pyra-midellidae; 96, Rissoidae; 97, Sabellariidae; 98, Sabellidae; 99, Semelidae; 100, Serpulidae; 101, Sigalionidae; 102, SIPUNCULA; 103, Solenidae; 104, Sphaeromatidae; 105, Spionidae; 106, Spirorbidae; 107, Stenothoidae; 108, Syllidae; 109, Talitridae; 110, Tanaidae; 111, Tellinidae; 112, Terebellidae; 113, Thraciidae; 114, Trochidae; 115, Turritellidae; 116, Upogebiidae; 117, Urothoidae; 118, Veneridae.
adjacent areas, such as the sand and mudflats and the tidal channels. It is also exported to the ocean, with the tides. However, seagrass habitat is degrading worldwide due to anthropogenic disturbances, such as mechanical damage (by dredging, fishing and anchoring), eutrophication, aquaculture development, coastal construction and climate change (Duarte, 2002). In the Ria Formosa, another important factor for seagrass loss is clam culture. The clam-beds are prepared by destroying the intertidal Zostera noltii meadows and covering the natural sediment with coarser terrestrial sediment (Duarte et al., 2004). Furthermore, natural muddy areas are disturbed due to the systematic collection of benthic organism such as mollusks, polychaetes and sipunculids, as bait for recreational fishing. Sandy areas used for clam farming are also periodi-cally reworked by fishermen to collect clams and to promote oxygenation of deeper sediment layers (Falcão et al., 2006).a In fact, Austen et al. (1989) concluded that macrobenthos in winter appeared to respond to sewage enrichment only in the immediate vicinity of the sewage outfalls, but that ABC plots indicated that macrobenthic communities were moderately stressed throughout the area in summer, possible due to human sediment digging for shellfish.
When the environmental conditions deteriorates there is a de-crease of species richness, the food web becomes dominated by detritivores and the density of organisms may increase, in a first step, as was described by Pearson and Rosenberg (1978) for organically polluted sites, due to the development, in a low competitive environment, of fast growing small opportunistic species. If the environment deteriorates even more all organ-isms may die. In fact, Austen et al. (personal communication) hardly found any organism in the more sewage-impacted area of Ria Formosa. The same pattern of decreasing species diver-sity and increasing abundance of small opportunistic species was observed in the physically stressed stations, the local with low water renewal e site A (Gamito, 1997, 2006), due to extreme environmental conditions essentially revealed by large salinity variation.
In a recent work on two semi-intensive fish aquaculture reservoirs in the Ria Formosa with high organic matter loads, Carvalho et al. (2006) also found low ShannoneWiener diver-sity values, with most values varying between 1 and 2 bits. Dominant macroinvertebrate species composition was similar to the dominant fauna of site A. Apparently, it is hard to differ-entiate typical organisms characteristic of organic pollution from organisms indicators of physical natural stress. Most of them are considered opportunistic species, of low individual biomass but high grow rates and poor competitors, the so-called r-strategists (Pianka, 1970).
In the last years, some attempts were made in order to clas-sify the ecological status of the Ria Formosa, but based only on water quality and macroalgae growth. Nobre et al. (2005) assessed the Ria Formosa eutrophication status as ‘‘good’’, on the Water Framework Directive scale (high, good, moder-ate, poor and bad). They concluded that the Ria Formosa has a short water residence time and eutrophication symptoms are not apparent in the water column. However, there are some eutrophication symptoms such as excessive episodic growth of
macroalgae and strong dissolved oxygen fluctuations in tidal pools. Newton et al. (2003) classified the trophic state of the Ria Formosa based on nutrients data in the water column and in the sediment together with chlorophyll a and oxygen saturation in the water column. Ria Formosa was classified ei-ther in a poor to bad state or in a near pristine state, depending on the assessment method used.
Although no specific methodology was applied to define the ecological status of Ria Formosa based on benthic macro-fauna, the high species richness and high diversity values observed in most of the stations or groups of stations point out to an elevated ecological status, with the exception of the more sewage-impacted areas and the physically stressed locals. In the delimitation of monitoring stations special care must be taken due to the spatial variability reflected in the dif-ferent habitats. Also the regular dredging of the main tidal channels may affect the monitoring results.
It was possible to define three main stressors acting in Ria Formosa. Apparently, the most important is the physical stress imposed by low water renewal in some locations of Ria For-mosa, detected previously by Gamito (1997, 2006). The second one is the pollution effect of sewage outfalls, limited to the vicinity of the outfall stations, due to the low residence time of water, as previously described by Austen et al. (1989) and Hubert et al. (2006), but also related to eutrophication accom-panied by a degradation of water quality in places of relatively restricted water circulation with high primary production (Gamito, 1997, 2006). The third one and apparently less impor-tant, due to the high water exchange rates of Ria Formosa, is the landeocean gradient, denoting the influence of seawater exchanges and emersion time.
Recently, Elliott and Quintino (2007) suggested that estua-rine faunal and floral community is adapted to and reflects high spatial and temporal variability in naturally highly stressed areas, but that their features are similar to those found in anthropogenically stressed areas. This makes it difficult to differentiate between the two stressors, the natural and the in-duced. Coastal lagoons are also considered naturally stressed environments but in the present study it was possible to differ-entiate the anthropogenic stress from the natural physical stress through the application of multivariate analysis. However, both structural (species richness and diversity indices) and functional indicators (trophic composition) indicate the same trend e low species richness, low diversity indices and a community domi-nated by small opportunistic detritivores species.
Acknowledgments
Special thanks are due to Dr. Alice Newton, for text revision and constructive comments. Dr. Donald S. McLusky and an anonymous referee greatly improved the manuscript.
Appendix. Supplementary data
Supplementary data associated with this article can be found, in the online version, at doi:10.1016/j.ecss.2007.11.013.
References
Alongi, D.M., 1998. Coastal Ecosystem Processes. CRC Press, Boca Raton, 419 pp.
Amanieu, M., Guelorget, O., Michel, P., 1978-1979. Évolution structurale de peuplements de la macrofaune benthique des étangs palavasiens. Vie et Milieu 28-29, 531-547.
Andrade, C., Freitas, M.C., Moreno, J., Craveiro, S.C., 2004. Stratigraphical evidence of Late Holocene barrier breaching and extreme storms in lagoonal sediments of Ria Formosa, Algarve, Portugal. Marine Geology 210, 339-362.
Austen, M.C., Warwick, R.M., Rosado, M.C., 1989. Meiobenthic and benthic community structure along a putative pollution gradient in ern Portugal. Marine Pollution Bulletin 20, 398-405.
Basset, A., Galuppo, N., Sabetta, L., 2006. Environmental heterogeneity and benthic macroinvertebrate guilds in Italian lagoons. Transitional Waters Bulletin 1, 48-63.
Bazairi, H., Bayed, A., Hily, C., 2005. Structure et bioevaluation de l’état écologique des communautes benthiques d’un écosystème lagunaire de la cote atlantique marocaine. Comptes Rendus Biologies 328, 977-990. Carvalho, S., Barata, M., Pereira, F., Gaspar, M.B., da Fonseca, L.C., Ferreira, P., 2006. Distribution patterns of macrobenthic species in relation to organic enrichment within aquaculture earthen ponds. Marine Pollution Bulletin 52, 1573-1584.
´Cebrian, J., Duarte, C.M., Marba, N., Enriquez, S., 1997. Magnitude and fate of the production of four co-occurring western Mediterranean seagrass species. Marine Ecology Progress Series 155, 29-44.
Clark, J.R., 1998. Coastal Seas. The Conservation Challenge. Blackwell Science, Oxford, 134 pp.
Clarke, K.R., 1993. Non-parametric multivariate analyses of changes in community structure. Australian Journal of Ecology 18, 117-143. Costello, M.J., Bouchet, P., Boxshall, G., Emblow, C., Vanden Berghe, E., 2004. European Register of Marine Species. Available from: http://www. marbef.org/data/erms.php.
Dauvin, J.C., 2007. Paradox of estuarine quality: benthic indicators and indices, consensus or debate for the future. Marine Pollution Bulletin 55, 271-281. Dauvin, J.C., Ruellet, T., Desroy, N., Janson, A.-L., 2007. The ecological ity status of the bay of Seine and Seine estuary: use of biotic indices. Marine Pollution Bulletin 55, 241-257.
Diekmann, O.E., Coyer, J.A., Ferreira, J., Olsen, J.L., Stam, W.T., Pearson, G.A., Serr~o, E.A., 2005. Population genetics of Zostera noltii along the west Ibe-a rian coast: consequences of small population size, habitat discontinuity and near-shore currents. Marine Ecology Progress Series 290, 89-96. Duarte, C.M., 2002. The future of seagrass meadows. Environmental vation 29, 192-206.
Duarte, C.M., Marbá, N., Santos, R., 2004. What may cause loss of seagrasses? In: Borum, J., Duarte, C.M., Krause-Jensen, D., Greve, T.M. (Eds.),
European Seagrasses: an Introduction to Monitoring and Management. The Monitoring and Managing of European Seagrass project, ISBN 87-89143-21-3, pp. 24-32. Available from: http://www.seagrass.org. Elliott, M., 2002. The role of the DPSIR approach and conceptual models in marine environmental management: an example for offshore wind power. Marine Pollution Bulletin 44, iii-vii.
Elliott, M., Quintino, V., 2007. The estuarine quality paradox, environmental homeostasis and the difficulty of detecting anthropogenic stress in rally stressed areas. Marine Pollution Bulletin 54, 640-645.
da Fonseca, L.C., Costa, A.M., Bernardo, J.M., 1989. Seasonal variation of benthic and fish communities in shallow land-locked coastal lagoon (St. André, SW Portugal). Scientia Marina 53, 663-669.
Falcão, M., Caetano, M., Serpa, D., Gaspar, M., Vale, C., 2006. Effects of in-a fauna harvesting on tidal flats of a coastal lagoon (Ria Formosa, Portugal): implications on phosphorus dynamics. Marine Environmental Research 61, 136-148.
Gamito, S., 1997. Application of canonical correspondence analysis to ronmental and benthic macrofauna data of four sites in the Ria Formosa (Portugal). Publicaciones Especiales Instituto Español de Oceanografia 23, 41-52.
Gamito, S., 2006. Benthic ecology of semi-natural coastal lagoons, in the Ria Formosa (Southern Portugal), exposed to different water renewal regimes. Hydrobiologia 555, 75-87.
Gamito, S., Rafaelli, D., 1992. The sensitivity of several ordination methods to sample replication in benthic surveys. Journal of Experimental Marine Biology and Ecology 164, 221-232.
Gamito, S., Gilabert, J., Marcos, C., Pérez-Ruzafa, A., 2005. Effects of changing environmental conditions on lagoon ecology. In: Gönenç, I.E., Wofflin, J. (Eds.), Coastal Lagoons. Ecosystem Processes and Modeling for Sustainable Use and Development. CRC Press, Boca Raton, pp. 193-229.
Guelorget, O., Perthuisot, J.P., 1984. Indicateurs biologiques et diagnose écologique dans le domaine paralique. Bulletin d’Ecologie 15, 67-76. Heck Jr., K.L., Valentine, J.F., 2006. Planteherbivore interactions in seagrass meadows. Journal of Experimental Marine Biology and Ecology 330, 420-436. Hily, C., Bouteille, M., 1999. Modifications of the specific diversity and feeding guilds in an intertidal sediment colonized by an eelgrass meadow (Zostera marina) (Brittany, France). Comptes Rendus de l’Academie des Sciences - Serie III, 322, 1121-1131.
Hubert, F., Pellaud, M., Gamito, S., 2006. Environmental effects of marine fish pond culture in the Ria Formosa (Southern Portugal). Hydrobiologia 555, 289-297.
Mouillot, D., Laune, J., Tomasini, J.-A., Aliaume, C., Brehmer, P., Dutrieux, E., Do Chi, T., 2005. Assessment of coastal lagoon quality with taxonomic diversity indices of fish, zoobenthos and macrophyte communities. Hydrobiologia 550, 121-130.
Newton, A., Mudge, S.M., 2003. Temperature and salinity regimes in a low, mesotidal lagoon, the Ria Formosa, Portugal. Estuarine, Coastal and Shelf Science 56, 1-13.
Newton, A., Icely, J.D., Falcão, M., Nobre, A., Nunes, J.P., Ferreira, J.G.,a Vale, C., 2003. Evaluation of eutrophication in the Ria Formosa coastal lagoon, Portugal. Continental Shelf Research 23, 1945-1961. Nobre, A.M., Ferreira, J.G., Newton, A., Simas, T., Icely, J.D., Neves, R., 2005. Management of coastal eutrophication: integration of field data, system-scale simulations and screening models. Journal of Marine Systems 56, 375-390.
Pearson, T.H., Rosenberg, R., 1978. Macrobenthic succession in relation to ganic enrichment and pollution of the marine environment. Oceanography Marine Biology: An Annual Review 16, 229-311.
Pérès, J.-M., Picard, J., 1964. Nouveau manuel de bionomie benthique de la Mer Mediterranee. Recueil des Travaux de la Station Marine d’Endoume 31, 1-137.
Pianka, E.R., 1970. On r and K selection. American Naturalist 104, 592-597. Quintino, V., Rodrigues, A.M., 1989. Environmental gradients and distribution of macrozoobenthos in three Portuguese coastal systems: Óbidos, Albufeira and Alvor. In: Ryland, J.S., Tyler, P.A. (Eds.), Reproduction, Genetics and Distribution of Marine Organisms, pp. 441-450. Fredensborg, Denmark. Quintino, V., Rodrigues, A.M., Gentil, F., 1989. Assessment of macrobenthic communities in the lagoon of Obidos, western coast of Portugal. Scientia Marina 53, 645-654.
Reizopoulou, S., Nicolaidou, A., 2004. Benthic diversity of coastal water lagoons in western Greece. Aquatic Conservation: Marine and Freshwater Ecosystems 14, S93-S102.
Sabetta, L., Barbone, E., Giardino, A., Galuppo, N., Basset, A., 2007. Speciesearea patterns of benthic macro-invertebrates in Italian lagoons. Hydrobiologia 577, 1573-5117.
Saraiva, S., Pina, P., Martins, F., Santos, M., Braunschweig, F., Neves, N., 2007. Modelling the influence of nutrient loads on Portuguese estuaries. Hydrobiologia 587, 5-18.
Sprung, M., 1994. Macrobenthic secondary production in the intertidal zone of the Ria Formosa e a lagoon in Southern Portugal. Estuarine, Coastal and Shelf Science 38, 539-558.
Tagliapietra, D., Pavan, M., Wagner, C., 2000. Benthic patterns in a salt marsh basin: a snapshot of Palude della Rosa (Venetian lagoon, Italy). Wetlands Ecology and Management 8, 287-292.
Tett, P., Gilpin, L., Svendsen, H., Erlandsson, C.P., Larsson, U., Kratzer, S., Fouilland, E., Janzen, C., Lee, J.-Y., Grenz, C., Newton, A., Ferreira, J.G., Fernandes, T., Scory, S., 2003. Eutrophication and some European waters of restricted change. Continental Shelf Research 23, 1635-1671.
secondary consumers as revealed by carbon and nitrogen stable isotope analysis. Acta Oecologica 23, 277-285.
Warwick, R.M., Platt, H.M., Clarke, K.R., Agard, J., Gobin, J., 1990. Analysis of macrobenthic and meiobenthic community structure in relation to pollution and disturbance in Hamilton Harbour, Bermuda. Journal of Experimental Marine Biology and Ecology 138, 119-142.
Word, J., 1978. In: Bascom, W. (Ed.), The infaunal trophic index, pp. 19-39. Southern California Coastal Water Research Project.
Thorson, G., 1957. Bottom communities (sublittoral or shallow shelf). In: Hedgpeth, J.W. (Ed.), Treatise on Marine Ecology and Paleocology I Ecology. Geological Society of America, New York, pp. 461-534. Valentine, J.W., Roy, K., Jablonski, D., 2002. Carnivore/non-carnivore ratios in northeastern Pacific marine gastropods. Marine Ecology Progress Series 228, 153-163.
Vizzini, S., Sara, G., Michener, R.H., Mazzola, A., 2002. The role and bution of the seagrass Posidonia oceanica (L.) Delile organic matter for