1. Department of Internal Medicine, Medical University-Sofia, Bulgaria, Clinic of Rheumatology
2. Department of Medical Chemistry and Biochemistry, Medical University-Sofia, Bulgaria, Molecular Medicine Center 3. IQVIA, Bulgaria
4. Medical University-Sofia, Bulgaria, University Hospital Prof. Ivan Mitev
Conclusions: Our data showed that the expression le
-vels of miR-146a and miR-155 in PB could be used as diagnostic biomarkers for SLE patients but larger study is needed to confirm these results.
Keywords: Systemic lupus erythematosus; miRNA
ex-pression; Peripheral blood; Biomarker;
IntroductIon
Systemic lupus erythematosus (SLE) is a complex au-toimmune disease characterized by autoantibody pro-duction, complement activation and deposition of im-mune complexes in tissues and organs1,2. T cells play a crucial role in the pathogenicity of SLE through stim-ulating the autoantibody producing B cells3. Alterations in the phenotype and functional activity of T cells and T cells subtypes lead to their failure to suppress au-toreactive lymphocytes, the proinflammatory milieu and thus to lupus-related inflammation4-6.
Although the pathogenesis of SLE is still unknown recent studies reveal the biological and clinical rele-vance of epigenetic changes related to the development of SLE including alterations in deoxyribonucleic acid (DNA) methylation, histone modification and micro-ri-bonucleic acid (microRNA, miRNA) expression7-11. miRNAs are endogenous short noncoding RNA molecules that negatively regulate the gene expression on posttranscriptional level by targeting the messenger RNAs (mRNAs). In SLE miRNAs control the differen-tiation and immunological functions of B cells, induc-tion pathways in T cells, activainduc-tion, funcinduc-tion and main-tenance of regulatory T-cells (Tregs)12-19. miRNAs target several interferon (IFN) signaling mediators and IFN--inducible genes in lupus derived peripheral blood monocytes (PBMC) as well as molecules related to T cell hyperactivity and abnormality20.
miRNAs as well as molecules involved in their biogen-esis has been linked to the levels of autoantibody in
Whole peripheral blood miR-146a and miR-155 expression
levels in systemic lupus erythematosus patients
Shumnalieva R1, Kachakova D2, Shoumnalieva-Ivanova V3, Miteva P4, Kaneva R2, Monov S1
ACTA REUMATOL PORT. 2018;43:217-225
AbstrAct
Objective: To evaluate the diagnostic value of periphe
-ral blood microribonucleic acid (miRNA, miR)-146a and miR-155 expression in systemic lupus erythe-matosus (SLE).
Methods: Expression levels of miR-155 and miR-146a
in whole peripheral blood samples from 40 SLE pa-tients and 32 healthy controls (HCs) were determined by quantitative reverse transcription-polymerase chain reaction qRT-PCR (SYBR Green technolo gy) and 2-DDCtmethod was used for analysis. SPSS v20 was used for receiver operating characteristic (ROC) curve and Spearman correlation analysis.
Results: Whole peripheral blood expression levels of
miR-146a and miR-155 were overexpressed in 62.5% and 50%, respectively, of the SLE patients compared to HCs. The ROC curve analysis showed that the expres-sion levels of miR-146a could discriminate SLE patients from HCs with area under the curve (AUC)=0.711 (95% CI: 0.585÷0.837, p=0.002, with 82.5% sensitivi -ty and 56.2% specifici-ty. The diagnostic accuracy of miR-155 was lower with AUC=0.691 (95% CI: 0.566÷0.817, p=0.005, with 77.5% sensitivity and 50.0% specificity. The diagnostic accuracy did improve when combination of the studied miRNAs was used in multimarker ROC curve analysis (AUC=0.716, 95% CI: 0.590÷0.842, p=0.002, 82.5% sensitivity and 56.2% specificity). miR-146a and miR-155 showed correlation with the diagnosis (rs=0.363 and 0.330, res -pectively) and the age of the patients (rs =0.239 and 0.366, respectively), and miR-155 showed correlation with the presence of secondary Raynaud syndrome (Spearman correlation coefficient=0.250).
SLE. Interestingly, anti-Su autoantibodies patients with SLE could recognize the catalytic enzyme in miRNA pathways thus indicating a possible relation-ship between miRNA and the pathogenesis of SLE21.
Two of the most studied miRNAs in autoimmune rheumatic diseases including SLE are miR-146a and miR-155. It has been found that the altered expression of miR146a in lupus PBMCs correlates with the acti -vity of SLE and IFN scores. On molecular level miR-146a targets the signal transducer and activator of trans cription (STAT) 1 and interferon regulatory factor (IRF) 5 and thus negatively regulates the IFN signal-ing pathway20,22. In lupus macrophages miR-146a also modulates the production of type I IFN by targeting tu-mor necrosis factor (TNF) receptor-associated factor (TRAF)-6, interleukin-1 receptor-associated kinase (IRAK)-1, and IRAK2 in the retinoic acid-inducible gene (RIG)-I-dependent type I IFN production path-way23. miR-155 has been found to be overexpressed in lupus Tregs24. miR-155 has a contrary regulatory function in SLE - it could inhibit inflammatory re-sponse by targeting the myeloid differentiation prima-ry response gene 88 (MYD88) and the adapter molecule TAB2 but also promotes inflammatory re-sponse and type I interferon signaling by targeting the suppressor of cytokine signaling (SOCS)-1 in macrophage. miR-155* has an opposite effect on the regulation of type I interferon production compared to that of miR-155 in plasmacytoid dendritic cells (pDCs) and both forms cooperatively regulate the pro-duction of type I IFN by human plasma cells25,26. Al-tered miR-155 expression has been described also in SLE B cells. Overexpression of miR-155 in SLE B cells contributes to enhance B cell survival and higher titer of IgG autoantibodies by downregulation of SH2 do-main containing inositol-5--phosphatase (SHIP)-1 protein27-29.
The aim of our study was to evaluate the diagnostic value of whole peripheral blood (PB) miR-146a and miR-155 expression levels in SLE patients. This is the first study to demonstrate the expression pattern of these two miRNAs in whole PB samples of SLE.
mAterIAl And methods
PrePArAtIon of PerIPherAl blood sAmPles Ethical approval for this study was granted by the ethics committee of the Medical University – Sofia. In-formed consent was obtained from 72 participants
from European ancestry (40 SLE patients and 32 healthy controls (HCs), Table I). According to the ethics committee, HCs were over 18 years of age, with not known rheumatic conditions. SLE was diagnosed accor ding to the 1997 update of the 1982 American College of Rheumatology revised criteria for classifi-cation of SLE30. PB samples were collected in PAXgene RNA tubes and stored at -80°C prior isolation. All sam-ples were thawed only one time.
rnA IsolAtIon, cdnA synthesIs And reAl-tIme Pcr
Total RNA from the PB samples was extracted with PAXgene Blood miRNA kit. The concentrations and quality of RNA samples were evaluated spectrophoto-metric by NanoDrop. Equal concentrations of RNA samples were used in reverse transcription reactions for synthesis of complementary DNA (cDNA) with miScript II RT kit (Qiagen®). Before use, every cDNA was diluted as recommended. Quantitative real-time polymerase chain reaction (PCR) was done on the Applied Biosystems 7900HT Fast Real-Time PCR Sys-tem with miScript SYBR Green PCR kit and miScript Primer Assays (Qiagen®). RNU6B was used as refe -rence control for normalization as described before31. Relative changes of gene expression levels of studied miRNAs were calculated by the 2-DDCqmethod. HCs were used as calibrators in the analysis. Real-time ex-periments were performed in triplicates and the mean Ct values were calculated.
clInIcAl meAsurements
Clinical disease activity was calculated using the sys-temic lupus erythematosus disease activity score (SLEDAI). Lupus activity profile (LAP) was determined by measurement of the titer of antinuclear antibodies, anti-double stranded DNA antibodies and levels of complement components – C3 and C4. Testing for anti-extractable nuclear antigen antibodies (ENA) was performed by using ANA immunoblot including IgG antibodies against 15 extractable nuclear antigens – RNP/Sm, Sm, ssA, ssB, Ro52, Scl70, PM/Scl70, Jo1, Cent B, PCNA, dsDNA, Nucleosomes, Histones, Ri-bosomal P-protein, Mi2 (Euroline 3, Euroimmun®, Germany). Testing for antiphospholipid antibodies was performed by in-vitro diagnostic (IVD) test kits [anti-b2GPI (IgA, IgG, IgM) Human®; anti-prothrom-bin (IgG/IgM) Alegria, Orgentec®); anti-cardiolipin (IgA, IgG, IgM) Euroimmun®EA)]. Laboratory activi-ty was measured by elevated acute phase reactants
(ery-throcyte sedimentation rate – ESR, C-reactive protein--CRP). The frequency of secondary Raynaud syndrome, Sjögren’s syndrome and antiphospholipid syndrome was determined and correlated with disease variables. stAtIstIcAl AnAlysIs
Statistical analysis was performed using SPSS Statistics v. 20.0. The Student’s t-test and the Spearman’s rank correlation coefficient were used for comparison and estimation of correlations between miRNA expression levels and clinico-pathological characteristics such as diagnosis, age, ESR, CRP, SLEDAI, immunological pa-rameters, presence of secondary Raynaud syndrome and Sjögren’s syndrome. Receiver operating curve (ROC) analysis was performed for evaluation of
speci-ficity and sensitivity of PB miRNA expression levels for discriminating SLE patients from HCs. Diagnostic ac-curacy for combination of biomarkers was also deter-mined by calculating weight coefficients for every biomarker obtaining the largest possible area under the curve (AUC) in ROC analysis. Calculation of coeffi-cients was performed according to Pepe and Thom-son32. Two-tailed p-values were taken into account.
results
Relative miRNA expression levels in PB samples of SLE patients were obtained by using RNU6B as a reference gene for normalization and HCs as calibrator samples.
tAble I. clInIcAl chArActerIstIcs of the PArtIcIPAnts
Characteristics SLE HCs
Number of pts 40 32
Gender, men/women 0/40 10/22
Age in years (range) mean age 24÷67 (43.6±12.01) 26÷72 (39.15±12.07)
Disease duration, months (mean, range) 99.02 (1÷336) n/a
ANA (+), number (%) 36 (90.0 %) 0 (0.0 %)
a-dsDNA Ab (+), number (%) 12 (30.0 %) n/a
a-nucleosomes Ab (+), number (%) 4 (10.0 %) n/a
a-histones Ab (+), number (%) 3 (7.5 %) n/a
a-Sm Ab (+), number (%) 4 (10.0 %) n/a
a-ssA Ab (+), number (%) 11 (27.5 %) n/a
a-Ro52 Ab (+), number (%) 13 (32.5 %) n/a
a-ssB Ab (+), number (%) 7 (17.5 %) n/a
aCLs Ab (+), number (%) 5 (12.5 %) n/a
a- 2GP1 Ab (+), number (%) 7 (17.5 %) n/a
Anti-protrombin Ab (+), number (%) 0 (0.0 %) n/a
Low C3 franction (+), number (%) 3 (7.5 %) n/a
Low C4 franction (+), number (%) 11 (27.5 %) n/a
ESR mm/h (mean, range) 29.27 (2 ÷ 80) n/a
CRP mg/dl (mean, range) 5.59 (0.05÷24.78) n/a
SLEDAI (mean, range) 5.53 (1÷13) n/a
Secondary Raynaud syndrome 12 (30.0 %) n/a
Secondary Sjögren’s syndrome 8 (20.0 %) n/a
Secondary APS 4 (10.0 %) n/a
Corticosteroids, n (pts), mean dose (mg) 40 (10.2) n/a
DMARD 37 (92.5 %) n/a
Biological DMARD 5 (12.5 %) n/a
Ab: antibody; a- 2GP1 Ab: anti-beta2 glycoprotein 1 antibodies; a-CL Ab: anti-cardiolipin antibodies; a-dsDNA Ab: anti-doublestrained deoxyribonucleic acid antibodies; ANA: antinuclear antibodies; a-Sm Ab: anti-Smith antibodies; APS: antiphospholipid syndrome; CRP: C-reactive protein; SLEDAI: systemic lupus erythematosus disease activity index; DMARD: disease modifying antirheumatic drug; ESR: erythrocyte sedimention rate; HCs - healthy controls; n/a - not applicable; pts: patients; SLE: systemic lupus erythematosus.
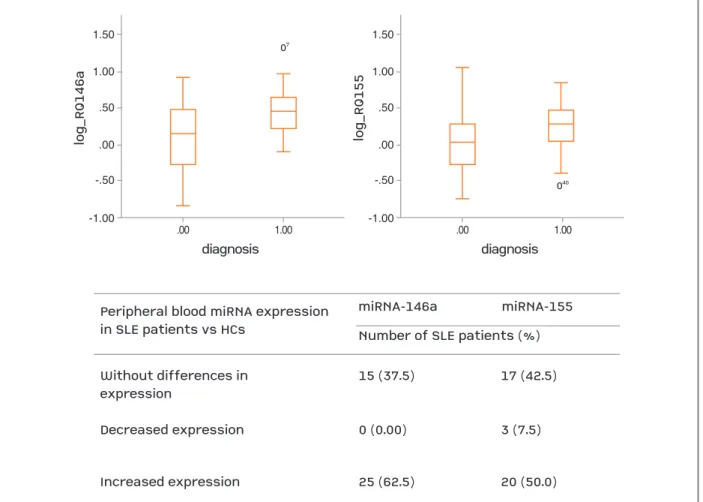
Relative quantification (RQ) values were calculated by the 2-DDCtmethod for evaluation of the expression le vels. RQ values between 0.500 and 1.999 mean no signifi-cant difference in expression, values ≤ 0.499 mean de-creased expression and values ≥ 2.00 mean inde-creased expression.
PerIPherAl blood mirnA exPressIon
Peripheral blood expression levels of 146a and miR155 were overexpressed in 62.5% and 50.0%, res pecti -vely, of the SLE patients compared to HCs (Fi gure 1).
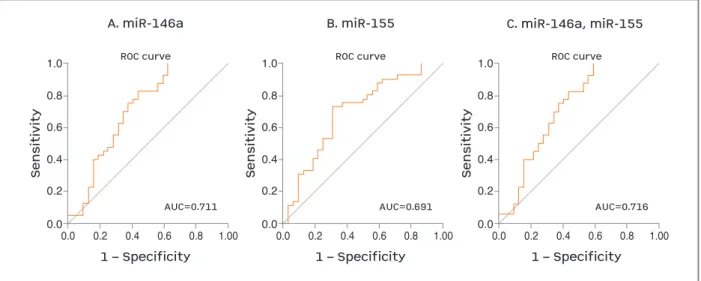
The ROC curve analysis showed that the expression levels of miR-146a could discriminate SLE patients from HCs with AUC=0.711 (95% CI: 0.585÷0.837, p=0.002), with 82.5% sensitivity and 56.2% specifici-ty. The diagnostic accuracy of miR-155 was lower with AUC=0.691 (95% CI: 0.566÷0.817, p=0.005), with 77.5% sensitivity and 50.0% specificity. The
diagnos-tic accuracy did improve when combination of the studied miRNAs was used in multimarker ROC curve analysis (AUC=0.716, 95% CI: 0.590÷0.842, p = 0.002), 82.5% sensitivity and 56.2% specificity (Figure 2, Table II).
clInIcAl PArAmeters And PerIPherAl blood mirnA exPressIon levels
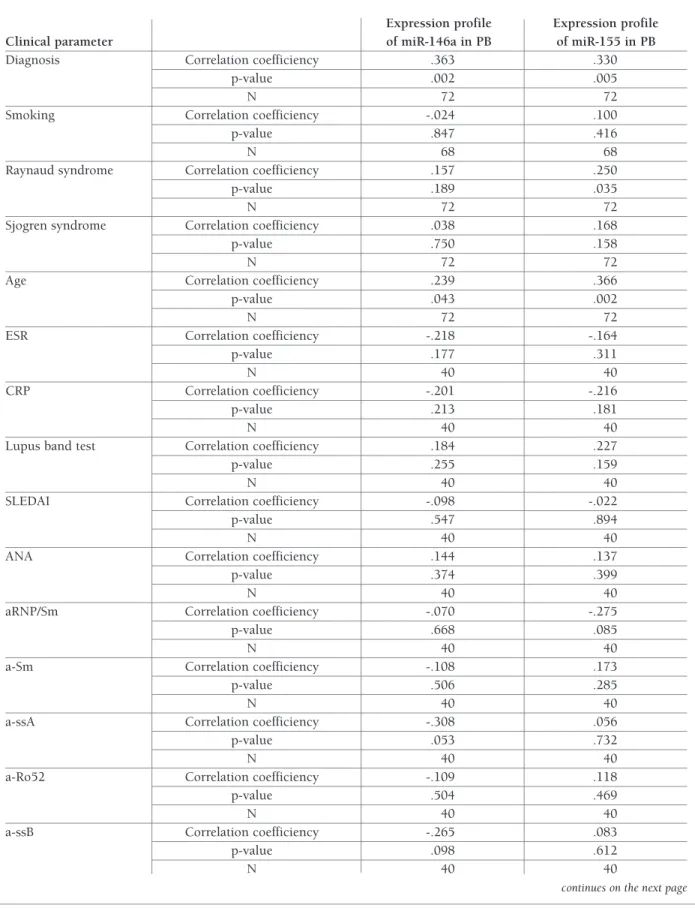
miR-146a and miR-155 showed correlation with the diagnosis (rs=0.363, p=0.002 and 0.330, p=0.005, res -pectively) and the age of the patients (rs=0.239, p=0.043 and 0.366, p=0.002, respectively), and miR-155 showed correlation with the presence of secondary Raynaud syndrome (Spearman correlation coefficient was 0.250, p=0.035). None of studied miRNA corre-lated with SLEDAI (rs -.098, p=0.547 and rs -.022, p=0.894) nor with the immunological activity accor -ding to the presence of ANA, a-dsDNA, a-Sm, a-b2GPI,
1.50 1.00 .50 lo g_ R Q 14 6a .00 -.50 -1.00 .00 1.00 diagnosis
Peripheral blood miRNA expression in SLE patients vs HCs Without differences in expression 15 (37.5) 17 (42.5) Decreased expression 0 (0.00) 3 (7.5) Increased expression 25 (62.5) 20 (50.0) miRNA-146a
Number of SLE patients (%) miRNA-155 07 1.50 1.00 .50 lo g_ R Q 15 5 .00 -.50 -1.00 .00 1.00 diagnosis 040
fIGure 1. Peripheral blood miRNA expression in SLE patients compared to healthy controls. HCs: healthy controls; miR: microribonucleic acid; SLE: systemic lupus erythematosus
a-CL, a-ssA, a-ssB antibodies as well as C3 and C4 com-plement levels (Table III).
dIscussIon
Deregulated expression of circulating and tissue spe-cific miRNAs has been described in SLE patients com-pared to HCs indicating that miRNA could be used as biomarkers in the clinical practice. miRNAs signatures in the circulation or urine have been reported to be associated with the disease itself or different disease mani festations such as lupus nephritis, proteinuria and di -sease activity33.
To evaluate the expression of miRNAs as noninvasive diagnostic biomarkers in SLE we checked the expres-sion levels of two miRNAs in whole PB samples of SLE
patients compared to HCs for the first time and found that there was a significant difference between the stu -died groups. Both miR-146a and miR-155 have been found to be overexpressed in patients compared to HCs and the expression levels could be used to differentiate the studied groups. A possible reason for the different miRNA expression among the patients could be due to the heterogeneity of the analyzed group in regard to disease duration, severity and treatment.
Most of the previous studies of miRNA expression in SLE have been focused on PBMC or subtypes of cells – B cells, T cells, serum or urinary cell-free miRNAs. Data about the expression levels of miR-146a and miR-155 differ among the studies. It is known that miR146a is a ne -gative regulator of autoimmunity34. It has been de -monstrated that miR-146a levels in PBMCs of SLE pa-tients negatively correlate with the disease activity and 1.0 0.8 0.6 A. miR-146a 0.4 0.2 0.0 0.0 0.2 0.4 0.6 0.8 1.00 1 – Specificity ROC curve AUC=0.711 Se n si ti vi ty 1.0 0.8 0.6 B. miR-155 0.4 0.2 0.0 0.0 0.2 0.4 0.6 0.8 1.00 1 – Specificity ROC curve AUC=0.691 Se n si ti vi ty 1.0 0.8 0.6 C. miR-146a, miR-155 0.4 0.2 0.0 0.0 0.2 0.4 0.6 0.8 1.00 1 – Specificity ROC curve AUC=0.716 Se n si ti vi ty
fIGure 2. ROC curve analysis for determination the sensitivity and specificity of the studied miRNAs in peripheral blood for discriminating SLE patients from HCs.
AUC: area under the curve; HCs: healthy controls; miRNAs: microribonucleic acids; ROC: receiver operating curve; SLE: systemic lupus erytematosus
tAble II. receIver oPerAtInG curve AnAlysIs by usInG mirnAs In PerIPherAl blood to dIfferentIAte sle PAtIents from heAlthy controls
PB miRNA SLE vs HCs AUC (95 % CI) p-value Se (%) Sp (%)
miR-146a 0.711 (0.585 ÷ 0.837) 0.002 82.50 56.20
miR-155 0.691 (0.566 ÷ 0.817) 0.005 77.50 50.00
miR-146a and miR-155 0.716 (0.590 ÷ 0.842) 0.002 82.50 56.20
AUC: area under the curve; HC: healthy controls; miR: microribonucleic acid; PB: peripheral blood; Se: sensitivity; Sp: specificity; SLE: systemic lupus erythematosus;
tAble III. clInIcAl PArAmeters And PerIPherAl blood mirnA exPressIon levels
Expression profile Expression profile
Clinical parameter of miR-146a in PB of miR-155 in PB
Diagnosis Correlation coefficiency .363 .330
p-value .002 .005
N 72 72
Smoking Correlation coefficiency -.024 .100
p-value .847 .416
N 68 68
Raynaud syndrome Correlation coefficiency .157 .250
p-value .189 .035
N 72 72
Sjogren syndrome Correlation coefficiency .038 .168
p-value .750 .158
N 72 72
Age Correlation coefficiency .239 .366
p-value .043 .002
N 72 72
ESR Correlation coefficiency -.218 -.164
p-value .177 .311
N 40 40
CRP Correlation coefficiency -.201 -.216
p-value .213 .181
N 40 40
Lupus band test Correlation coefficiency .184 .227
p-value .255 .159
N 40 40
SLEDAI Correlation coefficiency -.098 -.022
p-value .547 .894
N 40 40
ANA Correlation coefficiency .144 .137
p-value .374 .399
N 40 40
aRNP/Sm Correlation coefficiency -.070 -.275
p-value .668 .085
N 40 40
a-Sm Correlation coefficiency -.108 .173
p-value .506 .285
N 40 40
a-ssA Correlation coefficiency -.308 .056
p-value .053 .732
N 40 40
a-Ro52 Correlation coefficiency -.109 .118
p-value .504 .469
N 40 40
a-ssB Correlation coefficiency -.265 .083
p-value .098 .612
N 40 40
activity of IFN signaling pathway and the expression of miR-146a in lupus macrophages negatively regu lated the IFN type I production by targeting toll like re -ceptors (TLRs) signaling molecules22. Levels of miR--146a have been reported to be downregulated in PBMCs as well as in plasma and serum of SLE patients including lupus nephritis patients11,35,36. Zheng C et al. demonstrated a decreased expression of miR-146a in renal tissues with an enhanced transcriptional activity of TRAF6 while Lu J et al. found an overexpression of miR146a in the glomeruli but not in the tubulointers -titium of lupus nephritis patients which degree of change correlated with the clinical disease severity37,38. Perez-Hermandez J et al. reported much higher levels of miR-146a in the urinary exosomes of patients with active lupus nephritis when compared to whole urine or exosome-depleted fractions39. In our study only 5 patients had lupus nephritis and in two of them this im-portant disease manifestation was active and required change of treatment regimen. In three of the samples from lupus nephritis patients the expression levels of both studied miRNAs was not changed compared to HCs. In one of the samples miR-146 was elevated but miR-155 levels were not changed and in one sample miR-155 was downregulated and miR-146 levels were
not changed. The small number of lupus nephritis pa-tients doesn’t allow us to draw any conclusions regarding this disease manifestation and levels of miRNAs expression in the PB. Interestingly, Charrier E et al. described higher levels of miR-146a and miR-155 in human umbilical cord blood pDCs when compared to adult blood pDCs and supposed that miR-146a could be a negative modulator in pDC survival and function40. Löfgren S et al. found that the expression of miR-146a in SLE patients with European ancestry was associated with a single-nucleotide polymorphism (SNP) - rs2431697 and the risk allele of this SNP correlates with the downregulation of the miR-146a41. In our study all the patients were from European ancestry, but we didn’t perform a genetic study for SNPs.
Similarly to Thai T et al. who found overexpression of 155 in SLE B cells in our study levels of miR--155 were higher in the peripheral blood of SLE patients compared to HCs29. The possible role of miR-155 in B cell survival and autoantibody production has been linked to targeting SH2 domain-containing inosi tol 5'-phosphatase 1 (SHIP1) protein, which is an inhibito-ry signaling transducer responsible for B cell acti vation27. miR-155 has been also shown to regulate Tregs pheno-Ab: antibody; a-β2GP1 pheno-Ab: anti-beta2 glycoprotein 1 antibodies; a-CL pheno-Ab: anti-cardiolipin antibodies; a-dsDNA pheno-Ab: anti-doublestrained deoxyribonucleic acid antibodies; a-Sm Ab: anti-Smith antibodies; ANA: antinuclear antibodies; CRP: C-reactive protein; ESR: erythrocyte sedimention rate; miRNA: micro ribonucleic acids; N: number; PB: peripheral blood; SLEDAI: systemic lupus erythematosus disease activity index
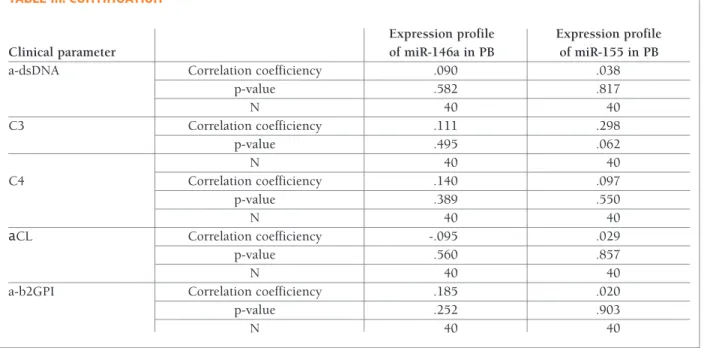
tAble III. contInuAtIon
Expression profile Expression profile
Clinical parameter of miR-146a in PB of miR-155 in PB
a-dsDNA Correlation coefficiency .090 .038
p-value .582 .817 N 40 40 C3 Correlation coefficiency .111 .298 p-value .495 .062 N 40 40 C4 Correlation coefficiency .140 .097 p-value .389 .550 N 40 40 аCL Correlation coefficiency -.095 .029 p-value .560 .857 N 40 40
a-b2GPI Correlation coefficiency .185 .020
p-value .252 .903
type. Using mice models of SLE Divekar A et al. demons -trated that the insufficiency in the Dicer expression as well as the upregulation of miR-155 promote the defect in Tregs phenotype by targeting CD62L24.
According to Chen J et al. levels of miR-146a and miR-155 were increased in SLE PBMC of European pa-tients and the elevated expression levels of miR-155 in PBMC correlated with the increased peripheral DN B cells percentage in lupus42. Similarly, in our study le vels of miR-146a and miR-155 were overexpression in whole PB samples.
The differences in the expression pattern of the stu -died miRNAs according to the different studies could be due to the number of studied SLE patients, to their genetic background as studies using European and Chi-nese patients showed controversial results, as well as the influence of environmental factors – including die -tary factors, on miRNA expression which are different in the different ethnicities43. The discordance between the expression pattern of miRNAs in whole PB and PBMCs or their subtypes could also be attributed to the presence of regulatory mechanisms that affect the ex-pression of miR-146a and miR-155 when examining whole PB samples, the different methodology of RNA isolation in the samples as well as the blood cell counts44. Finally, the conflicting data about the levels of expression of the studied miRNAs in PB, cell compart-ments or exosomes in SLE patients confirms that the expression of miRNA differs according to the used body fluids because of the origin of the miRNAs, their con-centrations, procedural artifacts and variation of sam-ple processing as well as in the data normalization. To our knowledge our study is the first to investigate the expression patterns of miR-146a and miR-155 in whole PB samples of SLE patients.
We didn’t find a correlation between the levels of miR-146a and miR-155 and the disease activity in the studied SLE patients as a whole as well as with the immunologi-cal activity which might reflect the variants of SLE disease activity in the patients who participated in the study, the difference in their genetic background or in the used med-ications. Measuring the concentrations of specific miR-NAs at a specific disease state might miss the dynamical-ly modulated miRNAs thus indicating that larger study is needed to confirm our results in the clinical practice.
conclusIon
Although SLE has an unknown etiology in the recent
years many studies are trying to understand the trigger factor and mechanisms behind the autoimmunity in SLE. The research on the epigenetic deregulated ex-pression of SLE related genes including studies on miRNA expression and function have proved the im-portant role of miRNAs in regulating the innate and adaptive immune responses in the pathogenesis of au-toimmune diseases. The lower complexity, the stabili-ty, no known postprocessing modifications, simple de-tection and amplification methods of miRNAs in the body fluids and tissues as well as the correlation be-tween the expression of certain miRNAs and clinical variables suggests a potential role of miRNAs profiling as biomarkers for disease activity in SLE. Larger mul-ticenter studies including patients with different an-cestry and genetic background are needed to confirm the diagnostic utility of the studied miRNAs in SLE.
corresPondence to
Russka Shumnalieva
Mailing Address / Morada: Sofia 1715, Mladost - 4, Bl. 411, ent. 3, fl. 4, app. 11
Phone Number / Telefone: 359889332674 E-mail: [email protected]
references
1. Monov S, Monova D. Classification criteria for neuropsychiatric systemic lupus erythematosus: do they need a discussion? Hip-pokratia 2008; 2: 103-107.
2. Rahman A, Isenberg DA. Systemic lupus erythematosus. N Eng J Med. 2008; 358: 929-939.
3. Shlomchik MJ, Craft JE, Mamula MJ. From T to B and back again: positive feedback in systemic autoimmune disease. Na-ture Reviews Immunology 2001; 2: 147-153.
4. Datta SK, Zhang L, Xu L. T-helper cell intrinsic defects in lupus that break peripheral tolerance to nuclear autoantigens. J Mol Med. 2005; 83: 267-278.
5. Kim HJ, Verbinnen B, Tang X, Lu L, Cantor H. Inhibition of fol-licular T-helper cells by CD8(+) regulatory T cells is essential for self tolerance. Nature 2010; 467: 328-332.
6. Sawla P, Hossain A, Hahn BH, Singh PR. Regulatory T cells in systemic lupus erythematosus (SLE); Role of peptide tolerance. Autoimmunity Reviews 2012; 9: 611-614.
7. Absher DM, Li X, Waite LL, Gibson A, Roberts K, Edberg J, et. al. Genome-wide DNA methylation analysis of systemic lupus erythematosus reveals persistent hypomethylation of interferon genes and compositional changes to CD4+ T-cell populations. PLoS Genet 2013; 9: (8):e1003678.
8. Balada E, Ordi-Ros J, Vilardell-Tarrés M. DNA methylation and systemic lupus erythematosus. Ann N Y Acad Sci. 2007; 1108: 127-136.
9. Richardson B, Scheinbart L, Strahler J, Gross L, Hanash S, John-son M. Evidence for impaired T cell DNA methylation in sys-temic lupus erythematosus and rheumatoid arthritis. Arthritis Rheum. 1990; 33: 1665–1673.
10. Pan W, Zhu S, Yuan M, Cui H, Wang L, Luo X, et al. MicroRNA--21 and microRNA-148a contribute to DNA hypomethylation
in lupus CD4+ T cells by directly and indirectly targeting DNA methyltransferase 1. J Immunol. 2010; 12: 6773-6781. 11. Wang H, Peng W, Ouyang X, Li W, Dai Y. Circulating
micro-RNAs as candidate biomarkers in patients with systemic lupus erythematosus. Transl Res. 2012; 160: 198-202
12. Miao CG, Yang YY, He X, Huang C, Huang Y, Zhang L, et al. The emerging role of microRNAs in the pathogenesis of systemic lu-pus erythematosus. Cell Signal. 2013; 9: 1828-1836. 13. Ohl K, Tenbrock K. Regulatory T cells in systemic lupus
ery-thematosus. Eur. J. Immunol. 2015; 45: 344–355.
14. Sheng Y, Yim LY, Lu L, Lau CS, Chan VSF. microRNA regulation in systemic lupus erythematosus. Immune Netw. 2014; 13: 138--148.
15. Zan H, Tat C, Casali P. microRNAs in lupus. Autoimmunity 2014; 4: 272-285.
16. Zhao S, Wang Y, Liang Y, Zhao M, Long H, Ding S, et al. Mi-croRNA-126 regulates DNA methylation in CD4+ T cells and contributes to systemic lupus erythematosus by targeting DNA methyltransferase 1. Arthritis Rheum. 2011; 63: 1376-1386. 17. Qin H, Zhu X, Liang J, Wu J, Yang Y, Wang S, Shi W, Xu J.
Mi-croRNA-29b contributes to DNA hypomethylation of CD4+ T cells in systemic lupus erythematosus by indirectly targeting DNA methyltransferase 1. J Dermatol Sci. 2013; 69: 61-67. 18. Rasmussen, TK. Follicular T helper cells and IL21 in rheuma
-tic diseases. Dan Med J. 2016; 10: pii: B5297.
19. Stagakis E, Bertsias G, Verginis P, Nakou M, Hatziapostolou M, Kritikos H, et al. Identification of novel microRNA signatures linked to human lupus disease activity and pathogenesis: miR--21 regulates aberrant T cell responses through regulation of PDCD4 expression. Annals Rheum Dis. 2011; 8: 1496-1506. 20. Obermoser G, Pascual V. The interferon-alpha signature of
sys-temic lupus erythematosus. Lupus 2010; 9: 1012-1019. 21. Jakymiw A, Ikeda K, Fritzler MJ, Reeves WH, Satoh M, Chan
EK. Autoimmune targeting of key components of RNA inter-ference. Arthritis Res Ther. 2006; 4: R87.
22. Tang Y, Luo X, Cui H, Ni X, Yuan M, Guo Y, et al. MicroRNA-146A contributes to abnormal activation of the type I interfer-on pathway in human lupus by targeting the key signaling pro-teins. Arthritis Rheum. 2009; 4: 1065-1075.
23. Hou J, Wang P, Lin L, Liu X, Ma F, An H, et al. MicroRNA-146a feedback inhibits RIG-I-dependent Type I IFN production in macrophages by targeting TRAF6, IRAK1, and IRAK. J Im-munol. 2009; 138: 2150-2158.
24. Divekar AA, Dubey S, Gangalum PR, Singh RR. Dicer insuffi-ciency and microRNA-155 overexpression in lupus regulatory T cells: apparent paradox in the setting of an inflammatory mi-lieu. J. Immunol. 2011; 186: 924–930.
25. Wang P, Hou J, Lin L, Wang C, Liu X, Li D, et al. Inducible mi-croRNA-155 feedback promotes type I IFN signaling in antivi-ral innate immunity by targeting suppressor of cytokine signal-ing 1. J Immunol. 2010; 10: 6226-33.
26. Zhou H, Huang X, Cui H, Luo X, Tang Y, Chen S, et al. miR-155 and its star-form partner miR-155* cooperatively regulate type I interferon production by human plasmacytoid dendritic cells. Blood 2010; 26: 5885-94.
27. Kurowska-Stolarska M, Alivernini S, Ballantine LE, Asquith DL, Millar NL, Gilchrist DS, et al. MicroRNA-155 as a proinflam-matory regulator in clinical and experimental arthritis. Proc Natl Acad Sci U S A. 2011; 27: 11193-11198.
28. O'Connell RM, Chaudhuri AA, Rao DS, Baltimore D. "Inositol phosphatase SHIP1 is a primary target of miR-155." Proc Natl
Acad Sci U S A. 2009; 17: 7113-7118.
29. Thai TH, Patterson HC, Pham DH, Kis-Toth K, Kaminski DA, Tsokos GC. Deletion of microRNA-155 reduces autoantibody responses and alleviates lupus-like disease in the Fas(lpr) mouse. Proc Natl Acad Sci U S A. 2013; 50: 20194-20199. 30. Hochberg, MC. Updating the American College of Rheumato
-logy revised criteria for the classification of systemic lupus ery-thematosus. Arthritis Rheum. 1997; 9: 1725.
31. Stanczyk J, Pedrioli DM, Bretano F et al. Altered expression of MicroRNA in synovial fibroblasts and synovial tissue in rheuma-toid arthritis. Arthritis Rheum 2008; 4: 1001-1009.
32. Pepe MS, Thompson ML. Combining diagnostic test results to increase accuracy. Biostatistics. 2000; 2: 123-140.
33. Carlsen AL, Schetter AJ, Nielsen CT, Lood C, Knudsen S, Voss A, et al. Circulating microRNA expression profiles associated with systemic lupus erythematosus. Arthritis Rheum. 2013; 65: 1324–1334.
34. Xu W, Lu M, Pan HF, Ye DQ. Association of MicroRNA-146a with autoimmune diseases. Inflammation. 2012; 35: 1525--1529.
35. Wang G, Tam LS, Li EK, Kwan BC, Chow KM, Luk CC, et al. Serum and urinary cell-free MiR-146a and MiR-155 in patients with systemic lupus erythematosus. The Journal of Rheuma-tology 2010; 12: 2516–2522.
36. Zhu Y, Xue Z, Di L. Regulation of MiR-146a and TRAF6 in the diagnose of lupus nephritis. Medical Science Monitor: Interna-tional Medical Journal of Experimental and Clinical Research. 2017; 23: 2550-2557
37. Zheng CZ, Shu YB, Luo YL, Luo J. The role of miR-146a in modu lating TRAF6-induced inflammation during lupus nephri-tis. Eur Rev Med Pharmacol Sci. 2017; 21:1041-1048. 38. Lu J, Kwan BC, Lai FM, Tam LS, Li EK, Chow KM, et al.
Glomerular and tubulointerstitial 638, 198 and miR--146a expression in lupus nephritis. Nephrology 2012; 4: 346–351
39. PerezHernandez J, Cortes R. Extracellular Vesicles as Biomar -kers of Systemic Lupus Erythematosus. Dis Mar-kers. 2015: 613536.
40. Charrier E, Cordeiro P, Cordeau M, Dardar R, Michaud A, Harnois M, et al. Post-transcriptional down-regulation of Toll-like receptor. Cell Immunol. 2012; 276: 114-121.
41. Löfgren SE, Frostegård J, Truedsson L, Pons-Estel BA, D'Alfon-so S, Witte T, et al. Genetic asD'Alfon-sociation of miRNA-146a with systemic lupus erythematosus in Europeans through decreased expression of the gene. Genes Immun. 2012; 3: 268-274. 42. Chen JQ, Papp G, Póliska S, Szabó K, Tarr T, Bálint BL,
Szodor-ay P, Zeher M. MicroRNA expression profiles identify disease--specific alterations in systemic lupus erythematosus and pri-mary Sjögren's syndrome. PLoS One. 2017; 12(3):e0174585. 43. Palmer JD, Soule BP, Simone BA, Zaorsky NG, Jin L, Simone NL. MicroRNA expression altered by diet: can food be medici-nal? Ageing Res Rev. 2014; 17:16–24.
44. Anaparti V, Smolik I, Meng X, Spicer V, Mookherjee N, ElGabalawy H. Whole blood microRNA expression pattern diffe -rentiates patients with rheumatoid arthritis, their seropositive first-degree relatives, and healthy unrelated control subjects. Arthritis Res Ther. 2017; 19(1):249.