UNIVERSIDADE DO ALGARVE
Faculdade de Ciências e Tecnologia
Contamination of farmed gilthead sea bream
(Sparus aurata, Linnaeus, 1758) by the
parasite Amyloodinium ocellatum – A
proteomic approach
UNIVERSIDADE DO ALGARVE
Faculdade de Ciências e Tecnologia
Contamination of farmed gilthead sea bream
(Sparus aurata, Linnaeus, 1758) by the
parasite Amyloodinium ocellatum – A
proteomic approach
DECLARAÇÃO DE AUTORIA DE TRABALHO
Declaro ser o autor deste trabalho, que é original e inédito. Autores e trabalhos consultados estão devidamente citados no texto e constam da listagem de referências incluída.
Universidade do Algarve, 28 de setembro de 2015
_________________________________________
© 2015 Márcio Júlio Vicente Moreira
A Universidade do Algarve tem o direito, perpétuo e sem limites geográficos, de arquivar e publicitar este trabalho, através de exemplares impressos reproduzidos em papel ou de forma digital, ou por qualquer outro meio conhecido ou que venha a ser inventado, de o divulgar através de repositórios científicos e de admitir a sua cópia e distribuição com objetos educacionais ou de investigação, não comerciais, desde que seja dado crédito ao autor e editor.
This work was published in the following formats (in Annex):
As poster communication, with the following title:
M. MOREIRA, D. SCHRAMA, F. SOARES, P. POUSÃO-FERREIRA, P. RODRIGUES (2014). “Proteomic analysis of gilthead sea bream plasma with amyloodiniosis”, presented in COST Action FA1002 Final Showcase Meeting on Farm Animal Proteomics, 17-18 November 2014, Milan (Italy).
As book chapter, with the following title:
M. MOREIRA, D. SCHRAMA, F. SOARES, P. POUSÃO-FERREIRA, P. RODRIGUES (2014). “Proteomic analysis of gilthead sea bream plasma with amyloodiniosis”, Farm Animal Proteomics 2014, pp. 188-193, DOI: 10.3920/978-90-8686-810-0.
As oral communication:
Presentation of a seminar with the title "Estudios sobre la infección por el dinoflagelado Amyloodinium ocellatum en la dorada (Sparus aurata)", ministred on 20 March 2013, in Salón de Actos do Centro IFAPA Agua del Pino (Crta. El Rompido-Punta Umbría Km 3.8, Cartaya, Huelva, Spain).
I would like to thank my formal supervisor Dra. Florbela Soares, from the Aquaculture Research Centre, National Institute for the Sea and Atmosphere (IPMA), for bringing me to the pathology area, for all the patience, motivation, all the opportunities, scientific formation, and all the support provided on this thesis. I want also to thank to my other formal supervisor, Professor Pedro Rodrigues, from CCMAR – Centre of Marine Sciences, University of Algarve for the opportunities and scientific formation in proteomics provided under the COST Action FA1002 - Farm Animal Proteomics, and the support provided on this thesis. I thank also to project BONAQUA (0433_BONAQUA_5_E), for all the financial support to this thesis. I also want to thank to Denise Schrama from CCMAR, for all the support and supervising on the proteomic analysis, on the structuring of this thesis and for sharing with me their expertise in a scientific manner; to Marcelino Herrera from IFAPA Agua del Pino, for all the support and supervising on the stress indicator analysis; to Tune Wulff from The Novo Nordisk Foundation Center for Biosustainability, Technical University of Denmark for all the help in the spot analysis ;to Dr. Pedro Pousão from EPPO-IPMA, for the inestimable contribution by providing facilities and fishes for my thesis; and to Dr. Jose Ignacio Navas Triano from IFAPA Agua del Pino, for the three months internship in IFAPA Agua del Pino and motivation, all the opportunities and scientific formation, and all the great conversations about science, pathology, parasites and bacteria.
My special thanks to all the EPPO-IPMA staff, especially to Margarida Gamboa, Marina Cabral, Luis Magina, Paula Moura, Marta Santos, Hugo Ferreira and João Moura for the participation in the final sampling of my thesis and to João Veríssimo for all the help in the conception and assembly of the system, and also to Dra. Laura Ribeiro and Dra. Emília Cunha for all the support along this years; to all the IFAPA Agua del Pino staff, especially Monse López Sanmartín and Jose López Fernández, dear colleagues and friends, for all the support and help on my three months internship in IFAPA; and to all the AQUAGROUP staff, for all the sympathy and help during the proteomic and osmotic analysis. I also want to thank Dra. Maria Teresa Dinis, because she was the person that captivated me to the Aquaculture area with all of her passion and love for this area of work.
I dedicate this thesis to my parents and brother, for all the support along this years, and especially to a unique person, that I love very much and that has committed the crazy act of marrying me: Lília Cabral.
Global world population is expected to reach approximately 9 billion by 2050, and the world food-producing sector must secure food for the growing population through increased production and reduced waste. Due to this, aquaculture can represent a solution to the substitution and increase of fish protein available to the populations. However, a higher development of aquaculture is constrained by different causes, being one of the most important diseases. In Southern Europe, especially in the Mediterranean area, amyloodiniosis represents a major bottleneck for semi-intensive aquaculture production in Southern Europe affecting the majority of fish farms, in different types of rearing tanks and systems, and causing extremely high mortalities. Amyloodinium ocellatum is the most common and important dinoflagellate parasitizing fish, and is one of the few fish parasites that can infest almost all fish, crustacean and bivalves that live within its ecological range are susceptible to infestation. In recent years there has been developed a large amount of largescale approaches in biology that promise to revolutionize systems-level understanding of cellular and organism functions. Amongst them, proteomics is getting an increasing interest, because information of DNA sequence, mRNAs and transcriptional activity provides only a static snapshot of the various ways in which a cell might use its proteins, whereas the life of the cell is a dynamic process. So in this work we have analysed the proteome and relate it with osmoregulatory and stress indicators of gilthead sea bream (Sparus aurata) plasma, in order to enlighten the different physiological responses when exposed to an A. ocellatum outbreak. After the proteomic DIGE, condition index (CI), hepatosomatic index (HSI) and spleen somatic index (SSI), and all the stress (cortisol), metabolic (glucose and lactate) and osmotic (pH, osmolarity) analysis, we have obtained statistical differences in the cortisol and lactate levels, and identified several proteins associated with immune response, acute phase response, inflammation, lipid transport, homeostasis, osmoregulation, wound healing, neoplasia, oxidative stress, and iron transport. Overall, this preliminary study revealed that amyloodiniosis can upregulate or downregulate proteins with known functions and provoke stress and metabolic responses in gilthead sea bream.
É esperado que a população mundial atinja 9 biliões de pessoas em 2050, sendo necessário que o sector alimentar assegure comida para esta população em crescimento, através de um aumento de produção e de uma redução de desperdícios alimentares. A aquacultura apresenta-se como uma área que pode representar uma solução para o aumento de pescado disponível para as populações. No entanto, um maior desenvolvimento desta indústria está limitada por diferentes causas, sendo uma das mais importantes as doenças que afetam as espécies cultivadas. No sul da Europa, uma das doenças que se apresenta como limitativa para o desenvolvimento da aquicultura é a amilodiniose. Esta doença afeta grande parte das pisciculturas (com diferentes sistemas de produção), provocando mortalidades muito elevadas. Esta doença é causada pelo parasita dinoflagelado Amyloodinium ocellatum, que é um dos poucos parasitas capazes de infetar todos os peixes, crustáceos e bivalves no seu alcance ecológico. Têm-se vindo a desenvolver desde há alguns anos uma série de abordagens de larga escala em biologia, que prometem revolucionar o nosso conhecimento a nível do funcionamento celular e do organismo. Entre as mais promissoras encontra-se a proteómica, porque providencia infirmações sobre os processos dinâmicos da vida de uma célula ou órgão, ao contrário de outras técnicas como a sequenciação de ADN, ARN mensageiro ou da transcriptómica. Dados estes factos, decidimos analisar o proteoma do plasma de dourada (Sparus aurata), assim como diversos indicadores metabólicos, osmorregulatórios e de stress, em resposta a um surto de A. ocellatum. Após a análise proteómica por intermédio de géis DIGE, com posterior sequenciação dos spots selecionados por LC-MS/MS, análise do índice de condição (IC), do índice hepatossomático (HSI), índice somático do baço (SSI) e de todas as análises de stress (cortisol), metabólicas (glucose, lactato) e de índices osmorregulatórios (pH, osmolaridade), obtivemos diferenças nos níveis de cortisol e lactato, assim como a identificações de diversas proteínas com funções a nível da resposta imunitária, de resposta de fase aguda, de resposta inflamatória, a nível de homeostasia e osmorregulação, de stress oxidativo, de cicatrização e neoplasia, e de transporte lipídico e de iões de ferro. Podemos assim verificar que este estudo revelou que o parasita A. ocellatum pode provocar uma super ou sub expressão de proteínas com funções conhecidas, assim como respostas metabólicas e de stress em dourada.
µl – microliters
µl/min – microliters per minute µm – micrometers
2D PAGE - two-dimensional polyacrylamide gel electrophoresis 2DE - two-dimensional gel electrophoresis
ADN – ácido desoxirribonucleico ARN – ácido ribonucleico
AMP – antimicrobial peptides amp. – ampliation
ANOVA - Analysis of variance ApoAI - Apolipoprotein A-I
BLAST - Basic Local Alignment Search Tool C3 complex – Complement mediator
CHAPS - 3-[(3-Cholamidopropyl)dimethylammonio]-1-propanesulfonate hydrate cm – centimeters
CO2 – carbon dioxide
Cy2 – bright, green fluorescent dye that can be excited using the 492 nm laser line
Cy3 - bright, orange-fluorescent dye that can be excited using the 532 nm laser line
Cy5 - bright, far-red-fluorescent dye with excitation ideally suited for the 633 nm or 647 nm
laser lines.
Da – dalton
DIGE - Differential in Gel Electrophoresis DNA – deoxirribonucleic acid
DTT - DL-Dithiothreitol EPPO – IPMA -
FAO – Food and Agriculture Organization FCR – feed conversion ratio
FDR – frequency discovery rate g – grams
HPI - hypothalamic-pituitary-interrenal axis hr – hour
HSI - hepatosomatic index IC - condition index ID – identification
IPG buffer – rehydration buffer kDa – kilodalton
L – liters
LC-MS/MS - Liquid chromatography-tandem mass spectrometry LPS – lipoproteins
m – meters M – molar
mA/gel – milliamperes per gel mg/L – miligrams per liter mm – milimeters
mM - millimolar
mRNA – Messenger ribonucleic acid MS/MS - tandem mass spectrometry Mw - molecular weight
Na+/H+ - Sodium/Hidrogen ratio
NaOH – sodium hydroxide ng/ml – nanograms per mililiter nmol – nanomole
ºC – degrees Celsius pI – isoelectric point pmol – picomole ppm – parts per million psu – pratical salinity units rpm – rotations per minute SDS – sodium dodecyl sulphate
SDS-PAGE - sodium dodecyl sulfate polyacrylamide gel electrophoresis SEI - ice-cold sucrose-EDTA-imidazole buffer
SSI - spleen somatic index T/C – Theoretical vs obtained T1 – treatment 1
Tf – Transferrin
Tris-HCl - Tris(hydroxymethyl)aminomethane hydrochloride buffer
Tris-HCl SDS-PAGE - Tris(hydroxymethyl)aminomethane hydrochloride sodium dodecyl
sulfate polyacrylamide gel electrophoresis
USD – United States Dollar UV – ultraviolet
V – volts
v/v – volume per volume Vhr – volts per hour w/v – weight per volume
Contents
I. Introduction ... 1
1.1. General Perspective of Aquaculture ... 1
1.2 . Impact of Diseases in Aquaculture ... 1
1.2.1. Dinoflagellates as Aetological Agents ... 2
1.3. Characterization of the Pathogen ... 4
1.3.1 Taxonomy ... 4
1.3.2 Life Cycle ... 5
1.3.3 Clinical Signs and Diagnostics ... 6
1.4 Treatments, Prevention, Control and Prophylaxis ... 8
1.5 Stress and Osmotic Indicators ... 10
1.6 Proteomic Analysis ... 13
1.7 Objective of This Work ... 17
II. Material and Methods ... 18
2.1. Experimental Design ... 18
2.2. Sampling ... 18
2.3. Stress and Osmoregulatory Indicators ... 19
2.3.1 Analytical Procedures ... 19
2.4. Statistical Analysis ... 20
2.5. Proteomics ... 20
2.5.1 Strip pH Range Selection ... 20
2.5.2 Protein Labeling for DIGE ... 21
2.5.3 Protein Separation by 2D Gel Electrophoresis ... 21
2.5.5 Protein Identification by MS Analysis of Peptides and Database Search ... 22
III. Results ... 24
3.1 . Dinospore Counting and Branchial Analysis ... 24
3.2 Condition Index, Hepatosomatic Index, Spleen Somatic Index ... 26
3.3 Stress, Metabolic and Osmotic indicators ... 27
3.4 Proteomic Analysis ... 28
3.4.1 Selection of pH Range ... 28
3.4.2. DIGE, Selection of Spots and Protein Identification ... 30
IV. Discussion ... 35
4.1 General Conclusions ... 41
4.2 Future perspectives ... 42
V. Bibliography ... 43
List of Figures
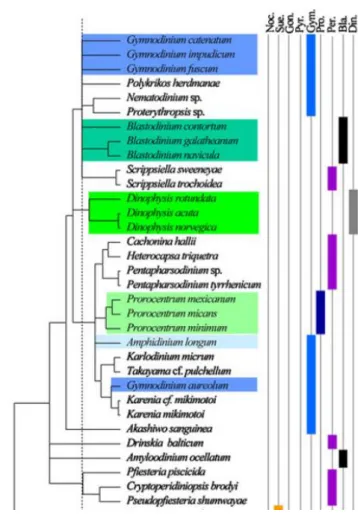
Figure 1.1 - Phylogenetic tree representing the order and phylogenetic proximity of
Amyloodinium ocellatum (Adapted from Ki et al., 2012) ... 5
Figure 1.2 - Life cycle phases of Amyloodinium ocellatum ... 6 Figure 1.3 – A - Amyloodinium ocellatum trophonts in meagre (Argyrosomus regius) gills
(40x) B- Amyloodinium ocellatum tomonts detach from meagre (Argyrosomus regius) gills (100x) (Adapted from Soares et al., 2012) ... 7
Figure 1.4 - Areas of possible use of proteomics as a tool for investigation in aquaculture
(adapted from Rodrigues et al., 2012) ... 16
Figure 3.1 - Amyloodinium ocellatum dinospores concentration in the water from different
treatments, T1, T2 and Control (N=11, Error bars= standard deviation). ... 24
Figure 3.2 - Images of gilthead sea bream (Sparus aurata) branchia from the different
treatments: Control (A, 40x amp.), T1 (B, 40x amp.) and T2 (C, 40x amp.) after 18h of exposition to an Amyloodinium ocellatum outbreak. The red arrows point out the Amyloodinium ocellatum trophonts and the green circle the monogenean parasite Dactylogirus sp. ... 25
Figure 3.3 - Gilthead sea bream (Sparus aurata) IC (A), HSI (B) and SSI (C) values in Control
and T1 after 18h of exposition to an Amyloodinium ocellatum outbreak (N=11, Error bars= standard deviation). ... 26
Figure 3.4 - Gilthead sea bream (Sparus aurata) osmolarity (A), pH (B), Glucose (C), Lactate
(D), Cortisol (E) and Total protein (F) levels in Control and T1 after 18h of exposition to an Amyloodinium ocellatum outbreak. (N=11, Error bars= standard deviation. The asteriscus (*) marks the test where is statistical difference between treatments). ... 27
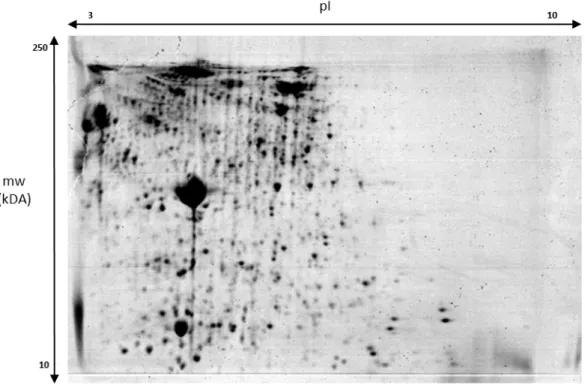
Figure 3.5 - Gel with pH 3-10 range obtained for gilthead sea bream (Sparus aurata) plasma
... 28
Figure 3.6 - Gel with pH 7-10 range obtained for gilthead sea bream (Sparus aurata) plasma
... 29
Figure 3.7 - Gel with pH 4-7 range obtained for gilthead sea bream (Sparus aurata) plasma 29 Figure 3.8 - Representative 2D PAGE of gilthead sea bream (Sparus aurata) plasma
representing the spots selected for analysis. ... 31
Figure 6.1 – Poster presented in COST Action FA1002 Final Showcase Meeting on Farm
Figure 6.2 - Chapter of the book Farm Animal Proteomics 2014, pp. 188-193, DOI:
10.3920/978-90-8686-810-0. ... 66
Figure 6.3 - Seminar presented in Centro IFAPA Agua del Pino (Crta. El Rompido-Punta
List of Tables
Table 1.1 - Some aquaculture species affected by Amyloodinium ocellatum ... 3 Table 3.1 - Detailed list of selected protein spots identified by LC-MS/MS differentially
expressed in the plasma of gilthead sea bream (Sparus aurata) exposed to an Amyloodinium ocellatum outbreak. ... 32
Table 3.2 - Profile expression and possible function of the identified peptides in gilthead
Introduction
I. Introduction
1.1. General Perspective of Aquaculture
Global world population is expected to reach approximately 9 billion by 2050, and the world food-producing sector must secure food for the growing population through increased production and reduced waste (The World Bank, 2013; FAO, 2014a). Due to this, aquaculture can represent a solution to the substitution and increase of fish protein available to the populations, as a response to a stagnation and decline in fisheries.
Nowadays, aquaculture is the food industry with the highest annual growth rate (6.3% average growth rate in 2000-2012, 4.9% in 2014) (FAO 2014b; FAO 2014c) with a contribution to total food fish supply that grew from 9% in 1980 to 48 % in 2011 (FAO, 2013), with a forecast for 2015 of 54% of the total food fish supply, a 5% increase in relation to 2014 (FAO, 2015b). The estimated number of fish farmers also grew from 3.9 million in 1990 to 16.6 million in 2010 (Bank 2013). The World Bank (2013) and FAO (2014a) predicts a growth of more than 50% until 2030 (in a conservative/baseline scenario), supplying over 60% of fish destined for direct human consumption. However, a higher development of aquaculture is constrained by different causes, like fishmeal and fish oil prices, global warming and diseases (The World Bank, 2013; FAO, 2014a).
1.2 . Impact of Diseases in Aquaculture
Diseases are one of the most important constraints in aquaculture, especially in intensive fish farming, representing severe annual costs to producers (Murray and Peeler, 2005). The open design of many of the aquaculture systems also allows the transmission of infectious pathogens, where they find ideal conditions to cause a disease outbreak (Balcázar, 2006; Mladineo, 2006). Global warming tends to increase the frequency of the outbreaks and increase the ecological range of the diseases (Diez and Perlado, 2014; FAO, 2015). Parasitic diseases caused by obligate or opportunistic eukaryotic pathogens have a major impact on global finfish and shellfish aquaculture, and in many regions they represent a key constraint to production, sustainability and economic viability of aquaculture facilities (Shinn et al., 2014).
Introduction
In Southern Europe, especially in the Mediterranean area, amyloodiniosis is a parasitic disease that represents a major threat for semi-intensive aquaculture, and is one of the most serious impediments for the production of several warm water aquaculture species, with severe economic costs associated (Noga, 1996). For example, according to Shinn et al. (2014), in 2004 a reported case of Amyloodinium ocellatum in a milkfish (Chanos chanos) hatchery had a total loss cost of 20,000 USD, or an A. ocellatum outbreak reported by Soares et al. (2012) in an earthen pond in Portugal with gilthead sea bream (Sparus aurata) and meagre (Argyrosomus regius), in which Shinn et al. (2014) calculated a total cost loss of 4170 USD. This aetiological agent is one of the most common and important parasitic dinoflagellate in fish.
1.2.1. Dinoflagellates as Aetological Agents
Dinoflagellates are commonly found in aquatic ecosystems. They are important primary producers and consumers, as well as endosymbionts in many invertebrates (Taylor, 1987; Fensome et al., 1993). Many dinoflagellates produce ichthyotoxins, which have caused mass mortalities in wild and cultured fish (Rensel and Whyte, 2003). About 140 of the approximately 2000 known living species are parasites, most being parasites of invertebrates (Drebes, 1984). Five genera have been reported as fish parasites: Amyloodinium, Piscinoodinium, Crepidoodinium, Ichthyodinium and Oodinioides (Buckland-Nicks & Reimchen, 1995). Only Amyloodinium, Piscinoodium and Ichthyodinium are of any known or potential economic significance.
A. ocellatum is the most common and important dinoflagellate parasitizing fish (Becker, 1977; Lawler, 1980; Lauckner, 1984; Noga, 1996), and is one of the few fish parasites that can infest both elasmobranchs and teleosts (Lawler, 1980), and almost all fish that live within its ecological range are susceptible to infestation. This parasite can also hyperparasite some parasites of fish like Neobenedenia melleni (Monogenea: Capsalidae) in gilthead sea bream (Colorni, 1994), and inflict moderate to intense tissue reaction in several commercially important shrimp species (Aravindan et al., 2007) and bivalves like the pacific oyster (Crassostrea gigas) (Sousa, 2015). Some aquaculture reared species affected by A. ocellatum are present in Table 1.1.
Introduction
Table 1.1 - Some aquaculture species affected by Amyloodinium ocellatum
Fish species Occurence Reference
Gilthead sea bream (Sparus aurata) Mediterranean Sea, Israel, Red
Sea
Paperna and Baudin Laurencin (1979); Colorni (1989); Woo et al. (2002); Rigos and Troisi (2005); Pereira et al. (2010)
Mahimahi/dolphinfish (Coryphaena hippurus) The Ocean Institute (1996)
Groupers Asia, North America Chong and Chao (1986); Tseng and Ho (1988)
Red drum (Sciaenops ocellatus) North Carolina,U.S.A Johnson (1988); Gallet de Saint Aurin (1989); Noga et al. (1991)
Tilapia (Oreochromis sp.) U.S.A Plumb (1997a); Tonguthai and Chinabut (1997); Shoemaker et al. (2006)
Barramundi (Lates calcarifer) Pacific Ocean Owens (2003); Rimmer (2003)
Striped Bass (Morone saxatilis) and Striped Bass hybrids
U.S.A Paperna and Zwerner (1976); Noga et al. (1991); Plumb (1997b)
Sea bass (Dicentrarchus labrax) Caribbean Sea, Mediterranean Sea
and Spain
Paperna and Baudin Laurencin (1979); Gallet de Saint Aurin (1987); Alvarez-Pellitero et al. (1993); Woo et al. (2002); Rigos and Troisi (2005)
Guppies (Poecilia reticulata) U.S.A Lawler (1980); Noga and Bower (1987); Kuperman and Matey (1999)
Turbot (Scophthalmus maximus) Portugal Saraiva et al. (2011)
White seabream (Diplodus sargus) Mediterranean Sea Soares et al. (2011)
Two-banded sea bream (Diplodus vulgaris) Mediterranean Sea Soares et al. (2011)
Sharpsnout sea bream (Diplodus puntazzo) Mediterranean Sea Rigos et al. (1998); Soares et al. (2011)
Black sea bream (Spondyliosoma cantharus) Adriatic Sea Ivona (2006)
Western Atlantic seabream (Archosargus
rhomboidalis)
Venezuela Zambrano and Villalobos (2000)
Senegalese Sole (Solea senegalensis) Mediterranean Sea Soares et al. (2011)
Milkfish (Chanos chanos) Philippines Cruz-Lacierda et al. (2004)
Mangrove red snapper (Lutjanus argentimaculatus) Philippines Cruz-Lacierda et al. (2004)
Brazilian Flounder (Paralichthys orbignyanus) Brasil Lawler (1980); Landsberg et al. (1994); Abreu (2005)
Bullseye puffers (Sphoeroides annulatus) Caribbean Sea Gaspar (1987); Fajer-Ávila et al. (2003)
Meagre (Argyrosomus regius) Portugal Soares et al. (2012)
Snappers Chong and Chao (1986); Tseng and Ho (1988)
Mullet (Mugil cephalus) Atlantic Ocean Baticados and Quinitio (1984); Noga et al. (1991)
Pacific threadfin (Polydactylus sexfilis) Phillipines Ostrowski and Molnar (1998); Montgomery-Brock et al. (2001)
Yellowtail (Seriola dumerili) Sicilia, Mediterranean Sea Aiello and D’Alba (1986)
Cobia (Rachycentron canadum) Reed and Francis-Floyd (1994)
Ayu (Plecoglossus altivelis) Australia Fielder and Bardsley (1999)
Mulloway (Argyrosomus japonicus) Thailand Chonchuenchob et al, (1987)
Pompano (Trachinotus carol) U.S.A Lawler (1977); Noga et al. (1991)
Spotted Seatrout (Cynoscion nebulosus) U.S.A Masson et al. (2011)
Spotted Scat (Scatophagus argus) Phillipines Cruz (1998); Lio-Po and Barry (1988)
Australian snapper (Pagrus auratus) Australia Booth et al. (2012)
Red Snapper (Lutjanus campechanus) U.S.A Masson et al. (2011)
Slender seahorse (Hippocampus erectus) U.S.A Gomezjurado (2009)
Indian halibut (Psettodes erumei) India Kizhakudan et al. (2014)
Silver pompano (Trachinotus blochii) India Kumar et al. (2015)
Fenneropenaeus indicus India Aravindan et al. (2007) Macrobrachium rosenbergii India Aravindan et al. (2007) Penaeus monodon India Aravindan et al. (2007) Penaeus semisulcatus India Aravindan et al. (2007) Macrobrachium malcomsonii India Aravindan et al. (2007)
Introduction
Amyloodinium has continued to be one of the most serious impediments to warmwater mariculture, with well over one hundred species known to be susceptible. It can cause serious morbidity and mortality in brackish and marine warmwater food fish at aquaculture facilities worldwide and is often considered the most consequential pathogen of marine fish (Paperna et al., 1981). Outbreaks can occur extremely rapidly, resulting in 100% mortality within a few days. Even freshwater fish are highly susceptible to infestation when they´re reared in saline waters (Lawler, 1980; Noga and Bower, 1987; Kuperman and Matey, 1999).
A. ocellatum can appear in different types of rearing tanks and systems, like salt pans, semi-intensive earthen ponds, cement tanks, glass fibre tanks and even in cages (gilthead sea bream, sharpsnout sea bream (Diplodus puntazzo), black sea bream (Spondyliosoma cantharus) and sea bass (Dicentrarchus labrax) outbreaks in sea cages in Adriatic sea) (Rigos et al., 1998; Rigos and Troisi, 2005; Ivona, 2006; Abowei et al., 2011). Additionally, dinospores of A. ocellatum could travel in aerosol droplets (up to 440 mm in a static system and up to 3 m in adynamic one). This is the first record of this transmission pathway for a marine protozoan parasite (Roberts-Thomson et al., 2006).
The disease, amyloodiniosis, is a major bottleneck for semi-intensive aquaculture production in Southern Europe because it affects the majority of fish farms, causing extremely high mortalities. It’s a “quiet” disease because usually when the fish-farmer finds out that the fish is contaminated it is already too late and they do not respond to treatment (Soares et al., 2011).
1.3. Characterization of the Pathogen
1.3.1 Taxonomy
As previously written, A. ocellatum is a dinoflagellate that parasites fish (Becker, 1977; Lawler, 1980; Lauckner, 1984; Noga, 1996). A study made by Murray et al. (2005), using rRNA (ribosomal RNA), indicates that A. ocellatum is closely related with Pfiesteria piscicida. Saldarriaga et al. (2004) and Ki et al. (2012) (Figure 1.1), puts A. ocellatum in the Blastodiniales order, but phenotypical characteristics puts him near the order Peridiniales, which is in agreement with Landsberg et al. (1994), Steidinger et al. (1996) and Fensome et al. (1999). Some studies have suggested that there may be more than one species or strain of Amyloodinium (Lom and Lawler, 1973, Lawler, 1980, Noga et al., 1991).
Introduction
Figure 1.1 - Phylogenetic tree representing the order and phylogenetic proximity of
Amyloodinium ocellatum (Adapted from Ki et al., 2012)
1.3.2 Life Cycle
Biologically A. ocellatum is a dinoflagellate with a life cycle that comprises three stages: trophont (parasitic state); tomont (encapsulated state, a cyst that develops after the trophont leaves the fish); and dinospores (free living state, released from the tomont) with 6.1±0.8 microns length 11.7±0.5 microns in width (Landsberg et al., 1994) The actively feeding parasitic trophont is attached to fish gills and skin; the reproductive encysted tomont is inserted into sediments; and the free-swimming infective dinospores develop after the tomonts divide (Kuperman and Matey, 1999; Woo, 2007) (Figure 1.2). Each tomont can produce up to 256 dinospores in three days at 25 ºC, each one capable to infect a new host and produce a trophont
Introduction
(Brown and Hovasse, 1946). Dinospore production and infectivity occur over a broad range of temperatures (16 to 30°C) and salinities (10 to 60 psu) (Paperna, 1984). The reproductive rate is very fast completing its life cycle in less than a week in optimal conditions.
Figure 1.2 - Life cycle phases of Amyloodinium ocellatum
1.3.3 Clinical Signs and Diagnostics
The symptomatology is characterized by changes in fish behaviour, with jerky movements, swimming at the water surface and decreased appetite (Soares et al., 2011). These may include increased respiratory rate (rapid gilling and movement of the opercula), “piping,” and gathering at the surface or in areas with higher dissolved oxygen concentrations, as well as reduced appetite. If the primary site of infection is skin, infected fish sometimes develop a white or brown coloration (“velvet”) or cloudy appearance, which is most visible when viewed with indirect lighting such as a flashlight (Levy et al., 2007). Such fish may display signs of “flashing” or rubbing on tank walls, the substrate, or other structures in their environment.
Introduction
Again, feeding behaviour likely will be poor and some fish may appear emaciated (Francis-Floyd and (Francis-Floyd, 2011). The method of diagnostic is the identification of the trophont in the skin and gills of infected fish, which can be done through microscope observation of these tissues (Figure 1.3).
Figure 1.3 – A - Amyloodinium ocellatum trophonts in meagre (Argyrosomus regius) gills
(40x) B- Amyloodinium ocellatum tomonts detach from meagre (Argyrosomus regius) gills (100x) (Adapted from Soares et al., 2012)
Fish mortalities are normally attributed to anoxia (associated with serious gill hyperplasia, inflammation, haemorrhage and necrosis) in heavy infestations (Lawler, 1980). However, there are high mortalities associated with mild infestations that, according to Noga (2012), could be associated with osmoregulatory impairment and secondary microbial infections due to severe epithelial damage. Physiological information about the responses from the host to A. ocellatum infestation are limited, and are mainly available in some publications about antimicrobial protein expression in gills and skin (Colorni et al., 2008; Noga et al., 2009; Corrales et al., 2010; Noga et al., 2011) and general immunological responses of the host to A. ocellatum (Smith et al., 1992; Smith et al., 1994., Noga et al., 2002; Woo, 2007; Alvarez-Pellitero, 2008; Woo & Ardelli, 2014). However, information regarding other physiological responses are very rare.
Trophonts are ovoid with 150-350 microns (Lom and Diková, 1992). Gills are first to be infected. Tomonts are occasionally observed in the intestinal tract. Subclinical infestations by phase-free dinospores can go unnoticed since they are not yet identified by expedite methods, although some studies have been done in this field (Levy et al., 2007). Fish that are recovering from spontaneous Amyloodinium infestation or that have been experimentally exposed to
Introduction
parasite antigen may produce serum antibody that is detectable by ELISA or dinospore agglutination assay (Smith et al., 1992; Cobb et al., 1998 a,b; Cecchini et al., 2001). Such assays might be useful for monitoring levels of protection in susceptible populations and detect subclinical infestations, since elevated antibody titres have been associated with resistance (Cobb et al., 1998 a, b).
As one stage of its life cycle is free (dinospores), its observation under a microscope to assess the presence in the water column is impractical in fish farms. In this sense the technique for detection of dinospores (free phase) in water based on the PCR technique is a sensitive and specific method for detecting a low number of individuals (Levy et al., 2007) and can be used in an environmental monitoring program in aquaculture, as an effective control of this disease involves the ability to detect an infestation in a primordial state to take effective control measures (Soares et al., 2011).
1.4 Treatments, Prevention, Control and Prophylaxis
A. ocellatum is a virulent parasite and outbreaks must be treated as quickly as possible to avoid high mortalities. Attempts to eliminate A. ocellatum at its different life states using different methods and therapies show some progress.
A. ocellatum tolerate a wide range of temperature and salinity, which make the control of this disease by physical and chemical parameters manipulation very difficult. Inhibition of growth of the parasite can be achieved in temperatures below 15°C (Paperna, 1984) and reduced salinities. Lowering the temperature to 15°C arrests the disease process, but this is almost never feasible. Lowering salinity delays but does not prevent infestations (Barbaro and Francescon, 1985), unless fish are placed in fresh water. A short freshwater bath of up to 5 min dislodges most but not all trophonts (Kingsford, 1975; Lawler, 1977b).These are measures that cannot be used in cropping systems that use earthen ponds (tanks of large dimensions, 0.4 to 1 hectare and bigger) and species that do not tolerate wide variations in salinity, as is the reality of most southern European aquaculture. A recent study by Pereira et al. (2011) indicates that the water quality kept within production ponds with a defined fish stock density and a good water renewal rate can avoid the A. ocellatum infestation in seabream.
The free living state (dinospores) are susceptible to chemotherapy (Lawler, 1980; Paperna, 1984), but the parasitic and encapsulated state of trophont and tomont are difficult to eradicate
Introduction
or treat (Soares et al., 2011). The most common treatment in controlling and eliminating this parasite is copper in the form of copper sulfate, a chemical widely used in agriculture. Tomonts tolerate levels of copper at concentrations 10 times higher than levels that are toxic to dinospores (Paperna, 1984). A further option is a mixture of 5-hydrate copper sulphate with citric acid monohydrate, to yield 0.15 ppm copper ion concentration in the water (Kabata, 1985). During copper treatments the active component is the copper ion that must be kept in water at 0.15 to 0.2 mg/L for 10-14 days to control the epidemic. High concentrations of copper should be avoided since it is toxic to fish. The free copper is unstable in water and levels should be monitored in order to be maintained at the desirable concentration. It should be noticed that at high water temperatures (25 to 30ºC) the diseases and consequently the treatment with copper sulphate may last for more than a month which, linked to the high cost of the product, may jeopardize the commercial viability of a fish farm (Soares et al., 2011).
On the other hand treatments with formaldehyde in concentrations of 100-200 mg/L during 6 to 9 hours, act over the trophont stage that detached from the fish. The most successful medical approaches have involved repeated treatments, often followed by removal of the fish to an uncontaminated tank. For example, treatment of juvenile bullseye puffers (Sphoeroides annulatus) in sea water with 51 mg/L formalin for 1 hr or 4 mg/L formalin for 7 hr significantly reduced A. ocellatum load on the skin and gills. Reinfestation occurred after 15 days but was controlled by repeating the treatment (Fajer-Ávila et al., 2003).
Treatment with hydrogen peroxide to 75-150 mg/L was effective in eliminating trophonts in pacific threadfin (Polydactylus sexfilis) (Montgomery-Brock et al., 2001). All treatments must be continued long enough to be effective, but is still necessary to have a very tight control by testing the fish for potential re-infestation.
Many other chemicals, such as chloroquine diphosphate, have been tested in the treatment of this parasite, but without satisfactory results. But tests done with, N-methylglucamine lasalocid, completely inhibited dinospore emergence at concentrations as low as 0.01 mg/L, in vitro. Treatment of infestations on red drum fry for 24 hr with 0.10 mg/L reduced gill infestation intensity by 80% and none of the fish treated with 1 mg/L had any signs of infestation (Oestmann and Lewis, 1996).
For biological control of this disease, a biocontrol strategy was proposed by Oestmann et al. (1995), based upon the observation that larval brine shrimp (Artemia salina) readily prey on
Introduction
dinospores. All dinospores were eliminated after 8 hr in an in vitro assay at a ratio of 8 nauplii/ml and 10,000 dinospores/ml (1 nauplius/1250 dinospores). Adding nauplii prior to experimental challenge of fish also reduced, but did not eliminate, the infestation. There are also new experiments with plant products (Harikrishnan et al., 2011).
Another route that is getting some results is the immunostimulation of fishes (Noga et al. 2001; Ewart & Tsoi (2004); Ullal et al., 2008; Noga et al., 2009; Corrales et al., 2010; Noga et al., 2011), with special attention to H2B histones and other antimicrobial peptides (AMP) that are present in most of the reared species. For example, the use of Debaryomyces hansenii live yeast has improved the resistance of juvenile leopard grouper Mycteroperca rosacea to Amyloodinium ocellatum (Reyes-Becerril et al., 2008). There is also investigation to get a vaccine for this parasite. The grouper Epinephelus coioides was immunized with a low dose of Cryptocaryon irritans theronts and manifested acquire protective immunity (Yambot and Song, 2006), suggesting the promise of immunization against A. ocellatum.
In terms of risk prevention the introduction of dinospores in aquaculture systems can be prevented by treating the intake water with ultraviolet (UV) (Lawler, 1977). However this method is only possible in closed systems such, and for maintenance of ornamental fish in aquaria. In the case of the Portuguese aquaculture production which is mostly done in open systems in tanks ranging 0.4 to 1 hectare, the water treatment with UV is impractical. Moreover the use of UV does not sterilize the pond sediment where tomonts remain. In open systems prevention is only possible by the close monitoring of the presence of the parasite on fish during optimal periods of growth and by avoiding stressful situations in fish. When fish are subjected to stress the parasite can quickly increase and cause heavy mortalities. Routine hygiene procedures, like the elimination of dead fish from culture tanks should be followed (Soares et al., 2011).
1.5 Stress and Osmotic Indicators
Marine animals including fish are very sensitive to stressors in the nature and artificial aquaculture conditions (Iwama, 2006). Some aquaculture studies describes that chronic and acute stress is associated with many aspects regarding to biochemical or physical perturbations
Introduction
and have physiological effects on the organisms (Kubilay and Ulukoy, 2002; Vijayan et al., 2009).
There are different definitions for stress. Cannon (1935) defined for the first time the "homeostasis" theory. Selye (1950) postulated the theory of non-specific physiological response to stressors, where he divided all reactions of stressors in 2 parts: reaction in terms of special stressors or reaction associated with general stressors with no special focus on the stressor in advance. Later on, McCarty et al. (1996) said that stress is a non-specificity biological reaction or no specificity response of animals to any stressors in emergency periods.
The origin of stressors can be divided into:
1. Biological stressors due to parasites (Landsberg et al., 1998), and high organism density;
2. Chemical stressors created by spilling contaminants into the water, abiotic environmental stressors (Van Weerd and Komen, 1998), nitrogen, and faeces (Askarian and Kousha, 2006).
3. Physical stressors such as capture (Bolasina, 2011), thermal fluctuations, crowding or density (McCormick et al., 1998; Bolasina, 2011), low water quality (Santos et al., 2010), water-soluble gases, light, water pressure, feed intake in relation to feed conversion ratio (FCR) and noisiness (Askarian and Kousha, 2006). The input water quality monitoring has an important role to prevent physical stressors such as periodic decrease of dissolve oxygen or increasing of CO2 (Person-Le Ruyet et al., 2002).
Numerous studies have been made on stress and biological relationships in marine animals. Most of the studies states that cortisol and glucose are the most prevalent stress indicators (Einarsdóttir and Nilssen, 1996; Einarsdóttir et al., 2000; Olsen et al., 2008; Fernandes de Castilho et al., 2008; Martinez-Porchas et al., 2009) that can affect the fish physiological activities as well as increasing of cardiac output and gill vascularity along with glycogenolysis with activation of "brain-sympathetic-chromaffin cell axis" (Nolan et al., 1999; Olsen et al., 2008).
Introduction
Activation of hypothalamus-pituitary gland-gonad axis (Carragher et al., 1989; Pottinger and Mosuwe, 1994) with release of catecholamines (Einarsdóttir and Nilssen, 1996) such as epinephrine, adrenaline (Martinez-Porchas et al., 2009), norepinephrine (Askarian and Kousha, 2006), glucocorticoid steroid hormones (Vijayan et al., 2009) and corticosteroid hormones within bloodstream (Weirich, 1997; Martinez-Porchas et al., 2009) have been the subject of different studies.
If stress occurs, the activation of the stress system is characterized by different stages of responses:
1. Alarm, primarily with an increase in plasma cortisol and catecholamines via neuro-physiological axis that are called the hypothalamic-pituitary-interrenal (HPI) axis (Vijayan et al., 2009);
2. Resistance, secondarily with the enhancement of plasma metabolites (i.e. glucose and lactate) and a reduction of the tissue reserves (i.e. glycogen); 3. Exhaustion, with reductions in several physiological and immunological
processes (growth, reproduction and others) (Wedemeyer et al., 1990; McCarty et al., 1996; Wendelaar Bonga, 1997; Askarian and Kousha, 2006).
Vital functions of animals, including fish, depend on the income of oxygen from the environment to the organism. Fish possess mechanisms to cope with the demands for oxygen and adapt to variations in the environment, in terms of its availability (Martemyanov, 2013; Martemyanov, 2015). Elevation of sodium in erythrocytes is observed at the adaptation of fish to oxygen deficiency, which occurs owing to the decrease in its solubility in water when water temperature rise (Martemyanov, 2009). During the initial stage of stress, the levels of catecholamines in blood increase considerably (Mazeaud et al., 1977; Mazeaud and Mazeaud, 1981); increasing the demands for oxygen (Klyashtorin and Smirnov, 1981; Aardt and Booysen, 2004; Fu et al., 2007).
There is an hypothesis that the functions of Na+/H+ countertransport enhances in stress conditions, due to catecholamines that increase the oxygen carrying capacity of fish erythrocytes. This could be measured with different analysis, like pH and osmolarity (Thomas and Perry, 1992; Wendelaar Bonga, 1997; Perry and Bernier, 1999).
Introduction
1.6 Proteomic Analysis
In recent years there has been developed a large amount of largescale approaches in biology that promise to revolutionize systems-level understanding of cellular and organism functions. These fields, referred to as ‘‘omics’’ (Joyce and Palsson 2006), can assess the structure and functioning of organisms with a comprehensive and unprecedented level of detail. Amongst these one of the most promising as a potentially new approach to conventional methods is the field of Proteomics (Alves et al., 2010).
Proteomics is the global study of protein abundance and modification patterns (Dowd, 2012), and can represent an alternative strategy to investigate the protein expression pattern of an organism, using a cross-species database for mass spectrometry data interpretation (Cui et al., 2013). The increasing interest in proteomics technologies is because information of DNA sequence, mRNAs and transcriptional activity provides only a static snapshot of the various ways in which a cell might use its proteins, whereas the life of the cell is a dynamic process (Kvasnička, 2003).
Protein profiling investigations involve the separation of complex protein mixtures followed by the analysis of those proteins that exhibit altered expression, and may continue with the identification of the proteins of interest. This involves the use of peptide mass and isoelectric point (pI) information in bioinformatic databases (UniProt, Mascot, and others), often in combination with additional techniques such as N-terminal sequencing, posttranslational modifications (phosphorylation, glycosylation, ubiquitination, and others), and peptide mass fingerprinting. Once identified, protein expression changes can be confirmed using additional techniques, like immunohistochemistry, western blotting or DNA and mRNA expression analysis (Jenkins and Pennington, 2001; Wetmore and Merrick, 2002).
Proteomics has an ability to potentially provide a qualitative and quantitative snapshot of the functional entities of a cell or body fluid under a particular set of conditions (Hogstrand et al., 2006; Cox and Mann 2011; Tomanek, 2011). This field can potentially have two main outcomes: to assess the abundances, modifications, and interactions of all proteins present in a sample and determine how these can change through the time of the experiment, and as
Introduction
consequence, to reveal novel and integrative functional responses of organisms to diverse environmental challenges, over a variety of time scales and at different levels of organization. However, they are yet largely unrealized, since the first of these has been unfulfilled mainly by technological factors, such as mass spectrometer scanning rates (Mulvey et al., 2010) or techniques for separation of native proteins (Monti et al., 2009). The second is frequently limited by excessive costs or limited access to instruments, shortages of genomic sequence information, incomplete knowledge of protein structure and function, or insufficient analytical methods to interpret the large data sets that are produced (Joyce and Palsson, 2006). Even so, many scientists postulate that the proteome best represents the functional molecular phenotype, because proteins perform most of the molecular work of the cell and constitute a substantial and dynamic component of cellular structures (Dowd, 2012).
The integration of traditional two-dimensional polyacrylamide gel electrophoresis (2D PAGE) with sensitive mass-spectrometric analysis methods and modern bioinformatics tools has greatly fostered the development and application of a new field of research called proteomics (Brunt et al., 2001).
Two-dimensional gel electrophoresis (2DE) is still one of the most important techniques in proteomic analysis, mostly due to its high performance regarding the separation of complex mixtures of full-length proteins. Two-dimensional polyacrylamide gel electrophoresis (2D PAGE) has been used since the late 1960s as a powerful tool to separate proteins and to compare protein expression between controls and diseased or chemically-exposed biological samples (Patton, 2002). The method depends on an optimal separation of proteins by pI in the first dimension, followed by mass in the second dimension, and can be able to resolve up to 2000 protein spots per gel (Herbert et al., 2001; Lilley, 2001; Beranova-Giorgianni, 2003;). It is a gel-based proteomic approach that provides a top-down, comprehensive picture of the total protein expression pattern of a tissue, and enables its comparison among different physiological and pathological states. This is especially valuable when scarce information is available about an organism or tissue proteome (Addis et al., 2010). A typical 2DE-based workflow is composed of several steps, with the final purpose being the identification of proteins that display abundance variations in response to some experimental factor. In order for biologically meaningful results to be obtained, importance must be given to a correct undertaking of all stages of the process (Silva et al., 2014). However, and even if 2DE is a powerful technique, it
Introduction
has several drawbacks, including difficulties of resolving proteins with low (<10 kDa) or high (>4200 kDa) molecular weight, as well as those with an extreme isoelectric point (pI<4 or >10), and low throughput capacity (Beranova-Giorgianni, 2003). There are many proteins that are missed, including very basic or acidic proteins, very small or large proteins, and proteins that are hydrophobic or of very low abundance (Lilley, 2001; Beranova-Giorgianni, 2003).
With the introduction of fluorescent dyes to label samples, three samples could be run on a single gel, eliminating the gel-to-gel variation (Eykmans et al., 2012). The Differential in Gel Electrophoresis (DIGE) methods has increased the standard for this proteomics approach, allowing co-separation of a control set of proteins with proteins isolated from a treatment or disease (Tonge et al., 2001). They use the same principles of 2D gels, but because of fluorescent dyes to label samples, three samples could be run on a single gel, eliminating the gel-to-gel variation. On the other hand, and like the normal 2D gels certain groups of proteins are poorly represented on a 2D gel (membrane proteins, proteins with high molecular weights, hydrophobic membrane proteins, with very low abundance, and others) (Lilley and Dupree, 2006).
Proteomics is one of the new approaches to diseases and epidemiology in fish, giving us an insight on the protein abundance and modification patterns in the organism (Rodrigues et al., 2012; Peng, 2013). Different areas of proteomics use in aquaculture are represented in Figure 1.4.
Introduction
Figure 1.4 - Areas of possible use of proteomics as a tool for investigation in aquaculture
(adapted from Rodrigues et al., 2012)
As we can see, they are used in many different areas research in aquaculture (welfare, nutrition, health, quality, or safety) were proteomics approaches are, by its nature, easily applied to model or non-model species with an increasing success (Rodrigues et al., 2012).
Proteomics is also one of the new approaches to diseases and epidemiology in fish, giving us an insight on the protein abundance and modification patterns in the organism (Rodrigues et al., 2012; Peng, 2013). This can be extremely useful in the study of the functional and physiological responses of fish to the parasite A. ocellatum, giving us a better insight of the mechanisms involved in the process and the identification of possible biomarkers, since protein profiles appear to be specific to particular stressors (Alves et al., 2010; Cox and Mann, 2011).
In the case of this study, proteomics can be extremely useful in the study of the functional and physiological responses of fish to the parasite A. ocellatum, giving us a better insight of the mechanisms involved in the process and the identification of possible biomarkers, since protein profiles appear to be specific to particular stressors (Alves et al., 2010; Cox and Mann, 2011). Between all the proteomes, the plasma proteome is a unique biomarker source since it reflects the global expression of all cellular genomes (Isani et al., 2011) and hence should be a good source of biomarkers in an A. ocellatum outbreak.
Introduction
1.7 Objective of This Work
In this work we will analyse the proteome and relate it with osmoregulatory and stress indicators of gilthead sea bream plasma, in order to enlighten the different physiological responses when exposed to an A. ocellatum outbreak.
Material and Methods
II. Material and Methods
2.1. Experimental Design
One hundred and fourteen gilthead sea breams, with a mean body weight of 87.2±17 gr, were placed in 200 L rectangular plastic tanks (Control – without external parasites, T1 – with A. ocellatum, T2 - with A. ocellatum and other monogenetic ectoparasites) in duplicate, at Aquaculture Research Centre, National Institute for the Sea and Atmosphere (EPPO-IPMA, Olhão, Portugal). Fish were kept at 22±0.2 ºC, in closed recirculation seawater systems, artificial aeration and 24h light photoperiod. Fish were contaminated with tomonts of A. ocellatum obtained from contaminated fish at EPPO – IPMA Aquaculture Research Station.
2.2. Sampling
Two samples of water, one at the beginning and other at the end of the experience, were obtained in order to access the number of dinoflagellates per milliliter in the tanks by the Utermöhl method for quantitative phytoplankton analysis (Karlson, 2010).
Fish contamination was accessed by microscopical observation of a wet mount of the first two branchial arches from two fish killed with a cut in the spine, after 12 and 18h after contamination.
When the contamination reached 500 parasites per branchial arc, 4 random fish from each tank were anesthetized with 2-phenoxyethanol (Sigma Aldrich), and approximately 1 ml of blood was withdrawn using syringes heparinized with 1% EDTA. The blood was centrifuged at 2500 rpm for 10 minutes and plasma was collected and kept at -80ºC for subsequent analysis. Fish
Material and Methods
were killed with an overdose of anesthetic, measured, weighted, liver and spleen weight were annotated for condition index (CI), hepatosomatic index (HSI) and spleen somatic index (SSI). For stress and osmoregulatory parameters, blood was collected into 1ml heparinized syringes from a puncture of the caudal peduncle (25,000 units of ammonium heparin (Sigma H6279)/3 ml saline solution 0.9 % NaCl) from all the remaining fish (N=11) from Control and T1 (T2 is only used as a positive control for proteomic analysis). Plasma was separated from cells by the centrifugation of the whole blood (10 min, 2500 rpm, room temperature), snap-frozen in liquid nitrogen and stored at -80ºC until analysis of osmolarity, pH, hormonal (cortisol) and metabolic (glucose, lactate, and total protein concentrations) parameters. From each fish, the second gill arch on the dorsal side was removed, dried with an absorbent paper and 3–5 filaments were cut using fine-point scissors. Biopsy samples were placed into 100 µl of ice-cold sucrose-EDTA-imidazole (SEI) buffer (150 mM sucrose, 10 mM EDTA, 50 mM sucrose-EDTA-imidazole, pH 7.3) and frozen at -80ºC until analysis.
2.3. Stress and Osmoregulatory Indicators
2.3.1 Analytical Procedures
Plasma glucose and lactate levels were measured using commercial kits from Spinreact (Glucose-HK Ref. 1001200; Lactate Ref. 1001330) adapted to 96-well microplates. Plasma proteins were determined in diluted plasma samples 1:5 (v/v) with the QCA Total Proteins kit (Química Clínica Aplicada S.A., Barcelona, Spain). All assays were performed with a Tecan Sunrise microplate reader, using Magellan v2.5 software for Windows (Tecan Austria, Salzburg). Plasma cortisol levels were quantified with an ELISA kit (EA65, Oxford Biomedical Research, MI, USA) modified and adapted to fish, according to Herrera et al. (in press). Cortisol was extracted from 20 μl plasma in 200 µl diethyl ether. The lower limit of detection (81% binding) was 0.1 ng/ml plasma.
Osmolarity of the plasma samples were analyzed with a cryo-osmometer (OSMOMAT 030, Gonotec), and pH was determined with a pH portable device (pH Spear, Oakton®, Eutech
Material and Methods
2.4. Statistical Analysis
The data were statistically analysed with IBM SPSS Statistics for Windows, Version 21.0. (IBM Corp. Released 2012. Armonk, NY: IBM Corp).
2.5. Proteomics
2.5.1 Strip pH Range Selection
Prior to protein separation, quantification of protein was performed using the Bradford assay (Bio-Rad), using bovine serum albumin as standard. Two-dimensional difference gel electrophoresis was used to separate proteins according to their isoelectric point (pI) in the first dimension and their molecular weight (Mw), considered as second dimension.
Proteins from one of the treatments were used and rehydration buffer (6M urea, 2M thiourea, 4% CHAPS, 0.02 % (w/v) DTT, 0.002% bromophenol blue, 0.5% (v/v) IPG buffer pH 4-7) was added to complete 450 µl. Rehydration was performed passively for 14 hours using IPG box (GE Healthcare).
For the best pH range selection, different ranges were tested. We used a 24 cm Immobiline™ DryStrips (GE Healthcare) linear pH 3-10, a 24 cm Immobiline™ DryStrips (GE Healthcare) with linear pH 4-7 and a 7 cm Readystrip (Bio rad) pH 7-10.
The isoeletric isoelectric focusing (IEF) was made in 5 steps:
Strip pH 3-10: at 500V gradient 1 hr, at 500V step-n-hold 1 hr, at 1000V gradient 1 hr, at
8000V gradient 3 hrs, and at 8000V step-n-hold for a total of 60000 Vhr.
Strip pH 4-7: at 500V gradient 1 hr, at 500V step-n-hold 1 hr, at 1000V gradient 1 hr, at 8000V
gradient 3 hrs, and at 8000V step-n-hold for a total of 60000 Vhr.
Strip pH 7-10: at 100V step-n-hold 2 hr, at 200V step-n-hold 2 hr, at 500V step-n-hold 2 hr, at
1000V step-n-hold 2 hr, at 2000V step-n-hold 2 hr, at 4000V step-n-hold 2 hr, and at 5000V step-n-hold for a total of 60000 Vhr.
Before second dimension, strips were reduced and alkylated using 6 ml of an equilibration buffer (1.5M Tris-HCl pH 8.8, 6M urea, 30% (v/v) glycerol, 0.007M SDS, a few grains of
Material and Methods
bromophenol blue) with 1% (w/v) DTT or 2.5% (w/v) iodoacetamide respectively for 15 min each. Strips were loaded onto 12.5% Tris-HCl SDS-PAGE gels and run in an Ettan DALTsix Vertical System (for the 24cm strips) or mini-Protean cell (Bio-Rad) for the 7 cm strip, at 10 mA/gel for 1 hour followed by 60 mA/gel using a standard Tris-Glycine-SDS running buffer, until the bromophenol blue line reaches the end of the gel.
The gels were then stained with colloidal Coomassie blue, scanned and analysed.
2.5.2 Protein Labeling for DIGE
Prior to protein separation, quantification of protein was performed using the Bradford assay (Bio-Rad), using bovine serum albumin as standard. Two-dimensional difference gel electrophoresis was used to separate proteins according to their isoelectric point (pI) in the first dimension and their molecular weight (Mw), considered as second dimension, using fluorescent dyes. Samples were adjusted to pH 8.5 with 0.1 M NaOH and 50 µg of proteins were minimally labelled with 400 pmol of fluorescent amine reactive cyanine dyes freshly dissolved in anhydrous dimethylformamide following manufacturer’s instructions (5 nmol labelling kit, GE Healthcare). Labelling was performed on ice for 30 minutes in the dark and quenched with 1 mM of lysine for 10 min. Four samples per dietary treatment were labelled with Cy3 and four with Cy5 to reduce impact of label differences, while an internal standard consisting of equal amounts of protein from all samples was labelled with Cy2.
2.5.3 Protein Separation by 2D Gel Electrophoresis
Labelled proteins from each dietary treatment plus 50 µg of internal standard were mixed together and rehydration buffer (6M urea, 2M thiourea, 4% CHAPS, 0.02 % (w/v) DTT, 0.002% bromophenol blue, 0.5% (v/v) IPG buffer pH 4-7) was added to complete 450 µl. Rehydration was performed passively for 14 hours using IPG box (GE Healthcare) on 24 cm Immobiline™ DryStrips (GE Healthcare) with linear pH 4-7, continued by isoelectric focusing (IEF) in 5 steps: at 500V gradient 1 hr, at 500V step-n-hold 1 hr, at 1000V gradient 1 hr, at 8000V gradient 3 hrs, and at 8000V step-n-hold for a total of 60000 Vhr. Before second dimension, strips were reduced and alkylated using 6 ml of an equilibration buffer (1.5M Tris-HCl pH 8.8, 6M urea, 30% (v/v) glycerol, 0.007M SDS, a few grains of bromophenol blue) with 1% (w/v) DTT or 2.5% (w/v) iodoacetamide respectively for 15 min each. Strips were loaded onto 12.5% Tris-HCl SDS-PAGE gels and run in an Ettan DALTsix Vertical System at
Material and Methods
10 mA/gel for 1 hour followed by 60 mA/gel using a standard Tris-Glycine-SDS running buffer, until the bromophenol blue line reaches the end of the gel.
2.5.4 Gel Image Acquisition, Analysis and Statistics
Gels were scanned on a Typhoon scanner 9400 (GE Healthcare) using three laser emission filters (520BP40 for Cy2, 580BP30 for Cy3 and 670BP30 for Cy5) at 100 µm resolution. Images were analyzed with SameSpots (Totallab, United Kingdom) with filters for average normalized volume ≤ 10,000 and spot area ≤ 500. All the significantly different spots (p<0.05 by ANOVA and a frequency discovery rate (FDR)) resultant of protein abundance data (expressed in relation to the internal standard) that presented differences between T1 and the other treatments, and the spots with higher average normalized volume that presented differences between T1 and T2 versus control were manually excised from preparative gels stained with colloidal Coomassie blue.
2.5.5 Protein Identification by MS Analysis of Peptides and Database Search
The proteins of the previously selected spots were identified by LC-MS/MS. Proteins were broken up into peptides by tryptinization, using the following methodology: Spots of interest were washed in 200 µl of 100 mM ammonium bicarbonate for 30 minutes to 1 hour on a shaker. Wash was discarded and 200 µl of 50% acetonitrile / 100 mM ammonium bicarbonate was added for 30 minutes to 1 hour on a shaker. Wash was discarded and 50 µl acetonitrile was added to the spots and left to actuate for 10 minutes. Solvent was discarded and spots are dried on a vacuum centrifuge for at least 30 minutes. Twenty µl of trypsin was added to each spot and allowed to digest overnight at 37ºC. After digestion 20 µl of 5% FA acid is added to the gel pieces and left to incubate on a shaker for 20 minutes. Forty µl of acetonitrile was added and left again on a shaker for 20 minutes. Liquid was transferred to a new microplate and dried on a vacuum centrifuge for a couple of hours.
Then the obtained peptides were electrosprayed into the mass spectrometer using a quadrupole and subsequently an orbitrap connected to an LC ultimate 3000 nanosystem (Waters). The flow rate of the loading pump was 25 µl/min, at 37ºC, 44.7 bar. The resulting MS/MS data were used
Material and Methods
as input in the SEQUEST software using the Actinopterygii subset of the NCBInr database. These searches were performed assuming the formation of single-charged peptides, carbamidomethylation of cysteine residues, possible oxidation of methionine residues and up to 1 missed cleavage. Mass tolerance was 10 ppm for MS data and 0.5 Da for MS/MS data.
Results
III. Results
. Dinospore Counting and Branchial Analysis
The dinospore counts in the water from the different treatments are indicated in Figure 3.1.
Figure 3.1 - Amyloodinium ocellatum dinospores concentration in the water from different
treatments, T1, T2 and Control (N=11, Error bars= standard deviation).
The number of dinospores per ml in T1 and T2 tanks was very high, indicating a large potential infective population of parasites present in the tanks. No parasites were found in the control tank.
After 18 hours, the observation of the branchial arches indicated that Control tanks had no A. ocellatum trophonts in the gills. T1 had a total of 497.25±14.50 A. ocellatum trophonts per branchial arc, and T2 had 50.52±10.96 monogeneans (mainly Dactylogirus sp.) and 79.13± 20.71 A. ocellatum trophonts per branchial arc. In figure 3.2 there are some images of gilthead sea bream branchia from the Control, T1 and T2.
5 5,1 5,2 5,3 5,4 5,5 5,6 5,7 5,8 5,9 0 hours 18 hours D in o sp o re s p e r m l ( x10 3) Control T1 T2
Results
Figure 3.2 - Images of gilthead sea bream (Sparus aurata) branchia from the different
treatments: Control (A, 40x amp.), T1 (B, 40x amp.) and T2 (C, 40x amp.) after 18h of exposition to an Amyloodinium ocellatum outbreak. The red arrows point out the Amyloodinium ocellatum trophonts and the green circle the monogenean parasite
Results
These results assure that there was no cross-contamination to the Control tanks, and that the parasite populations for T1 and T2 are the expected for the experiment. However, the lower number of A. ocellatum trophonts was unexpected.
Condition Index, Hepatosomatic Index, Spleen Somatic Index
The result of IC, HSI and SSI are represented in figure 3.3.Figure 3.3 - Gilthead sea bream (Sparus aurata) IC (A), HSI (B) and SSI (C) values in
Control and T1 after 18h of exposition to an Amyloodinium ocellatum outbreak (N=11, Error bars= standard deviation).
The graphics above indicate that there are no significant differences (p<0.05) between control and T1 at 18h in gilthead sea bream exposed to A. ocellatum on IC, HSI and SSI.
A B
Results
Stress, Metabolic and Osmotic indicators
The results of the different stress and osmoregulatory indicators analysed are indicated in Figure 3.4.
Figure 3.4 - Gilthead sea bream (Sparus aurata) osmolarity (A), pH (B), Glucose (C), Lactate
(D), Cortisol (E) and Total protein (F) levels in Control and T1 after 18h of exposition to an Amyloodinium ocellatum outbreak. (N=11, Error bars= standard deviation. The asteriscus (*)
marks the test where is statistical difference between treatments).
A B
C D
E * F