CREATING AN EMPLOYER BRAND INDEX
Rati Bhavna Sahti
Dissertation submitted as partial requirement for the conferral of
Master of Science in Human Resource Management and Organizational Consultancy
Supervisor:
Prof. Nelson Ramalho, ISCTE Business School, Department of Human Resources and Organizational Behaviour
ii Master Dissertation
ISCTE –IUL
MSc. Human Resource Management & Organizational Consultancy Student: Rati Sahti
Student number: 80629
Supervisor: Prof. Nelson Ramalho Date: 26-09-2019
iii
Acknowledgement
I would like to firstly express my gratitude to my supervisor Prof. Nelson Ramalho, who supported me continuously throughout this study. Thank you for your advice, help and sharing your knowledge. Your guidance made me able to complete this study.
I also would like to take the opportunity to thank the respondents for their participation. It was a difficult process, but I am very thankful for those who took the time to participate.
Last but not least, I really appreciate the support I got from my parents, family members, boyfriend and friends. Thank you all for the motivating words, taking time to have discussions and reviewing my work.
iv
Abstract
Employer Branding is found to be the most important HR topic in the Netherlands for 2019 (van der Spek & Sylva, 2018). Despite several studies about employer branding little is known about employer branding measuring methods. Also, different definitions of employer branding are brought up in previous studies.
This study focuses on analyzing employer branding and its dimensions. The purpose of this study is to create a comprehensive employer branding index (EBI). With this index companies will be able to test their own employer branding reputation. The index will give companies insight into which employer branding dimensions should be enhanced for an improved employer branding reputation. The improvements will consequently lead to attracting potential employees as well as retaining current employees.
To develop the EBI, literature has been reviewed to not only define what employer branding is, but also which dimensions potentially are comprised in employer branding. The items of previous studies have been compared and selected based on the chosen employer branding definition as well as the ‘three steps employer branding process’ by Backhaus (2004). After the selection of potential employer branding items, the items were validated by examination through a survey.
The survey was held among 102 students, mainly with a Bachelor and Master study background. The outcome of this study is an EBI of 27 items categorized in 9 dimensions.
Keywords: Employer Branding, Index, Human Resources, Employer Reputation
JEL Classification System:
M14 – Corporate Culture, Diversity, Social Responsibility M54 – Labor Management
v
Resumo
A marca do empregador foi considerada o tópico de RH mais importante na Holanda para 2019 (van der Spek & Sylva, 2018). Apesar de vários estudos sobre a marca do empregador, pouco se sabe sobre os métodos de medição da marca do empregador e existem definições diferentes de marca do empregador em estudos anteriores.
Este estudo concentra-se na análise da marca do empregador e nas suas dimensões. O objetivo deste estudo é criar um índice abrangente de marca do empregador (EBI). Com esse índice, as organizações poderão testar sua reputação de marca de empregador. O índice fornecerá às organizações informações sobre que dimensões da marca do empregador devem ser aprimoradas para melhorar a reputação da marca do empregador. As melhorias levarão a atrair potenciais colaboradores e a reter os colaboradores atuais.
Para desenvolver o EBI, a literatura foi revista para não apenas definir o que é realmente a marca do empregador, mas também que dimensões potencialmente compõem a marca do empregador. Os itens de estudos anteriores foram comparados e selecionados com base na definição de marca do empregador escolhida, bem como no 'processo de marca do empregador em três etapas' por Backhaus (2004). Após a seleção dos itens potenciais da marca do empregador, os itens foram validados por exame através de um inquérito.
O inquérito por questionário foi realizado a 102 alunos, principalmente a frequentar licenciatura ou mestrado. O resultado deste estudo é um EBI de 27 itens categorizados em 9 dimensões.
vi
Table of Contents
Acknowledgement ... iii Abstract ... iv Resumo ...v 1. INTRODUCTION ...1 1.1 Relevancy ...1 2. LITERATURE REVIEW ...22.1 Employer branding definitions ...2
2.2 Employer branding dimensions ...3
2.3 Employer branding measures ...6
2.4 Creation of an indicator ...8 3. CONCEPTUAL MODEL ... 10 4. METHOD ... 12 5. RESULTS ... 15 5.1 EB dimension selection ... 15 5.2 Demographic profile ... 19 5.3 Reliability ... 21
5.4 Exploratory Factor Analysis ... 22
5.5 EBI creation ... 29
6. DISCUSSION ... 33
7. CONCLUSION ... 35
8 BIBLIOGRAPHY ... 37
9. Appendices 9.1 Survey questions ... 39
9.2 Adopted items – Berthon et al... 41
9.3 Adopted items – Tanwar & Prasad ... 42
9.4 Rotated varimax output ... 43
1
1. INTRODUCTION
This paper presents a contribution to an upcoming and important HR trend as predicted for 2019. As a result of the yearly research of Berenschot in the Netherlands, Employer Branding is predicted as the number one most important HR topic within Dutch companies for 2019 (van der Spek & Sylva, 2018). It is seen as a skillful investment that can enhance the company’s performance though it can also be challenging for companies to differentiate themselves.
1.1 Relevancy
As Employer Branding (EB) will be one of the main HR topics in 2019, due to its recency it has been subject to vary in definitions and operationalizations. These alternating definitions and studies can have consequences both for research and practice because researchers mention the same concept by different definitions or they might even be assuming the other has the same understanding of the concept. Multiple definitions of EB have been used in previous studies which will be discussed in the literature review of this study.
Additionally, employers seek to be considered as the desired employer of their branch, though it has not been researched how the different conceptions of EB can be indicated and measured. It is also uncertain if employer brand activities have any results and/or effect on the employer brand of the company.
Due to this gap in the literature and diverse conceptual proposals, this research will focus on identifying a comprehensive EB concept. The purpose of this research is to create a tool which can be used to measure the Employer Branding reputation of companies. The final result of this research will lead to a single overall EB index (EBI).
This study starts with an analysis on the EB definitions as well as the EB dimensions by reviewing the main concepts of previous EB studies. After the analysis, the conceptual framework will be presented to give an overview which EB dimensions potentially influence the EB reputation of companies. The research method used in this study is explained in chapter 4. The results are presented in chapter 5 and discussed in the following chapter. The last chapter outlines the conclusion and identifies the limitations of the current study as well as recommendations for future research.
2
2. LITERATURE REVIEW
2.1 Employer branding definitions
Employer branding (EB) has been defined in several ways in previous studies. Lievens (2007: 51) for instance defined EB as “an approach to recruitment and retention that involves internally and externally promoting a clear view of what makes a firm different and desirable as an employer”. However, Sutherland et al. (2002: 13) defined it as “the process of identifying and creating a company brand message, applying traditional marketing principles to achieving the status of employer of choice”. Ambler and Barrow (1996: 187) defined EB as “the package of functional, economic and psychological benefits provided by employment, and identified with the employing company”. Another definition of EB is described as “the sum of a company’s efforts to communicate to existing and prospective staff that it is a desirable place to work” (Lloyd, 2002: 64). Ewing et al. (2002) mentioned their concern with building an image in the minds of the potential labor market that the company, above all others, is a ‘great place to work’. In contrast, Backhaus and Tikoo (2004: 502) discussed that employer branding describes “the process of building an identifiable and unique employer identity” or, more specifically, to promote a unique and attractive image as an employer (Theurer et al., 2018).
Comparing the above definitions, the main focus of EB lies on creating a preferred employer image. Lievens (2007) emphasized on recruitment and retention, whereas other researchers considered additional factors. Sutherland et al. (2002) point out the process of the company brand while applying marketing principles and Ewing et al. (2002) set their focus on the potential labor market. The definitions of Ambler and Barrow (1996), Lloyd (2002), and Backhaus and Tikoo (2004) are most comparable as they target the company’s effort to create a preferred employer image.
Although all definitions share the assumption that “human capital brings value to the firm, and through skillful investment in human capital, firm performance can be enhanced” (Backhaus & Tikoo, 2004: 503), there seems to be different emphasis on the features that define EB. These have as a denominator the ‘uniqueness / differentiation factor’, ‘attractiveness / desirable benefits’, ‘process of building / communicating these features’ taking as target the potential employees as well as the current employees. As these
3 perspectives can operationally be defined with a large subset of variables (e.g. uniqueness can concern many different aspects of any organization), EB remains an elusive construct.
Elusiveness comes from the lack of integration leveraged by subjective measurements. This research intends to offer some contribution by integrating different lines of reasoning into a multidimensional framework. Each dimension will be defined in such a way that it becomes more objective, accountable for validity and reliability purposes, and useful to establish comparative studies. It will depart from extant literature that has put forward empirical studies that were precisely intended to achieve this but may have face limitations based on either restricted literature integration or methodological options (namely in data analysis).
Finally, at the applied level, the aim is to create an employer branding index (EBI) so that companies can identify the EB dimensions that are more effective in attracting potential employees and also to retain current employees. Considering this, the most suitable definition of EB according to this study is the one from Backhaus and Tikoo (2004: 502) that sees EB as: “the process of building an identifiable and unique employer identity”.
2.2 Employer branding dimensions
Many firms try to become the preferable employer by effectively attracting, motivating, and retaining talented employees. To achieve this, companies make sure to have innovative and compelling HR practices which give benefit to employees as well as to the company. Due to their status and reputation in terms of corporate culture and HR practices the companies are able to attract, to motivate and to retain employees (Joo & McLean, 2006).
Sutherland et al. (2002:14) state that EB “uses aspects of corporate identity and reputation [and it] concentrates on communicating that image to current and potential employees”. This is overly general. But, which specific factors companies have to focus on to attract and retain employees has not been unified in research nor has it been made measurable.
In this study EB is seen as the process to build an identifiable and unique employer identity. To make this measurable it is necessary to look at the dimensions of EB that add value in creating this employer identity. Backhaus and Tikoo (2004) specified along with the EB definition that it entails a three step process. The first step is to develop a value proposition that creates perceptions of the offer a company has. It includes topics like: the
4 organizational culture, the management style, the qualities of current employees, the current employment image and the impressions about product or service. Secondly, attracting the targeted population (potential employees, recruiting agencies, and placement councilors) and supporting / enhancing the corporate products is part of external marketing. The last step consists of internal marketing, representing the workforce that stands by the organizational goals and company’s set values along with promoting career development within the organization (Backhaus & Tikoo, 2004). To ensure that these propositions are included in the EBI, previous studies will be analyzed and compared while considering ‘the three steps EB process’.
Aggarwal (2015) conducted a study focused on the factors determining EB with a potential EB scale. Eventually the following nine determining factors remained, which can be measured by the mentioned items in brackets:
1. Basic Job benefits
(Job description, salary and bonus, job benefits, work/life balance, security and stability)
2. Overall status of the company
(Company reputation, market size of company, organizational structure, innovative company, company culture)
3. Competitiveness and challenges
(Competitive and intellectual challenge on job, chance to work independently, change of being leader, or manager of people)
4. Self-development
(Continuous learning, being a technical or functional expert, skills development) 5. Future opportunities
(Good reference for future work opportunities, internal career opportunities, possibilities to work abroad)
6. Emotional judgment
(Pioneer as a brand in mind, gut feeling, feeling of being a positive contributor to the company)
7. Relationship with peers
(Expected relationship to closet superior, colleagues) 8. Internal management
5 9. Ethnic and values
(Moral and ethics)
As the study of Aggarwal (2005) is focused on EB determinants instead of EB dimensions it has been compared with the study of Berthon, Ewing and Hah (2005) and Tanwar and Prasad (2016).
Berthon et al. (2005) focused their study on employer attractiveness in conjunction with a suitable scale to measure the construct. They defined employer attractiveness as “the envisioned benefits that a potential employee sees in working for a specific organization” (Berthon, Ewing, & Hah, 2005: 151). This definition fits closely to the chosen EB definition of this study. Therefore, the items as a result of Berthon’s research are taken into consideration for the creation of the EBI.
During the study a 32-item scale was developed, which eventually was reduced by a few items leading to a 25 item Employer Attractiveness (EmpAt) scale. The 25 items were then categorized into five EB dimensions: ‘Social’, ‘Economic’, ‘Interest’, ‘Application’ and ‘Development’. However, the five EB dimensions are generic and broadly set. For instance, the dimension ‘Development’ comprehends the following items:
- Recognition / appreciation from management - Gaining career enhancing experience
- Feeling good about yourself as a result of working for a particular organization
The items above show different assumptions about ‘Development’. This may cause unreliability in results. Additionally, this study is limited to potential employees.
A recent study by Tanwar and Prasad (2016) found the same limitation and decided to set their research focus on potential employees. Through a literature review and an analysis on the effects of the dimensions on job satisfaction, various dimensions of EB have been identified. It has been concluded that there are six main EB dimensions, wherein ‘Training and Development’ is the most related with job satisfaction, followed by ‘Reputation’ and ‘Work-Life Balance’ as the third most effective indicator. The study has proven that EB dimensions are closely related with job satisfaction, which is an expected outcome of EB.
Table 1 shows an overview of the EB dimensions and its definitions as presented in the research of Tanwar and Prasad (2016).
6
Dimensions Operational definition
Reputation An outcome of process in which firms signal their key characteristics to maximize social status.
Organization culture
A system of shared meaning of values held by members of an organization that distinguishes one organization from other.
Diversity The variation of cultural and social identities among people existing together in an employment setting.
Work-Life Balance Equilibrium between the person’s personal and official life. Corporate Social
Responsibility
The effect that corporations have on society in order to engage new customers.
Training and Development
Training and developing employees with necessary skills needed for the current as well as future job positions.
Table 1, EB Dimensions by Tanwar and Prasad (2016)
2.3 Employer branding measures
As mentioned, previous studies have shown several attempts in identifying EB measures. Berthon et al. (2005) analyzed the dimensions of employer attractiveness and identified 25 items that are likely to contribute to the employment brand value. Their research led to a five-factor scale measuring employer attractiveness. Tanwar and Prasad (2016) studied the EB dimensions in relation with job satisfaction from the perspective of existing employees. Their research led to six EB dimensions.
As stated, a study focused on the factors determining EB with a potential EB scale was conducted by Aggarwal (2015). Her study targeted management students and resulted in nine factors determining EB.
Further on, Joo and Mclean (2006) explored Best Employer studies to suggest a conceptual model of the key differentiators of best employers. However, these key differentiators are not necessarily an equivalent of EB dimensions.
A research by Broström and Farahvashi (2011) has suggested a potential EB index, nevertheless this EB index is based on only two factors, namely ‘awareness’ and ‘attractivity’. Though this research is a good addition for creating an EB index, we cannot settle for this option as it does not cover all the EB dimensions.
7 In a qualitative research by Moroko and Uncles (2008) a typology of EB success characteristics is suggested. Figure 1 explains that there are two key dimensions of EB success characteristics: attractive/unattractive and accurate/aspirational.
Figure 1, Typology of EB success characteristics (Moroko & Uncles, 2008)
The characteristics of attractive / unattractive companies were specified by Moroko and Uncles (2008) via three requirements: To be known and noticeable, relevant and resonant, and differentiated.
Awareness is the first requirement, as attractiveness cannot exist without potential candidates being aware of the employer. Brand awareness has been long linked to benefits (e.g., Keller, 1993; Hoyer & Brown, 1990; Holden, 1993). These benefits appear to operate similarly for employer brands. Successful employer brands were characterized as being ‘known’ and ‘noticeable’ in their market’. Additionally, to be relevant and resonant means that customers will find the value proposition interesting and resonant of their needs (Aaker, 1996). Likewise, within the EB domain, potential candidates must find the value proposition of the employer relevant and aligned with their expectations about what means to work in that organization, either as a prospective or current employee (Moroko & Uncles, 2008). Lastly, to gain saliency a brand needs to be seen as distinct from the alternatives. The same is valid for employers that should strive to differentiate themselves from other organizations, especially competition, in order to gain a strategic advantage in attracting talents (Backhaus, 2016).
8 The second dimension to emerge from the analysis pointed out the successfulness of the employer brand (accurate versus aspirational) (Moroko & Uncles, 2008). Though these dimensions can potentially report the EB success, the model lacks in measureable EB factors.
Considering the discussed EB measures, the studies of Berthon et al. (2005) and Tanwar and Prasad (2016) offer a good representation of possible scales. With regards to the psychometric qualities of Berthon’s and Tanwar’s study, both have developed a valid and reliable instrument. To measure the validity Berthon et al. (2005) focused e.g. on the convergent validity, criterion validity, and content validity. Tanwar and Prasad (2016) set their focus on the content validity, discriminant, and convergent validity. To test the reliability of their instruments both used the Cronbach’s alpha, which is set to be statistically significant when alpha is 0.7 or higher. Berthon’s EmpAt scale had a final Cronbach’s alpha of 0.97 and Tanwar’s construct resulted in a Cronbach’s Alpha of 0.78. The positive psychometric qualities therefore indicate that both studies are a good base for the current study although, according to Levine (2005), psychometric validation of scales would require further analyses such as showing factorial structure (construct validity).
2.4 Creation of an indicator
To put the EB dimensions together into a single overall indicator it has been first reviewed how to build an indicator.
Feldman, Bahamonde and Bellido (2014) highlight the reliability and conducting a factor analysis, (exploratory analysis) to study the importance of the variables. Catasus and Gröjer (2006) explained that to create a single overall index from several indicators, the indicators could be valued in a point scale. In their research they studied the so-called Working Condition Index (WCI). In the case of the WCI a 20-point scale was used for nine indicators, with the best possible score of 180.
Tay and Jebb (2017) explained two scale creation approaches: deductive and inductive. A deductive approach is suited to generate items based on existing theory while an inductive approach is suited to generate items when there is no clear conceptual definition or no theory that guides the understanding of the construct’s dimensions. It is evident that both approaches are complementary as the inductive will offer the possibility of empirical tests which contribute to greater clarity and theory building, thus enabling the deductive approach
9 to take place in refining or generating new items while the deductive approach is the one that offers greater assurance (Collis & Hussey, 2013).
Consequently, it is necessary to have a clear conceptualization of the construct, which means there should be a clear definition of the construct including delineating. Thereafter the dimensions of the construct should be specified. Alongside the nomological network, which informs about the positive, negative and independent relations to the construct, should also be specified.
To create the items of the scale, the following steps can be used as proposed by Tay and Jebb (2017: 1384): “(1) determining an appropriate reading level for the target population, (2) identifying whether the items should refer to general or specific contexts and situations (work contexts); (3) considering differences in how respondents interpret the items (e.g., the different meaning of the term “stress” in different national contexts); (4) deciding the type of scale response format and behavioral anchors, which can potentially affect scale responses; and determining the applicability of reverse scoring”.
The same authors offer a set of key principles that should be followed when creating an item. Firstly, the item should be simple and straightforward. Secondly, it should not include leading statements or questions, nor include double-barreled items. Lastly there should not be identical items.
The scale is only usable when duly validated which can be conducted with a variety of data analysis techniques, corresponding also to specific forms of validity. For example, with assessing correlations, comparing differences, examining scale scores change, but also conducting regression analyses with theoretically expected outcomes, or conducting factor analyses to gauge the dimensions and their match with extant theory.
Technically, Tay and Jebb (2017) propose that it is fundamental do identify a pool of good items that have promising psychometric quality. At first it is important to examine the mean, standard deviations, score range, endorsement proportions across all the options, and the item-total correlation for each item. Items with item-total scale correlation below 0.20 should be excluded.
Additionally, Fombrun (1998) stated that an index should reflect the interests of the stakeholders as its comprehensiveness depends on such representative procedures that incorporates all dimensions relevant for every stakeholder.
10
3. CONCEPTUAL MODEL
With this research the contribution of several EB dimensions is being reviewed and analyzed to create a single overall index. By selecting the EB items based on the literature review, there are assumingly eight dimensions that have a positive and/or negative effect on the EB reputation of companies. The EB item selection is further explained in chapter 5.
The chosen EB items were categorized in the following dimensions: - ‘Working Climate’
This dimension represents the social factors including relationship with colleagues and the working environment of the company.
- ‘Reputation’
This dimension represents the overall company status and the employees’ image towards the company.
- ‘Work-Life Balance’
This dimension represents the workload and the balance opportunities between work and private life provided by the company.
- ‘Recognition’
This dimension represents basic job conditions, job security and management appreciation within the company.
- ‘Diversity’
This dimension represents equal rights for men and women and enhancement of different cultures and ethnicity within the company.
- ‘Development’
This dimension represents the training and development opportunities within the company.
- ‘Job Enrichment’
This dimension represents job variety, autonomy and encouragement of team work within the company.
- ‘External Marketing’
This dimension represents the products and/or services, customer orientation, humanity, and financial stability of the company.
11 As it is expected that all eight dimensions contribute to EB (figure 2), the following hypotheses have been formulated:
Hypothesis 1: Working Climate contributes to the employer branding reputation of international companies.
Hypothesis 2: Reputation contributes to the employer branding reputation of international companies.
Hypothesis 3: Work-Life Balance contributes to the employer branding reputation of international companies.
Hypothesis 4: Recognition contributes to the employer branding reputation of international companies.
Hypothesis 5: Diversity contributes to the employer branding reputation of international companies.
Hypothesis 6: Development contributes to the employer branding reputation of international companies.
Hypothesis 7: Job Enrichment contributes to the employer branding reputation of international companies.
Hypothesis 8: External Marketing contributes to the employer branding reputation of international companies.
12
4. METHOD
As mentioned, this study intends to create a clearer concept about what EB is and what EB is not. Additionally, it strives to offer insight on how EB can be effectively measured and how it can become a comprehensive and integrative construct to facilitate building scientific knowledge.
Furthermore, the research includes an analysis of the EB dimensions, which consequently will be used to create a single overall EB index. The EB index (EBI) has its main focus on employee retention but can also be used to attract potential employees. As a result, the EBI will provide companies insight on their ‘EB reputation’. This may help them gain knowledge about the EB dimensions in the current company situation and allow the company to improve or strengthen EB dimensions. Meaning, a company will be able to conclude on which EB dimension they potentially need to set more focus on to attract/retain employees.
Hence the research question of this thesis is as following:
How to integrate the divergent conceptions and measures on EB into a single overall indicator?
The research started off with a literature review to gain knowledge about first, the definition of EB and secondly, the EB dimensions. After revealing the suitable EB definition, a deductive approach for scale creation was chosen. To identify the different EB dimensions for this research, results of previous studies have been analyzed and compared. From these analyses it is clear that there are two main studies that identified EB dimensions which match the chosen EB definition for this research, namely from Berthon et al. (2005) and Tanwar and Prasad (2017). The main difference between both studies is the target group, Berthon et al. (2005) focused on potential candidates and Tanwar and Prasad (2017) on current employees.
For the creation of the EBI, the items proposed by Tanwar and Prasad (2017) and Berthon et al. (2005) were combined. The selection of the final EB dimensions were made by matching it to the chosen EB definition including ‘the three steps EB process’ as proposed by Backhaus and Tikoo (2004). In the appendices (9.2 and 9.3) an overview is given of the adopted items (highlighted in italics) related with ‘the three steps EB process’.
13 Consequently, the chosen items were sorted in categories, which were then labeled to represent the EB dimensions. As a final step, missing items in the EB dimensions were added to ensure an accurate measure. The result led to 35 EB items organized into eight EB dimensions, which were then empirical examined. For the item creation, and thus the survey questions, the key principles of Tay and Jebb (2017) were followed. To ensure the content validity, items identified from previous studies were used. This way the instrument will represent all aspects of the EB concept. The face validity, to measure what it claims to measure, was assured by testing the EBI through evaluation by the targeted population.
The examination was set to conclude 100-170 potential candidates focusing on international companies. For this research potential candidates are seen as students and graduates looking for a job (hereafter alumni). To reach the respondents the network platform LinkedIn has been used to approach HRM Bachelor students and alumni. SurveyCircle1 has been used to reach international students and alumni. Additionally, first year Management students of ISCTE University were also approached to participate in the research.
The created survey (appendices 9.1) was designed to identify a good set of EB items, were reasonable psychometric properties were taking in to consideration. Additionally, the survey also provided insight into the EB awareness of potential candidates of several international companies. The survey consists a total of 35 questions along with a few demographical questions. In this phase respondents answered the questions keeping their preferable company to work for in mind. The questions in this survey represented the items of the eight EB dimensions. The responses were measured based on a 7-point Likert scale (from 1= strongly agree to 7= strongly disagree).
For the analysis only completed surveys were taken into account for this research. The survey had a total response rate of 102. Firstly, the demographic results were analyzed followed by a reliability analysis. The reliability of the items that measure the EB dimensions were examined by Cronbach’s Alpha which should be higher than 0.7 to ensure the reliability.
Afterwards, the Principal Component Analysis (PCA) with varimax rotation was done to identify the emerging structure but also to ascertain if certain items should be removed in
1
SurveyCircle is a website for researches looking for respondents, as well as people who are willing to fill out surveys.
14 order to ensure construct validity. The construct validity tests if the variables reflect the construct that is supposed to be measured by means of its structure (Hair et al., 2006).
After certain items had been removed due to low commonalities, the PCA was conducted again to test their fit. The components and composing items were reviewed and labeled in EB dimensions. The previous labeled EB dimensions were used for this and those components that did not had a proper fit were re-labeled. Additionally, the reliability test was run once more, targeting the whole instrument as well as the EB dimensions separately.
The labeled dimensions were then used to create the EBI. The last step of the EBI development was creating a suitable formula to calculate the EBI scores. Firstly, the scores per EB dimension were formulated based on the variance ratio. The scores of all EB dimensions together finally lead to the overall EBI. To summarize the dimension scores as well as the overall EBI score an EBI figure was created which is presented in the following chapter.
15
5. RESULTS
5.1 EB dimension selection
In order to create the EBI and examine the index it was first necessary to select the EB items and categorize them in suitable EB dimensions. To ensure the validity of the scale, the items from Berthon et al. (2005) and Tanwar and Prasad (2016) were considered for the selection. Firstly, the items of both studies were analyzed for comparisons. This analysis showed that there are only a few items that are equivalent from both studies. These items regarded topics like: ‘management recognition’, ‘future job’ and ‘work variety’.
Next, the items of Berthon et al. (2005) and Tanwar and Prasad (2016) were categorized using as reference ‘the three steps EB process’ (Backhaus & Tikoo, 2004). The items were matched by interpreting in which step of the EB process the items belong to. Once the items were paired with one of the three steps, overlap between the items of both studies was refined. Meaning, identical items were aggregated into a single item. After removing any overlap, the importance of the items was deliberated. It was crucial that the items of Berthon et al. (2005) and Tanwar and Prasad (2016) complemented each other, as the former items focus on potential employees and the latter items on current employees. The combination of both batches will ensure that the EBI can measure the EB reputation targeting both potential and current employees.
Table 2 shows the selected items (16 items of Berthon et al., 2005 and 16 items of Tanwar and Prasad, 2016) after considering ‘the three steps EB process’. In addition to the adopted items, three new items have been added. Lastly, after the selection of the items, the items were categorized and labeled into eight EB dimensions, namely:
1. ‘Working Climate’ 2. ‘Recognition’ 3. ‘Reputation’ 4. ‘Work-Life Balance’ 5. ‘Diversity’ 6. ‘Development’ 7. ‘Job Enrichment’ 8. ‘External Marketing’
16 The first five dimensions can be interpreted as the value proposition in the first step of the EB process. Followed by Development and Job Enrichment in the second step representing the internal marketing. Last, but not least, the External Marketing dimension that, not surprisingly represents the last step, external marketing.
17 Dimension EB items Berthon et al. (2005) EB items Tanwar & Prasad (2016) New EB items
Working Climate
This company fosters a good relationship environment between employees
This company provides a working environment where colleagues are supportive and encouraging
This company has an exciting working environment
This company values and makes use of employees’ creativity In this company there is a happy environment
In this company employees have a good relationship with their manager
This company is innovative and encourages forward thinking
Recognition In this company employees get recognition/appreciation from their management
In this company management genuinely responds to employees’ suggestions and ideas
This company provides job security
This company provides an attractive overall compensation package In this company employees feel a strong sense of acceptance and belonging
Reputation This company is a springboard for future employment This company is highly reputed nationally and internationally
This company’s name adds value to everybody’s resume
Development In this company employees gain a career enhancing experience This company trains employees on skills that prepare them for future job position
This company invests (heavily) in training and development of its employees
18
Work-Life Balance
This company provides flexible working hours This company protects the work-life balance of its employees
This company provides opportunities to work from home
This company has a reasonable sense of workload
Diversity In this company employees are hired based on their
skills and abilities regardless of their gender, ethnicity or culture
In this company employees from different cultures are welcomed
This company has equal rights for men and women
Job
Enrichment
This company provides the opportunity to move around and work in different roles
This company offers a good variety of work activities/projects
This company provides autonomy to its employee to take decisions
In this company team work is highly encouraged
External Marketing
This company produces high quality products and /or services This company behaves responsibly towards the environment
This company has a responsible financial management
This company produces innovative products and /or services This is a humanitarian company which gives back to society This company is customer orientated
19 5.2 Demographic profile
As mentioned, the presented EB items in table 2 were examined through a survey. Table 3 offers an overview of some sociodemographic variables of respondents, namely gender, and education background. More than half (55.9%) of the respondents was female and 44.1% was male. The majority of the respondents have a Master study background (57.8%).
Table 3, Gender and study background
Looking at the preferred international companies chosen by the respondents, the preference is widely spread. This can partly be explained due to different education field backgrounds. Figure 3 shows that the following five companies were mostly chosen: PwC (6), Shell (6), BMW (5), Deloitte (5), and Google (5).
20 There are four domains of education that were more frequent in the sample (Figure 4). The majority of the respondents is studying Management (20.6%), HRM (22.5%), HRM & Organizational Consulting (6.9%) or Business Administration (5.9%).
Figure 4, Study background
To gain extra information about salary expectations, respondents were asked to share their expected starter salary rate. Figure 5 shows that the majority of the respondents either expect a starter salary between €2.100 - €3.000 per month (37.6%) or a
starter salary between €1.100 - €2.000 per month (30.7%). The salary scatter can be explained by the different countries respondents are willing to work in. The most countries where respondents would like to work were: Netherlands (29.5%), Portugal (23.6%), and Germany (20.7%). An overview between the salary group and preferable country to work in, is shown in figure 6.
21 Figure 6, Expected salary in preferred work country
5.3 Reliability
To test the reliability of the instrument, the Cronbach’s Alpha has been examined. Considering the Cronbach’s Alpha cutoff 0.70, the measure has good reliability as the results show an Alpha of 0.921 (figure 7). However, Tavakol and Dennick (2011) suggest that a Cronbach’s Alpha higher than 0.9 may suggest redundancies, concluding that the test length perhaps may benefit from being shortened.
Reliability Statistics Cronbach’s
Alpha
Cronbach's Alpha Based
on Standardized Items N of Items
.921 .923 35
22 5.4 Exploratory Factor Analysis
The data adequacy was examined through KMO, with a result of 0.711 (table 4). This means that the data is adequate for the factor analysis, as a KMO of 0.7 is considered middling (Kaiser, 1974). The Bartlett’s Test is also significant with a p value of 0.000 (table 4).
KMO and Bartlett’s Test
Kaiser-Meyer-Olkin Measure of Sampling Adequacy. .711 Bartlett's Test of Sphericity Approx. Chi-Square 2131.288
Df 595
Sig. .000
Table 4, KMO and Bartlett's Test
The PCA with varimax rotation was conducted to extract items and examine the reliability of the EBI. The PCA results included 10 components with 35 items in total. The varimax rotation suggested eight items to be extracted as the eigenvalue’s were higher than 1.0. The rotated component matrix, presented in paragraph 9.4 of the Appendices shows the factor loadings less than 0.5 highlighted in the color orange. The highlighted items were removed. The extraction of eight items led to a total of 27 items to form the EBI.
After the eight items had been removed, another PCA was conducted. The KMO became slightly higher with a score of 0.735 and Bartlett’s statistic stayed at a significant p value of 0.000 (table 5).
KMO and Bartlett’s Test
Kaiser-Meyer-Olkin Measure of Sampling Adequacy .735 Bartlett's Test of Sphericity Approx. Chi-Square 1355.789
Df 351
Sig. .000
Table 5, KMO and Bartlett's Test after item reduction
The results further show that the nine components cumulatively explain 73.9% of variance (table 6).
23 Table 6, Total variance explained - components
Table 7 presents the first component (α = 0.82) consisting of five items concerning innovation, appreciation towards employees and cultural background. These items set their focus on attracting the target population as well as supporting and/or enhancing the corporate brand and were therefore labeled as ‘Organizational Identity’.
Reliability Statistics
Cronbach’s Alpha
Cronbach's Alpha Based
on Standardized Items N of Items
.817 .817 5
Table 7, Reliability results - Organizational Identity
Table 8 presents the second component (α = 0,77) that also consists of 5 items targeting the work environment and the current employee image and therefore labeled as ‘Working Climate’.
Reliability Statistics
Cronbach’s Alpha
Cronbach's Alpha Based
on Standardized Items N of Items
.768 .770 5
Table 8, Reliability results - Working Climate
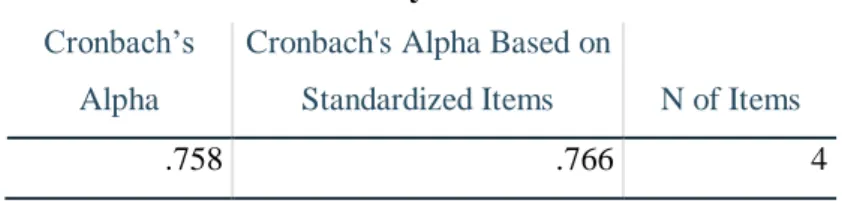
Table 9 presents component three (α = 0.76) which has four items regarding the company’s reputation, thus ‘Reputation’ is chosen as label.
24
Reliability Statistics
Cronbach’s Alpha
Cronbach's Alpha Based on
Standardized Items N of Items
.758 .766 4
Table 9, Reliability results - Reputation
The fourth component, presented in table 10 (α = 0.69) comprehends three items about gaining career experience and training and is labeled as ‘Development’.
Reliability Statistics
Cronbach’s Alpha
Cronbach's Alpha Based on
Standardized Items N of Items
.688 .697 3
Table 10, Reliability results - Development
Table 11 presents component five focused (α = 0.715) on 3 items regarding workload and job variety which is labeled as ‘Job Enrichment’.
Reliability Statistics
Cronbach’s Alpha
Cronbach's Alpha Based on
Standardized Items N of Items
.715 .729 3
Table 11, Reliability results - Job Enrichment
Table 12 presents component six (rSB = 0.65) that consists only two items about equal rights and decisions, labeled as ‘Recognition’.
Reliability Statistics
rSB (Spearman-Brown
corrected correlation) N of Items
.649 2
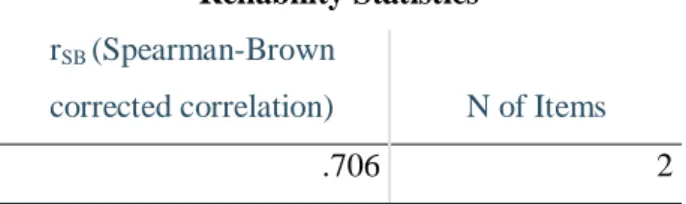
25 Also component seven, presented in table 13 (rSB = 0.71) consists only two items regarding society and therefore labeled as ‘Corporate Social Responsibility’ (CSR).
Reliability Statistics
rSB (Spearman-Brown
corrected correlation) N of Items
.706 2
Table 13, Reliability results - CSR
Table 14 presents component eight (rSB = 0.70) that has two items about working hours and is labeled as ‘Work – Life Balance’.
Reliability Statistics
rSB (Spearman-Brown
corrected correlation) N of Items
.695 2
Table 14, Reliability results - Work-Life Balance
The last component consists of one remaining item regarding finance ‘Accountability’. When examining the reliability, five dimensions scored a Cronbach’s Alpha of 0.7 and higher. Three dimensions (Development, Recognition and Work-Life Balance) scored a Cronbach’s Alpha of higher than 0.6 but very close to 0.7, which should be still acceptable according to Nunnally (1978). The dimension Accountability has not been examined as this dimension contained only a single item.
The overall scale is still reliable with a Cronbach’s Alpha of 0.89 as shown in table 15.
Reliability Statistics
Cronbach's Alpha
Cronbach's Alpha Based on
Standardized Items N of Items
,893 ,896 27
26
Dimension Item Factor loading
Organizational Identity
This company produces innovative products and /or services
0.783 In this company employees from
different cultures are welcomed
0.772 This company is innovative and encourages
forward thinking
0.617 This company provides an attractive compensation
package
0.575 In this company employees get
recognition/appreciation from their management
0.554
Working Climate This company has an exciting working environment
0.795 This company values and makes use of
employees’ creativity 0.740
In this company employees feel a strong sense of acceptance and belonging
0.625 In this company employees have a good
relationship with their manager
0.548 In this company management genuinely
responds to employees’ suggestions and ideas 0.513
Reputation This company is highly reputed nationally and
internationally
0.794 This company’s name adds value to everybody’s
resume
0.710 This company is a springboard for future
employment
0.603 This company is customer orientated 0.558
Development This company invests (strongly) in training & development of its employees
0.760 This company trains employees on skills that
prepare them for future job position
0.748 In this company employees gain a career
enhancing experience
0.571
Job Enrichment This company has a reasonable sense of workload 0.803
This company protects the work-life balance of its employees
0.782 This company provides the opportunity to move
around and work in different roles
0.593
Recognition This company provides autonomy to its employees
to take decisions
0.803 This company pays attention to equal rights for
men and women
0.522
Corporate Social Responsibility
This company behaves responsible towards the environment
0.784 This company gives back to society 0.772
Work-Life Balance This company provides flexible working hours 0.845
This company provides opportunities to work from home
0.823
Accountability This company has a responsible financial management
0.881
27 Regarding ‘the three steps EB process’ (Backhaus & Tikoo, 2004) the dimensions ‘Working Climate’, ‘Reputation’, ‘Work-Life Balance’, ‘Organizational Identity’ and ‘Job Enrichment’ relate to the first step of the EB process. They contribute to the value propositions like organizational culture, current employee image, management style, among others. ‘Development’ and ‘Recognition’ contribute to the second step of the EB process called ‘internal marketing’. This represents career development and the development of a workforce committed to the organizational values and goals. Last, but not least, the dimensions ‘Corporate Social Responsibility’ (CSR) and ‘Accountability’ fit in the last step of the EB process. The last step focuses on external marketing and thus attract target population as well as enhancing and supporting the corporate brand. A more detailed overview of the dimensions, its items and the factor loading is given in table 16. The full factor matrix after varimax rotation is showed next in table 17, each component is identified with the respective number order with which it was identified in table 16.
28
C1 C2 C3 C4 C5 C6 C7 C8 C9
This company produces innovative products and /or services 0.783 0.101 0.313 0.056 0.058 -0.118 0.136 -0.009 0.123 In this company employees from different cultures are welcomed 0.772 0.014 0.286 0.258 0.086 0.082 0.173 0.071 -0.026 This company is innovative and encourages forward thinking 0.617 0.146 0.269 -0.079 -0.093 0.401 0.102 0.168 0.034 This company provides an attractive compensation package 0.575 0.289 -0.033 0.243 0.031 0.039 -0.046 0.264 0.132 In this company employees get recognition/appreciation from their management 0.554 0.218 0.005 0.395 0.150 0.400 0.041 -0.019 0.135 This company has an exciting working environment 0.109 0.795 0.086 0.011 -0.109 -0.069 0.225 0.058 0.061 This company values and makes use of employees’ creativity 0.157 0.740 0.266 0.152 0.123 0.001 -0.029 -0.099 0.135 In this company employees feel a strong sense of acceptance and belonging 0.181 0.625 -0.004 0.058 0.184 0.342 0.098 0.101 -0.083 In this company employees have a good relationship with their manager 0.159 0.548 0.046 0.297 0.211 0.157 -0.417 0.207 0.083 In this company management genuinely responds to employees’ suggestions and ideas -0.092 0.513 0.186 0.004 0.359 0.421 0.048 0.121 -0.070 This company is highly reputed nationally and internationally 0.286 0.065 0.794 -0.022 0.062 0.137 -0.046 0.078 -0.104 This company’s name adds value to everybody’s resume 0.267 0.247 0.710 0.229 -0.067 0.035 -0.043 0.052 -0.163 This company is a springboard for future employment 0.099 0.292 0.603 0.306 0.326 -0.161 0.177 -0.074 0.339 This company is customer orientated 0.144 -0.043 0.558 0.049 -0.110 0.153 0.399 0.111 0.484 This company invests (strongly) in training & development of its employees 0.030 0.209 0.017 0.760 0.189 0.029 0.082 0.193 0.067 This company trains employees on skills that prepare them for future job position 0.289 -0.058 0.110 0.748 0.021 0.073 0.042 0.054 0.032 In this company employees gain a career enhancing experience 0.029 0.195 0.487 0.571 0.004 0.284 0.050 0.044 0.105 This company has a reasonable sense of workload -0.031 0.169 -0.150 -0.074 0.803 0.126 0.085 0.164 0.145 This company protects the work-life balance of its employees 0.126 0.033 0.254 0.290 0.782 -0.046 0.035 0.121 -0.214 This company provides the opportunity to move around and work in different roles 0.162 0.055 0.005 0.204 0.593 0.299 0.080 -0.060 0.533 This company provides autonomy to its employees to take decisions 0.067 0.080 0.062 0.165 0.135 0.803 0.148 0.175 0.196 This company pays attention to equal rights for men and women 0.318 0.093 0.212 0.513 -0.013 0.522 0.089 -0.109 -0.047 This company behaves responsible towards the environment 0.013 0.053 0.006 0.089 0.259 0.191 0.784 0.058 0.229 This company gives back to society 0.376 0.210 0.055 0.129 -0.026 0.059 0.772 0.020 -0.056 This company provides flexible working hours 0.034 0.006 0.040 0.190 0.164 -0.006 0.006 0.845 -0.015 This company provides opportunities to work from home 0.164 0.098 0.071 -0.006 0.040 0.157 0.043 0.823 0.053 This company has a responsible financial management 0.087 0.076 -0.070 0.044 0.018 0.059 0.059 0.041 0.881 Extraction Method: Principal Component Analysis. / Rotation Method: Varimax with Kaiser Normalization. / a. Rotation converged in 8 iterations.
29 5.5 EBI creation
In order to create the overall EBI, the explained variance ratio per component (table 6) was used to calculate the overall EBI score. It was decided to use the explained variance ratio, because the loadings of the items are not similar across the components. Each component was weighed with the explained variance ratio. The calculation of the highest score is also based on the Likert scale 1 (strongly agree) and the lowest score is based on the Likert scale 7 (strongly disagree). Hence a lower score indicates a stronger agreement. The overall EBI score resulted in score rating between 14 and 100, were 14 is the highest score and 100 the lowest score. The formula for the EBI score per dimension is:
EBI per dimension = Explained variance component ratio * total component items * Likert scale
In order to gain insight in the overall EBI score, the EB dimensions are calculated first. This way organizations can have a more detailed insight of their EBI per dimension. It will provide information on which EB dimension(s) the company has to improve and which EB dimensions are already on a good level. A good level is achieved when the EB dimension scores between scale 1 and 2. An overview of the overall EBI score range is given in table 18.
Table 19 gives an overview of the lowest and highest score per dimension. Ideally companies should have an overall EBI score between 14 and 29. The score interpretation shows how attractive the EB reputation of the company is. This score interpretation confirms the EB success characteristics as proposed by Moroko and Uncles (2008).
The outcomes of this EBI indicate if the company is known and noticeable by measuring the dimensions Reputation and Accountability. The dimensions Organizational Identity, Recognition and Working Climate measure if the company’s brand is relevant and resonant. Lastly, the ability to differentiate is measured by Development, Job Enrichment, Work-Life Balance and CSR of the company.
30
Scale range Score range Score interpretation
1 – 2 14 till 29 Very attractive
2 – 3 30 till 43 Attractive
3 – 4 44 till 57 Somewhat attractive
4 – 5 58 till 72 Somewhat unattractive
5 – 6 73 till 86 Unattractive
6 – 7 87 till 100 Very unattractive Table 18, Overall EBI score ranges
Dimension Items Highest score Lowest score
1. Organizational Identity 5 5.45 38.15 2. Working Climate 5 1.70 11.90 3. Reputation 4 1.44 10.08 4. Development 3 1.14 7.98 5. Job Enrichment 3 1.14 7.98 6. Recognition 2 1.00 7.00 7. Corporate Social Responsibility 2 0.86 6.02 8. Work-Life Balance 2 0.86 6.02 9. Accountability 1 0.71 4.92 Overall EBI 27 14 100
Table 19, Score overview per EB dimension
To interpret the scores per dimension, the same interpretation of the overall score can be used. So, for instance, when a company has a score of 3.2 in dimension 3 (Reputation) the company has an attractive reputation. The score range per dimension is shown in table 20.
To present the EB scores in one overview, figure 7 has been designed. This figure shows the score per dimension in the color of their score range as well as the overall EBI score of the company. Additionally figure 8 presents an example of the EBI from one of the most preferred companies based on the results of the current study.
31
Dimension Scale range Score range Dimension Scale range Score range
1 1-2 5.5 - 10.9 6 1-2 1.0 – 2.0 2-3 11.0 – 16.4 2-3 2.1 – 3.0 3-4 16.5 – 21.8 3-4 3.1 – 4.0 4-5 21.9 – 27.3 4-5 4.1 – 5.0 5-6 27.4 –32.7 5-6 5.1 – 6.0 6-7 32.8 –38.2 6-7 6.1 - 7.0 2 1-2 1.7 – 3.4 7 & 8 1-2 0.9 – 1.7 2-3 3.5 – 5.1 2-3 1.8 – 2.6 3-4 5.2 – 6.8 3-4 2.7 – 3.4 4-5 6.9 – 8.5 4-5 3.5 – 4.3 5-6 8.6 – 10.2 5-6 4.4 – 5.1 6-7 10.3 – 11.9 6-7 5.2 – 6.0 3 1-2 1.4 – 2.9 9 1-2 0.7 – 1.4 2-3 3.0 – 4.3 2-3 1.5 – 2.1 3-4 4.4 – 5.8 3-4 2.2 – 2.8 4-5 5.9 – 7.2 4-5 2.9 – 3.6 5-6 7.3 – 8.6 5-6 3.7 – 4.3 6-7 8.7 – 10.1 6-7 4.4 – 5.0
Table 20, Score range per EB dimension
In the EBI template layout (figure 8) the color options of the dimensions scores are presented, which can be interpreted as explained in table 21.
Scale range Score color Score interpretation
1 – 2 Very attractive 2 – 3 Attractive 3 – 4 Somewhat attractive 4 – 5 Somewhat unattractive 5 – 6 Unattractive 6 – 7 Very unattractive
Table 21, Score interpretation
32 Figure 9 is an example of the EBI score of Google based on the results of the current study. The overall EBI score of Google was 36.4. When looking back at table 18, this score belongs to the scale range of 2-3 and the score can be interpreted as attractive. Therefore, it can be concluded that based on the results of the survey Google has an attractive EB reputation from the viewpoint of potential employees. Looking more in depth to the dimensions scores, it can be assumed that Development and Job Enrichment are somewhat unattractive from the viewpoint of potential employees.
33
6. DISCUSSION
The purpose of this study was to examine the definition of EB and additionally extend existing research by creating an EBI.
The findings of the literature review indicated that several definitions of EB were brought up in previous studies. The analysis shows that the main focus of EB lies in attracting potential employees and retaining current employees. It is a process to build an unique and identifiable employer identity. The current research has shown that there are several dimensions that contribute in creating an unique and identifiable employer identity.
With the help of previous empirical studies and further examination of the chosen EB items in this study, it was possible to develop and validate a new instrument. Therefore, a better understanding of EB is created in this study and along with choosing a suitable definition for the EB concept. The created instrument serves as the EBI to measure the EB reputation.
In comparison to the EmpAt scale (Berthon et al., 2005) the EBI has a lower reliability based on the Cronbach’s Alpha. The reliability of the EmpAt scale is set on 0.96 and the reliability of the EBI is 0.89. However, the EBI scale focuses on both current and potential employees, whereas the EmpAt scale only on potential employees. It is also arguable that an alpha of 0.89 is preferable to one of 0.96 as Streiner (2003) as well as Tavakol and Dennick (2011) indicate the maximum recommended value is 0.90, as higher values may show the measure is flawed due to redundancy.
Additionally, the current study extended previous research by creating the EBI focused on both potential employees as well as current employees. Thus, it introduces a new instrument in the EB literature. The EBI was built on ‘the three steps EB process’ (Backhaus & Tikoo, 2004) by selecting EB items that fits and represents the steps of the EB process.
In line with the hypotheses, the dimension Development kept its original items and contributes to the EB reputation of international companies. The other dimensions were categorized differently after the examination and item reduction but still indicated that they contribute to the EB reputation. These dimensions also comprehend with the findings of similar studies. The Interest value of Berthon et al. (2005) is supported in the dimension Working Climate and Organizational Identity. Working Climate also corresponds with the
34 Social value. The dimension Reputation and Development is in parallel with the Development value. Lastly, Corporate Social Responsibility matches with the Application value of Berthon et al. (2005).
As items of Tanwar and Prasad (2016) have been adopted as well to create the EBI, the dimensions Corporate Social Responsibility, Work-Life Balance, Development and Reputation are almost alike and support their proposal and research. The dimensions Organizational Identity and Recognition have comparable items of the Diversity dimension. Lastly the dimensions Recognition, Job Enrichment and Working Climate represent the dimension Organizational Culture of Tanwar and Prasad (2016).
The current study shows which dimensions and items can be used to measure the EB reputation of companies. As mentioned, the outcomes of the EBI are useful for companies so that they can strengthen their EB reputation. Additionally, they can retain their current employees as well as attract potential employees. Consequently, the EBI serves as a tool to measure the EB success characteristics in line with the typology of Moroko and Uncles (2008).
By using the outcomes of the EBI, companies can set their focus on certain dimensions in a strategically or practical way. Depending on the dimension, e.g. Development, the company can invest more in training whether these are training offered by a third party, training on the job, or even a workshop.
35
7. CONCLUSION
This study aimed to create a clearer concept of EB and its dimensions. The main goal of the research was to develop a single overall indicator to measure EB (EBI).
As mentioned, the research question of this study was:
How to integrate the divergent conceptions and measures on EB into a single overall indicator?
The current study showed that there are some similarities between the EB interpretations, however they cannot be seen as equivalent. To integrate the divergent conceptions of EB, literature review has first made a clearer concept of the EB definition. The definition used in this research “the process of building an identifiable and unique employer identity” (Backhaus & Tikoo, 2004: 502) along with ‘the three steps EB process’ of Backhaus & Tikoo (2004) made it possible to recognize the different EB measures.
To integrate the divergent conceptions, validated EB items from two studies (Berthon et al., 2005 and Tanwar & Prasad, 2016) were adapted and examined through a new survey. Through empirical findings the study supports the importance of previous researched EB items. The results indicate that there are nine EB dimensions (including 27 EB items) which can be used to measure the EB reputation through a single overall indicator:
1. Organizational Identity 2. Working Climate 3. Reputation 4. Development 5. Job Enrichment 6. Recognition
7. Corporate Social Responsibility 8. Work-Life Balance
9. Accountability
The proposed EBI gives companies insight into the attractiveness of their EB reputation. The overall EBI is measured through the EB dimensions, so companies can have a
36 detailed and clear view on which EB dimension(s) improvement can be made. The overall score ranges from 14-100 where 14 is considered as the highest score and thus an overall very attractive EB reputation. By improving their EB reputation, companies will be recognized as the desired employer of their branch.
Therefore, the results of this study extend previous researches through the development of a single overall indicator for EB.
Although this study is set to add to extant knowledge, there are some limitations that should be kept in mind. These limitations can also be seen as future research topics.
Firstly, the sample size and sample population in this study was only 102. Although it was focused on students with different study backgrounds, nationalities as well as different international companies, the sample population in this study was only focused on the potential employees. For the future, an analysis of the current employees will add more value to the validity of the EBI. To confirm and ensure the construct validity it is also necessary to test this study with a second study. As most researches prove their construct validity with a pilot study and the actual study. Furthermore, the sample size was too small to, for instance, examine a confirmatory factor analysis.
Secondly there was no data collected on a possible dependent variable. This study only laid its focus on the dimensions of EB and the creation of the EBI. However, in order to prove that all the EB dimensions also has predictive validity, it would be advantageous do count on a dependent variable and conduct a regression analysis to ascertain if all dimensions operate in a theoretically sustained way. The outcomes of these analyses could then confirm that the EB dimensions indicate their relative importance.
Regarding the EBI it should be kept in mind that if potential employees are the target group, the results would lead towards the EB awareness of potential employees towards that certain company. When having current employees as a target group, the results of the EBI will give an indication of the actual EB reputation of the company, as current employees have insight into all the EB dimensions of their employer.
For future research it would be interesting to study if EB activities (contributing to the EB dimensions) have actual effect on the EB reputation/awareness of the company.