PEJ2013
7th Annual Meeting of the Portuguese Economic Journal
International Competitiveness: is the reduction of wages a solution? An evaluation for the Portuguese case1,2
Elsa Cristina Vaz – Economics Department of University of Évora and CEFAGE Maria Paula Fontoura - ISEG - School of Economics and Management / Technical University of Lisbon, and UECE – Research Unit on Complexity and Economics
Abstract
The purpose of this paper is to analyse, in the case of Portugal, the effectiveness of a wage reduction - a current proposal since 2011 to help the country to reverse the high public and external debts - in promoting the efficiency and the international competitiveness of the economy. A static multi-sectoral and single-country general equilibrium model will be used with data from GTAP7 Data Base. The model allows to measure changes by sector. The simulations performed show that extending the reduction of wages already deployed by the government in the public sector to the private one leads to a positive impact on employment (both skilled and unskilled labour), production and volume of exports in all sectors except those that are R&D intensive, characterized by a low weight in the Portuguese economy. However it is possible that the positive results in terms of external competitiveness are not sustainable as the impact on productivity is negative, albeit small, for most sectors. There is also reason for concern regarding the observed deterioration of the trade balance of most sectors, the exception being the traditional labour intensive sectors that show good prospects in this respect.
1 The financial support received from Fundação para a Ciência e a Tecnologia (program PEst-OE/EGE/UI0436/2011) is gratefully acknowledged.
, ,
r rr s
pwe per rr s, , err rr, *pwer rr s, ,
1 ter rr s, ,
pr non," "emgr s,2 The authors are grateful for the comments received from anonymous at the conference "EcoMod2012" in Seville.
, ,
r rr s
KEYWORDS: Competitiveness, wages, Stability and Growth Pact; General Equilibrium Model, Portugal.
1. Introduction
To address huge macroeconomic imbalances, in the aftermath of the
late-2000s financial crisis, several EU economies had to implement Stability and Growth Programs (SGP) using very restrictive options of fiscal and other policies aiming macroeconomic stability, usually designated by austerity plans.
Portugal is one of the EU countries that suffered such a severe economic
disruption and unsustainable fiscal and external debts that needed to sign a bail-out
agreement with the European Union and International Monetary Fund to reduce the
excess debt levels. In April 2011, Portugal, following Greece and the Republic of Ireland, began receiving a financial support from the European Union (totalling 78
billion-euro) through the European Financial Stability Mechanism (EFSM) and the
European Financial Stability Facility (EFSF). As a consequence, the country had to implement, in the context of the Memorandum of Economic and Financial Policies signed with Troika (European Commission, International Monetary Fund and European Central Bank), very restrictive SGP policies. Since then the government faces tough choices in its attempts to stimulate the economy, while struggling to reduce its public deficit to around the EU average.
One of the most important discussions in countries involved in similar SGP programs is how to increase production in order to allow the economy to resume a path of economic growth in a context of harsh austerity measures. In the case of Portugal, which displays accentuated decreasing levels of consumption and investment, both domestic and foreign, hopes are focused in the growth of exports through gains in international competitiveness.
It is generaly acknowledged that promotion of international competitiveness can be done through three distinct pathways. The first is to reduce the costs of
productive factors, including labour costs, generating a decrease in the unit cost per unit of the final product. The second is based on increasing production without changing the resources used, which is an effective increase of productivity. The third is to increase product differentiation in order to reduce the market share of the international competitors.
The two latter alternatives to increase competitiveness imply, respectively, a scale effect of the investment with increased motivation of the workers and the reorganization of business structures, and the diversification of the varieties produced, either keeping the quality or introducing changes in the production and the management structures allowing to up-grade quality; in any case, they are not easy to implement in an economy facing a serious economic recession. Therefore, these paths of promoting efficiency have been in practice disregarded in the short term by the majority of the Portuguese political and economic actors.
The easiest solution, if viable, is naturally to reduce wages. Indeed, between 2009 and 2013, the cumulative reduction will reach a predicted value of more than 12.3 per cent. Contributing to this drop in earnings was cutting Christmas and holiday subsidies
for civil servants in the end of 2011 and mid-2012 , corresponding to the 13th and 14th
months, i.e. approximately -14 per cent of the annual salary, and the wage adjustment that has been happening in the private sector, particularly due to the increase in unemployment (estimated to be over 15 per cent in 2012), in part fostered by a policy of promoting labour flexibility that forces workers to accept lower wages.
The purpose of this study is to analyse the impact of a wage reduction across all sectors in promoting positive impacts on production, employment, productivity and international trade. For that purpose we use a static multi-sectoral and single-country general equilibrium model, using the data from GTAP7 Data Base for the base year of
2004.3 Labour will be disaggregated at two levels of qualification. Section 2 presents the
model while the results of the simulations are shown in section 3. Section 4 concludes.
3 Note that this type of model is static as it takes into account the effect of the investment in the adjustment of the economy in a very rudimentary way, by considering the investment goods and a bank that makes the allocation by sectors. In future developments of this analysis we intend to introduce dynamics in the model.
, ,
r rr s
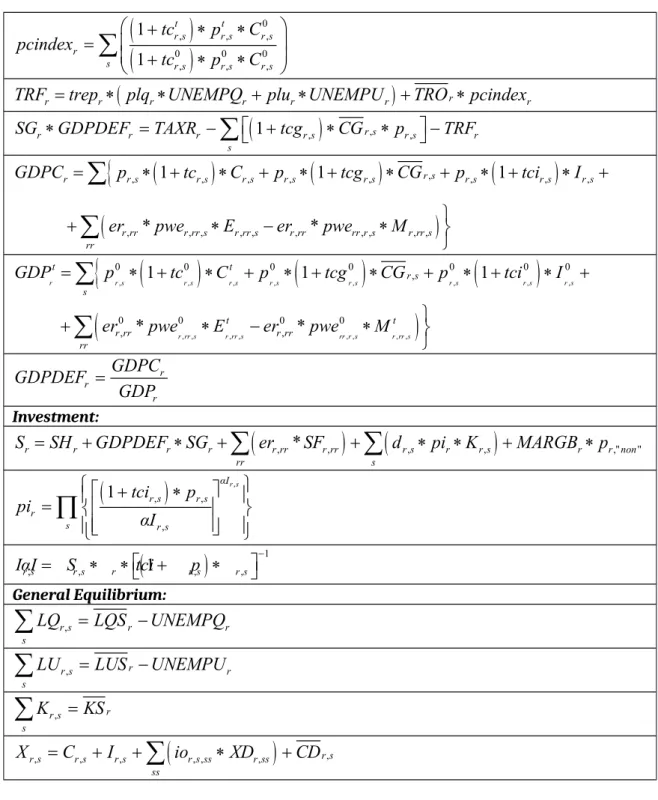
2. The model
In this model the productive sector is characterised by the existence of six profit maximiser sectors that produce six types of goods and supply, in accordance with a nested production function, with capital, labour (skilled and unskilled) and intermediate goods (also a composite good). At the first level, a Leontief technology is employed, with the value added and intermediate goods as factors of production. At the second level, we have, on the one hand, the value added as a constant elasticity of substitution (CES) function with constant returns to scale, along with capital and labour as factors of production, and on the other hand, the intermediate goods as a Leontief technology function.
A representative family is used as a proxy for all consumers, owning all production factors.
The consumer’s optimal choice is determined by maximising the LES utility function, which is subject to the budgetary constraint that relates the income available for consumption with the value of expenses.
The unemployment is endogenised using a wage curve type of relationship between the rate of change in the real gross wage rate and the rate of change in the unemployment rate.
The demand for investment is included in the model very simply by considering investment as investment goods valued at market prices (including taxes). An entity allocates savings across investment goods, in all sectors, in accordance with the Cobb-Douglas utility function that is maximised, subject to the constraint of total savings.
Finally, the model is closed considering that public expenses are constant and revenues result from different fixed tax rates, assuming the small country condition applied to Portugal and supposing that flexible capital formation exists because all savings are valued in national currency and that the investment corresponds to the sectorial allocation of savings using fixed proportions.
The hypothesis to simulate with GTAP database, version 7, will be the administrative reduction of costs corresponding to the value of two salaries, as implemented by the government in the public sector.
We disentangle between skilled and unskilled labour. For skilled and unskilled labour, respectively, we have:
PLQ → PLQ ×Φqr , s
PLU → PLU ×Φur , s
where PLQ and PLU are, respectively, wages for skilled and unskilled labour and
Φqr ,s and Φur ,s are the parameters to discriminate the reduction of wages by
sectors.
The equations of our model and the description of the variables 4 are in tables I
and II in the Appendix 1, respectively. Table III in the Appendix 1 presents the sectoral aggregation and Table IV shows the structure of production and exports presented according to the sectoral aggregation used. Finally, the numerical results of the simulations are shown in tables V to VIII in the Appendix 2.
3. A simulation for the Portuguese economy
As a preliminary essay, we have cut wages in all sectors and type of labour in the amount implemented by the Portuguese government in the case of the civil servants by the end of 2011 and mid-2012: the cancellation of two months salary, corresponding to the 13th and 14th months, i.e. approximately -14% of the annual salary.
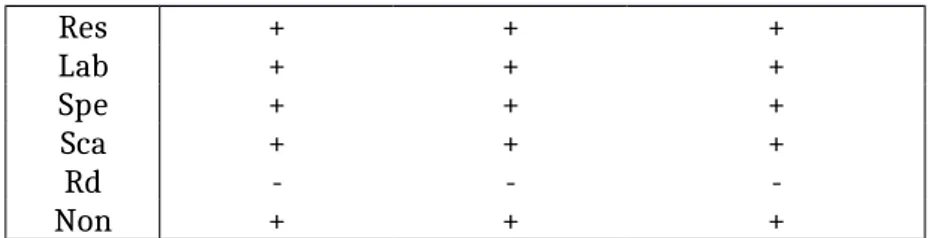
Table 1 shows the impacts on employment by type of labour (skilled and unskilled) and on production.
Table 1 – Impacts on employment and production (%)
LQ LU VAB
4 For more details about the model, see Vaz, E. (2012).
, ,
r rr s
Res + + + Lab + + + Spe + + + Sca + + + Rd - - -Non + + +
Note: results in Table V in Appendix 2.
We observe that this cost reduction would improve the value added as well as the use of both types of labour, reducing the unemployment, in all sectors except in the R&D intensive sector, i.e. in a sector which represents a small weight in the Portuguese economy (table IV in Appendix 1). Note that the model precludes rigidity of labour market since the proportion assumed for the wages cut is the same in all sectors.
An interesting result of the simulations is that in a longer term the market adjustment will produce a (small) positive variation in the wages of both types of labour, skilled and unskilled, as a result of the positive impact of cutting wages on production, while the price of capital declines as a consequence of the substitution of capital for labour due to the reduction of labour costs (Table VI in Appendix 2).
Turning now to the impacts on trade, Table 2 shows the results of the simulations for exports, imports and the trade balance by sector. Note that while exports and imports are measured in volume, the trade balance is measured in value5.
Table 2 – Impacts on trade
Exports Imports Trade Balance
Res + -
-Lab + - +
Spe + +
-Sca + +
-5 In the Armington condition the international price of exports (pwer rr s, , ) does not vary however
the export price at the national currency varies according to the expression:
, , , * , , 1 , , ," " ,
r rr s r rr r rr s r rr s r non r s
pe er pwe te p emg
. This explains why there may be an increase in the volume of exports and a decrease in the volume of imports and simultaneously a negative trend in the trade balance.
Rd - - +
Non + -
-Note: results in Table VII in Appendix 2.
We observe that in all sectors but one, and once more the exception is the small R&D intensive sector, wages cut produce a positive variation in the volume of exports. However, in some sectors (namely in the “Spe” sector, which includes electronic equipment and some machinery, and the “Sca” sector, which includes scale and capital intensive sectors, such as chemical products and motor vehicles) imports also record a positive variation, contributing to a negative impact on the trade balance of these sectors. Indeed, the only sector with relevance in production and exports of Portugal that depicts a positive trend on its trade balance is “Lab”, which includes the labour intensive industries.
Finally, table 3 displays the results for the indices of productivity. Increasing productivity has been incessantly advocated as the best solution to increase international competitiveness of the Portuguese economy to the extent that it is the way of consistently reducing the high unit costs (see, for instance, IMF, 2010). However, the results of the simulations show negative impacts on productivity of both skilled and unskilled labour except in the sector “Non”. Moreover if we consider also the capital factor (in the multifactor column of Table 3), even the
“Non” sector shows a negative productivity trend6.
Table 3 – Impacts on Productivity
Productivity
Skilled Labour Unskilled LabourProductivity ProductivityMultifactor
Res - - -Lab - - -Spe - - -Sca - - -Rd - - -Non + +
-Note: results in Table VIII in Appendix 2.
6pwer rr s, , per rr s, , err rr, *pwer rr s, ,
1 ter rr s, ,
pr non," "emgr s, Note that we use a Leontief production function for the primary inputs and therefore the factors are used in fixed proportions. If productivity increases for labor but decreases when we add the capital factor, the reason is that the capital employed increased at a higher rate than the production.A major contribution of this study is thus to show that reducing wages may decrease productivity, putting into question the sustainability of the external competitiveness that apparently is promoted using this (controversial) economic policy measure.
4. Concluding remarks
The simulations performed show that a wage reduction in the Portuguese case may induce a positive variation in employment (both of skilled and unskilled labour), production and exports volumes. The exception to these trends occurs in a sector that is not representative of the Portuguese economy.
However, there are reasons to suspect that the positive result for exports do not lead to a sustainable increase in trade competitiveness as the simulated impacts on productivity are negative (albeit small) for most sectors, with both types of labour. Besides, simulations point to a negative effect (albeit small) on the trade balance of most sectors, due in part to a positive variation in the value of import (especially due to the price increase). In fact, only approximately one fourth of Portuguese exports record a positive trend for the trade balance, especially the labour-intensive sectors (“Lab”).
This exercise allows concluding how important it is to ponder all the effects of a measure of economic policy. This is especially true in a context of a deep crisis as it happens in the present time.
A possible additional step of this analysis could be to test whether the reduction of price / cost of goods in the non-tradable sector (easier to implement in the short term and achieved especially by administrative means) improves the performance of the tradable sector. The main drawback in this type of exercise is to properly disentangle between both types of sectors.
Bento, V. (2011) – O nó cego da Economia, bnomics.
IMF (2010) – Portugal: Staff Report; Public Information Notice on the Executive Board Discussion; and Statement by the Executive Director for Portugal, IMF Country Report nº 10/18, January.
Vaz, E. (2012) – Sectoral Leadership in International Competitiveness: the Portuguese case, Applied Economics Letters, 19, 1319-1330
Appendix 1 – Equations of the model and Sectorial Aggregation Table I: Equations of the model
Production and trade:
, , , , , , , , , 1 , , , . , , . , , 1 1 1 . , , . , , 1 1 1 1 r s r s r s r s r s r s r s r s r s σF σF r s r s r s r s r r r s r s r s r r r s σF r s σF σF σF σF σF σF r s r r s r s r s r r s r s XDγFk K tk pk pi dγFk aF tk pk pi dtlq plqγFq q tlu plu γFu u
, , , , , , , , , 1 , , , . , , . , , 1 1 1 . , , . , , 1 1 1 1 r s r s r s r s r s r s r s r s r s σF σF r s r s r s r s r r r s r s r s r r s σF r s σF σF σF σF σF σF r s r r s r s r s r r s r s XDγFq LQ tk pk pi dγFk aF tlq plq qtlq plq qγFq tlu plu u γFu
, , , , , , , , , 1 , , , . , , . , , 1 1 1 . , , . , , 1 1 1 1 r s r s r s r s r s r s r s r s r s σF σF r s r s r s r s r r r s r s r s r r s σF r s σF σF σF σF σF σF r s r r s r s r s r r s r s XDγFu LU tk pk pi dγFk aF tlu plu utlq plq qγFq tlu plu u γFu
, , , , , , , , , , , , , , , , , , 1 1 1 1 1 r s r s r s r s r r r s r s r s r r s r s r r s r ss s r s r ss r ss s ss r s r s txd pd XD tk pk pi d K tlq plq q LQ tlu plu u LU io XD p tcf
, , , , , , , , , , , , 1 , , 1 1 , , , , , , 1 1 r s r s r s r s r s r s r s r rr s r rr s r s σT σT σT σT r rr s σT σT σT r s rr r s r rr s rr rr r s r s γT XD XDDγT pe γT pdd aT pdd
, , , , , , , , , , , , 1 1 1 , , , , , , , , , , 1 r s r s r s r s r s r s r s r rr s r rr s r s σT σT σT σT σT σT σT r s r rr s r rr s r rr s rr rr r s r rr s XDγT EγT pe γT pdd aT pe
, , , , , , , , r s r s r s r s r rr s r rr s rr pd XD pdd XDD
pe E
, , , , , , , , , , , , , 1 , , 1 1 , , , , , , 1 1 r s r s r s r s r s r s r s r rr s r rr s r rr s σA σA σA σA r rr sσA σA σA
r s rr r s r rr s rr rr r s r s γA X XDDγA pm γA pdd aA pdd
, , , , , , , , , , , , , 1 1 1 , , , , , , , , , 1 r s r s r s r s r s r s r s r rr s r rr s r rr s σAσA σA σA
σA σA σA
r s r rr s r s r rr s rr rr r s r rr s XγA MγA pm γA pdd aA pm
, , , , , , , , r s r s r s r s r rr s r rr s rr p X pdd XDD
pm M , , , , r rr s rr r s M E
, , , * , , 1 , , ," " , r rr s r rr r rr s r rr s r non r s pe er pwe te p emg
, , 1 , , , * , , ," " , , r rr s r rr s r rr rr r s r non r rr s pm tm er pwe p mg
, , , , , , , , , r rr rr r s r rr s r rr s r rr s s SF
pwe M pwe M
, , , , , , ,
r r rr s r rr s r s r rr s rr s MARGB
mg M emg E Representative Household:
, , 1 , , , 1 , r r r r r r r r r r r s r s r s r s r s r s s sYH pk KS plq LQS UNEMPQ plu LUS UNEMPU
TRF plq q LQ plu u LU
r r r r r r SH mps YH ty YH TRF
r r r r r r CBUD YH ty YH TRF SH
, , , , , , , , , , 1 1 1 r s r s r s r s r s r s r s r r ss r ss r ss ss tc p C tc pμH αH CBUD tc p μH
Unemployment: 0 0 1 0 0 1 t t t t r r r r r r r r r plq pcindex UNEMPQ LQS elasU plq pcindex UNEMPQ LQS 0 0 1 0 0 1 t t t t r r r r r r r r rplu pcindex UNEMPU LUS
elasU
plu pcindex UNEMPU LUS
Government:
, , , , , , , , , , , , , , , , , , , , , , , , * , , , , r s r r r r r s r s r s r s r s r s s r ss s r ss s r ss r s r s r r s ss r s r r s r s r s r r s r s r rr s r rr rr r s r rr s TAXR ty YH TRF p tc C tcg CG tci I tcf io p XD tk pk K tlq plq q LQ tlu plu u LU tm er pwe M te
, , , , , , ,
, , , * r rr s r rr r rr s r rr s rr r s r s r s er pwe E txd pd XD
0 , , , 0 0 0 , , , 1 1 t t r s r s r s r s r s r s r s tc p C pcindex tc p C
r r r r r r r rTRF trep plq UNEMPQ plu UNEMPU TRO pcindex
1 ,
r s, , r r r r s r s r s SG GDPDEF TAXR
tcg CG p TRF
, , , , , , , , , , , , , , , , , , , 1 1 1 * * r s r r s r s r s r s r s r s r s r s r rr r rr s r rr s r rr rr r s r rr s rr GDPC p tc C p tcg CG p tci I er pwe E er pwe M
, , , , , , , , , , , , , , , , 0 0 0 0 0 0 0 , 0 0 0 0 , , 1 1 1 * * r r s r s r s r s r s r s r s r s r rr s r rr s rr r s r rr s t t r s s t t r rr r rr rr GDP p tc C p tcg CG p tci I er pwe E er pwe M
r r r GDPC GDPDEF GDP Investment:
, * ,
, ,
," " r r r r r rr r rr r s r r s r r non rr s S SH GDPDEF SG
er SF
d pi K MARGB p
, , , , 1 αIr s r s r s r s r s tci p pi αI
1 , , 1 , , r s r s r r s r s IαI S tci p General Equilibrium: , r r s r s LQ LQS UNEMPQ
, r r s r s LU LUS UNEMPU
, r r s s K KS
, , , , , , , r s r s r s r s r s ss r ss ss X C I
io XD CDTable II – Description of the variables and the parameters Endogenous variables:
r
pk Capital price
r
r
plu Unskilled labour price
r
pi
User cost of capital (investment function),
r s
p Composite price of good sold in the domestic market
,
r s
pd
Price of domestic production,
r s
pdd
Price of domestic production for domestic market, ,
r rr s
pe Price of exports in domestic market
, ,
r rr s
pm
Price of impost in domestic market, ,
r rr s
pwe FOB price of exports
,
r rr
er Exchange rate
r
pcindex
Laspeyres price index,
r s
X Total supply in domestic market
,
r s
XD Domestic production
,
r s
XDD Domestic production for domestic market
, , r rr s E Exports , r s M Imports , r s K Capital demand , r s
LQ Skilled labour demand
,
r s
LU Unskilled labour demand
,
r s
C Consumption of goods and services
r
CBUD Income available for consumption
r
YH Household income
r
GDP Gross domestic product at market prices
r
GDPC Gross domestic product at constant prices
r
GDPDEF Gross domestic product at market prices deflator
r
SH House hold savings
r SG Government savings r S Total savings , r rr
SF Balance on goods and services
r
MARGB Balance on transport margins related to international trade ,
r s
I Investment goods demand
r
UNEMPQ Skilled labour unemployment
r
UNEMPU Unskilled labour unemployment
r
TAXR Total tax revenues
r
TRF Total transfers of Government
r
KS Capital supply
r
LQS Skilled labour supply
r
LUS Unskilled labour supply
r
TRO Other transfers of Government
,
r s
CG Government demand for goods and services
Parameters: r ty Taxes on income , r s txd Taxes on production , r s
tc Taxes on household consumption
, ,
r ss s
tcf Taxes on intermediate consumption
,
r s
tci Taxes on investment consumption ,
r s
tcg Taxes on government consumption
.
r s
tk Taxes on the use of capital
.
r s
tlq Taxes on the use of skilled Labour
.
r s
tlu Taxes on the use of unskilled Labour
, , r rr s tm Customs taxes , , r rr s te Taxes on exports , , r rr s
mg Transport margins on imports
,
r s
emg Transport margins on exports
,
r s
d Depreciation rate of capital
,
r s
aF Parameter efficiency of the production function
,
r s
γFk Distribution parameter of capital
,
r s
γFq Parameter distribution of skilled labor
,
r s
γFu Parameter distribution of unskilled labor
,
r s
σF Elasticity of substitution between production factors
,
r s
aT Efficiency parameter of CET function
, ,
r rr s
γT Distribution parameter of exports
,
r s
σT Transformation elasticity
,
r s
aA Efficiency parameter of the Armington function
, ,
r rr s
γA Distribution parameter of total imports
,
r s
σA Elasticity of substitution between domestic and imported goods
,
r s
αH Exponent of the Household utility function (LES)
,
r s
αI Income elasticity of demand for goods and services for
investment
,
r s
μH Minimum consumption
r
, ,
r ss s
io Technical coefficients
r
trep Weight of unemployment benefits in average salary ,
r s
u
parameters to discriminate the reduction of unskilled labour
wages ,
r s
q
parameters to discriminate the reduction of skilled labour wages
r
elasU Unemployment elasticity
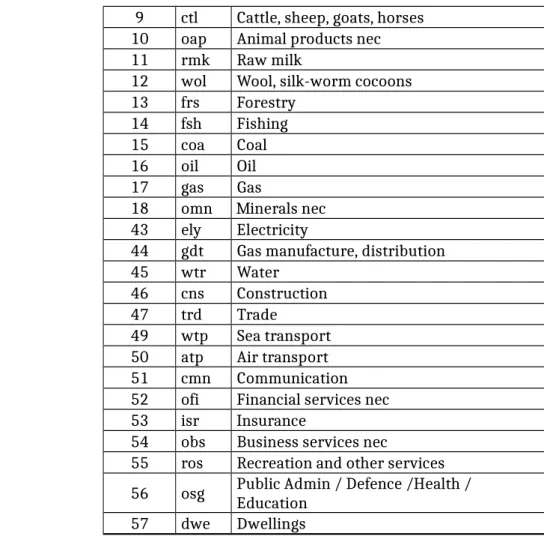
Table III– Description of the Sectorial Aggregation Sectorial Aggregation Number Code Description
Resource intensive (res)
19 cmt Meat: cattle, sheep, goats, horse 20 omt Meat products nec
21 vol Vegetable oils and fats 22 mil Dairy products
23 pcr Processed rice 24 sgr Sugar
25 ofd Food products nec
26 b_t Beverages and tobacco products 30 lum Wood products
32 p_c Petroleum, coal products 34 nmm Mineral products nec 36 nfm Metals nec
Labour intensive (lab)
27 tex Textiles
28 wap Wearing apparel 29 lea Leather products 37 fmp Metal products 42 omf Manufactures nec Specialised suppliers
(spe)
40 ele Electronic equipment
41 ome Machinery and equipment nec Scale and Capital
intensive (sca)
31 ppp Paper products, publishing 33 crp Chemical, rubber, plastic prods 35 i_s Ferrous metals
38 mvh Motor vehicles and parts 48 otp Transport nec
R&D intensive (rd) 39 otn Transport equipment nec
Non industrial &non classified (non)
1 pdr Paddy rice
2 wht Wheat
3 gro Cereal grains nec 4 v_f Vegetables, fruit, nuts 5 osd Oil seeds
6 c_b Sugar cane, sugar beet 7 pfb Plant-based fibers 8 ocr Crops nec
9 ctl Cattle, sheep, goats, horses 10 oap Animal products nec 11 rmk Raw milk
12 wol Wool, silk-worm cocoons 13 frs Forestry
14 fsh Fishing 15 coa Coal 16 oil Oil 17 gas Gas
18 omn Minerals nec 43 ely Electricity
44 gdt Gas manufacture, distribution 45 wtr Water
46 cns Construction 47 trd Trade
49 wtp Sea transport 50 atp Air transport 51 cmn Communication 52 ofi Financial services nec 53 isr Insurance
54 obs Business services nec
55 ros Recreation and other services 56 osg Public Admin / Defence /Health / Education 57 dwe Dwellings
Table IV – Sectoral structure of production and exports (2004)
Production Exports Res 12.12 13.79 Lab 8.19 22.86 Spe 5.14 17.07 Sca 8.77 20.89 Rd 0.18 1.25 Non 65.60 24.14 Total 100.00 100.00
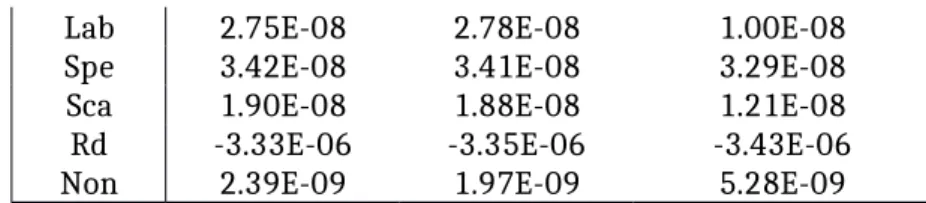
Appendix 2 – Numerical results of the simulations
Table V – Impacts on employment and production (%)
LQ LU VAB
Lab 2.75E-08 2.78E-08 1.00E-08 Spe 3.42E-08 3.41E-08 3.29E-08 Sca 1.90E-08 1.88E-08 1.21E-08 Rd -3.33E-06 -3.35E-06 -3.43E-06 Non 2.39E-09 1.97E-09 5.28E-09
Table VI: Impacts on prices (%) Price of skilled Labour: 7.21E-09 Price of unskilled labour: 7.24E-09 Price of capital: -8.58E-10
Table VII – Impacts on trade (%)
Exports Imports Trade Balance
Res 2.52E-08 -4.57E-09 -5.25E-08
Lab 4.27E-08 -7.05E-09 1.78E-07
Spe 5.51E-08 1.94E-09 -5.53E-08
Sca 3.39E-08 1.43E-10 -3.93E-08
Rd -3.29E-06 -1.05E-07 3.09E-06
Non 2.33E-08 -5.33E-09 -1.46E-07
Table VIII - Impacts on productivity (%)
Productivity
Skilled Labour Unskilled LabourProductivity ProductivityMultifactor
Res -3.20E-09 -2.94E-09 -8.96E-09
Lab -1.26E-08 -1.29E-08 -3.01E-08
Spe -1.53E-09 -1.42E-09 -7.91E-09
Sca -5.71E-09 -5.60E-09 -1.46E-08
Rd -3.94E-08 -1.82E-08 -3.32E-07