Repositório ISCTE-IUL
Deposited in Repositório ISCTE-IUL: 2019-06-06
Deposited version: Post-print
Peer-review status of attached file: Peer-reviewed
Citation for published item:
António, N., de Almeida, A. & Nunes, L. (2019). Big data in hotel revenue management: exploring cancellation drivers to gain insights into booking cancellation behavior. Cornell Hospitality Quarterly. N/A, 1-22
Further information on publisher's website: 10.1177/1938965519851466
Publisher's copyright statement:
This is the peer reviewed version of the following article: António, N., de Almeida, A. & Nunes, L. (2019). Big data in hotel revenue management: exploring cancellation drivers to gain insights into booking cancellation behavior. Cornell Hospitality Quarterly. N/A, 1-22, which has been published in final form at https://dx.doi.org/10.1177/1938965519851466. This article may be used for non-commercial purposes in accordance with the Publisher's Terms and Conditions for self-archiving.
Use policy
Creative Commons CC BY 4.0
The full-text may be used and/or reproduced, and given to third parties in any format or medium, without prior permission or charge, for personal research or study, educational, or not-for-profit purposes provided that:
• a full bibliographic reference is made to the original source • a link is made to the metadata record in the Repository • the full-text is not changed in any way
The full-text must not be sold in any format or medium without the formal permission of the copyright holders. Serviços de Informação e Documentação, Instituto Universitário de Lisboa (ISCTE-IUL)
Av. das Forças Armadas, Edifício II, 1649-026 Lisboa Portugal Phone: +(351) 217 903 024 | e-mail: [email protected]
Big data in hotel revenue management: Exploring cancellation drivers to
gain insights into booking cancellation behavior
Abstract
In the hospitality industry, demand forecast accuracy is highly impacted by booking
cancellations, which makes demand management decisions difficult and risky. In attempting to minimize losses, hotels tend to implement restrictive cancellation policies and employ
overbooking tactics, which in turn reduces the number of bookings and reduces revenue. To tackle the uncertainty arising from booking cancellations, we combined the data from eight hotels’ property management systems with data from several sources (weather, holidays, events, social reputation, and online prices/inventory) and machine learning interpretable algorithms to develop booking cancellation prediction models for the hotels. In a real production environment, improvement of the forecast accuracy due to the use of these models could enable hoteliers to decrease the number of cancellations, thus increasing confidence in demand management decisions. Moreover, this work shows that improvement of the demand forecast would allow hoteliers to better understand their net demand, i.e., current demand minus predicted
cancellations. Simultaneously, by focusing not only on forecast accuracy but also on its explicability, this work illustrates one other advantage of the application of these types of techniques in forecasting: the interpretation of the predictions of the model. By exposing
enable the adjustment of a hotel’s cancellation policies and overbooking tactics according to the characteristics of its bookings.
Keywords: big data; forecasting; prediction; machine learning; revenue management
1 Introduction
Revenue management’s objective – increasing revenue – is achieved through demand
management decisions, i.e., by estimating demand and its characteristics while implementing price and capacity control to “manage” the demand (Talluri & Van Ryzin, 2005, p. 2). Thus, revenue management is concerned with the methodologies and systems required to make decisions regarding demand. Forecast performance is a critical tool for revenue management systems (RMS). Without accurate forecasts, RMS’ rate and availability recommendations would probably be highly inaccurate (Talluri & Van Ryzin, 2005; Larry R. Weatherford & Kimes, 2003). In fact, estimation and forecasting is one of the essential steps in the well-known four-step cyclical revenue management process of data collection, estimation and forecasting,
optimization, and control (Talluri & Van Ryzin, 2005).
Together with room nights, arrivals, and price sensitivity, booking cancellations are one of the topics of hotel revenue management forecasts (Talluri & Van Ryzin, 2005; Larry R. Weatherford & Kimes, 2003). With cancellations affecting 20% to 60% of the bookings received by hotels (P. H. Liu, 2004; Morales & Wang, 2010), an accurate forecast for booking cancellations is of major importance in determining the hotel net demand, i.e., the demand that remains after deducting predicted cancellations and no-shows (Rajopadhye, Ghalia, Wang, Baker, & Eister, 2001; Talluri & Van Ryzin, 2005). Since bookings usually allow customers to cancel a service with or without penalties prior to its provision, hotels must assume the risk of guaranteeing rooms for customers
who honor their bookings; however, at the same time, hotels must support the cost of having vacant rooms when customers cancel or do not show up (Talluri & Van Ryzin, 2005). To mitigate this risk, hotels implement overbooking and restrictive cancellation policies (Hayes & Miller, 2011; Hwang & Wen, 2009; Ivanov, 2014; Mehrotra & Ruttley, 2006; Smith, Parsa, Bujisic, & van der Rest, 2015; Talluri & Van Ryzin, 2005; Toh & Dekay, 2002). However, both overbooking and restrictive cancellation policies can have a negative effect on hotel
performance. On one hand, overbooking can force the hotel to deny service to a customer; this can be a very bad experience for the customer and may result in online complaints and
generation of a negative impact in terms of social reputation (Guo, Dong, & Ling, 2016). Of course, another negative effect is the loss that occurs as a result of the hotel’s obligation to compensate the customer, including reallocation costs (Noone & Lee, 2011). Additionally, the hotel may also incur loss of future revenue; this is associated with the possibility that dissatisfied customers might not book the same hotel again (Mehrotra & Ruttley, 2006). On the other hand, restrictive cancellation policies, especially policies that require nonrefundable deposits and cancellation deadlines greater than 48 hours, can lead both to a decrease in the number of bookings and to a decrease in revenue due to the associated price discounts (C.-C. Chen, Schwartz, & Vargas, 2011; Park & Jang, 2014; Smith et al., 2015).
To reduce the negative consequences of overbooking and restrictive cancellation policies, forecasted cancellation and no-show rates are used as key inputs in RMS (Morales & Wang, 2010; Talluri & Van Ryzin, 2005). Although the words “forecasting” and “prediction” are considered synonyms and are employed interchangeably (Clements & Hendry, 1998; Matsuo, 2003), scientifically speaking they have different meanings and definitions. While forecasting aims to calculate or predict future events, usually events associated with a time series, prediction
can also be used to reconstruct and explain past outcomes (Lewis-Beck, 2005; Matsuo, 2003). In revenue management, authors such as Talluri & Van Ryzin (2005) employ the term “estimation” as a synonym for prediction – understanding the past to estimate the future. In fact, as
acknowledged by Shmueli (2010), resorting to statistical modeling for causal explanation without employing predictive modeling in a way neglects the significance of existing theories and their capacity to uncover novel causal mechanisms. Understanding past behavior and predictive power is fundamental to improving overbooking tactics and cancellation policies (Antonio, Almeida, & Nunes, 2017a; Falk & Vieru, 2018; Morales & Wang, 2010).
In its initial stage, research on booking cancellation forecasting and prediction was mainly related to airlines and relied on a single data source (Iliescu, Garrow, & Parker, 2008; Lemke, Riedel, & Gabrys, 2013; Petraru, 2016). Commonly, time series historical aggregated data or detailed booking data in the Passenger Name Record (PNR) format, a standard created by the airline industry (International Civil Aviation Organization, 2010), were used. However, it is believed that the use of industry-specific data sources such as hotels’ Property Management Systems (PMS), together with weather forecasts, events, and macroeconomic data, may improve forecast accuracy (Chiang, Chen, & Xu, 2007; Ivanov & Zhechev, 2012; McGuire, 2017; Pan & Yang, 2017b; Talluri & Van Ryzin, 2005). As a matter of fact, the use of multiple data sources and different data types (structured and unstructured) is one of the characteristics of “big data” known as “variety”. The other two characteristics are volume and velocity (Günther, Rezazade Mehrizi, Huysman, & Feldberg, 2017; McGuire, 2017; Wang, Yoonjoung Heo, Schwartz, Legohérel, & Specklin, 2015).
Although several authors advocate the development and use of booking cancellation forecast and prediction models to improve demand forecasts in revenue management (C.-C. Chen, 2016;
Hueglin & Vannotti, 2001; Lemke et al., 2013; Morales & Wang, 2010; Talluri & Van Ryzin, 2005), research on this topic is still sparse, particularly for the hotel industry (Benítez-Aurioles, 2018; C.-C. Chen, 2016; Falk & Vieru, 2018). To the best of our knowledge, no study has attempted to improve hotel demand forecasting by employing big data in booking cancellation prediction. The present work will fill this gap by building machine learning models that can be used to predict hotel booking cancellations using large volumes of data from multiple sources. This is aimed to answer the challenges mentioned by Antonio et al. (2017a) and Pan & Yang (2017b) regarding possible performance improvement in demand forecasting, more specifically in the prediction of booking cancellation probability based on the use of big data. In addition, we will confirm the benefits of employing big data in hospitality research forecasting (McGuire, 2017; Pan & Yang, 2017b; Talluri & Van Ryzin, 2005; Wang et al., 2015; Zhang, Shu, Ji, & Wang, 2015). Finally, rather than targeting only forecast accuracy as many big data forecasting studies have done (Hassani & Silva, 2015), we also wish to use the algorithms’ interpretability features to explore other advantages of using big data and advanced prediction algorithms to understand whether the variables’ predictive power holds for all hotels and to identify the drivers behind the cancellation of bookings, an area that is in need of further research (Falk & Vieru, 2018; Morales & Wang, 2010).
2 Literature review
2.1 Forecast and prediction in revenue management
Forecasting is considered one of the five areas of revenue management problems (the others are pricing, auctions, capacity control, and overbooking) (Chiang et al., 2007). It is not surprising that forecasting is a topic addressed by a large proportion of revenue management publications (Ivanov & Zhechev, 2012). In a survey of the use of forecasting models in revenue management,
Weatherford (2016) found that 83 articles on this subject were published between 1958 and 2016. However, only six of these articles were specific to hotel demand forecasting. Another review of the literature on revenue management in hospitality and tourism reported that of a total of 158 studies published from 2004 to 2013, 10 concerned demand forecasting (Denizci Guillet & Mohammed, 2015). After pricing and customer and distribution channel management, demand forecasting was one of the dominant topics in revenue management research.
Based on Lee (1990), Ivanov & Zhechev (2012) and Larry R. Weatherford & Kimes (2003) classified forecasting methods as historical, advanced booking and combined. Historical methods are based on traditional forecasting methods such as various forms of exponential smoothing (e.g., simple or weighed moving average), time series, or linear regression. Advanced booking methods use the number of reservations on hand to forecast future bookings. These methods are further divided into additive (e.g., classical or advanced pickup), multiplicative (e.g., synthetic booking curve), and other time series. Combined methods, as the name indicates, use a
combination of historical and advanced booking methods. Until the year 2000, traditional forecasting methods, which are mostly based on time-series methods and historical time series data, were the only types of methods and data used in revenue management demand forecasting (Pereira, 2016; L. Weatherford, 2016). Technological advances in processing power, big data, and artificial intelligence have facilitated the development of new forecast/prediction methods and of algorithms that make it possible to solve larger and more complex mathematical problems. A few interesting examples demonstrate the potential of big data in the tourism and hospitality fields. For example, Pan & Yang (2017a) used search engine queries, website traffic and weather data to forecast hotel occupancy. Song & Liu (2017) presented a framework for predicting tourism demand. Liu, Teichert, Rossi, Li, & Hu (2017) employed big data to
investigate language-specific drivers of hotel satisfaction. Kahn & Liu (2016) showed how electricity big data could be used to help hotels improve energy efficiency. The same could be said concerning the application of artificial intelligence in the tourism and hospitality fields, particularly with regard to the application of machine learning techniques. These are models that are built using a set of test data and deployed on unknown data. Logistic regression, clustering, decision trees, and neural networks are some of the algorithms classified as machine learning algorithms (McGuire, 2017). Although there is some evidence of the application of machine learning methods and algorithms to solve revenue management problems in travel-related service industries (McGuire, 2017), the topic is still poorly represented in the scientific literature. Most of the isolated examples found in the literature explore the application of neural networks (Freisleben & Gleichmann, 1993; Huang, Chang, & Ho, 2013; Law, 2000; Padhi & Aggarwal, 2011; L. R. Weatherford, Gentry, & Wilamowski, 2003; Zakhary, Gayar, & Ahmed, 2010). Other examples explore the use of algorithms such as decision trees, support vector machine, logistic regression, and Naïve Bayes (Hueglin & Vannotti, 2001; Lawrence, 2003; Morales & Wang, 2010; Neuling, Riedel, & Kalka, 2004).
In addition to differences in the forecasted/predicted quantities or measures and in the methods employed, forecasts and predictions can be distinguished by level of aggregation (Talluri & Van Ryzin, 2005; L. Weatherford, 2016). Depending on the subject of the forecast and the level of detail offered by the data (the more desegregated the required forecast is, the more detailed the data must be), one of two strategies, either “bottom-up” or “top-down”, is followed (Talluri & Van Ryzin, 2005; Lawrence R Weatherford, Kimes, & Scott, 2001). A “bottom-up” strategy is used when detailed forecasts are required (e.g., occupancy per room type per night). Forecasts can then be combined to obtain global results (e.g., overall occupancy per night). A “top-down”
strategy is used to make global forecasts; the results can then be used to disaggregate the
forecasts (e.g., a global forecast of customers per rate category can be used to forecast the length of stay of the customers).
One other characteristic that distinguishes types of forecasts and prediction problems is the type of target variable used. From a machine learning point of view, supervised forecast and
prediction problems should be categorized as regression problems when the target variable is continuous and as classification problems when the target variable is categorical (Abbott, 2014; Hastie, Tibshirani, & Friedman, 2001).
2.2 Bookings cancellation forecast and prediction
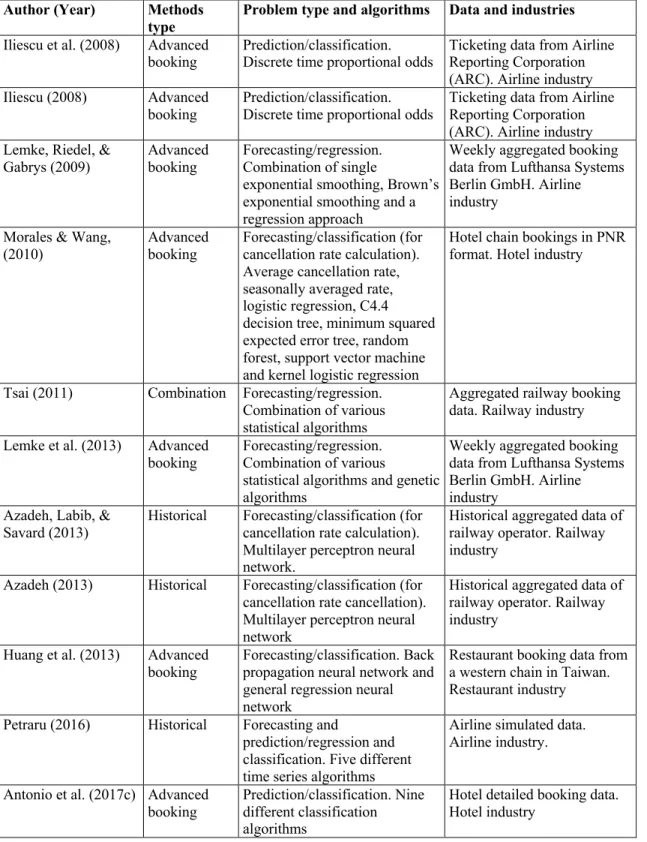
The literature in bookings cancellation forecast/prediction for travel-related service industries is sparse and relatively recent. Table 1 presents a list of studies that appear to address this topic; all of them were published within the last ten years. Of the 16 publications, 5 use airline data, 4 use railway data, 2 use restaurant data, and 5 use hotel data. Nine of the publications employed detailed booking or ticket data (Table 1). The increasing tendency to employ detailed booking data in forecasting models, particularly the increasing tendency to use data that are in the PNR format rather than time series aggregated data, is related to recent advances in technology and in forecasting algorithms (Morales & Wang, 2010; Petraru, 2016). Some of the publications employ data in the Airlines Reporting Corporation (ARC) format instead of the PNR format. The PNR and ARC formats are both standards from the airline industry; PNR is widely used in demand forecasting, perhaps because of its origin. The main difference between the two is that ARC data are based on the tickets issued, while PNR data are based on bookings.
Costs associated with the storage and processing of detailed booking data have been mitigated by the development of technology in recent years (Petraru, 2016; Tsai, 2011). The use of detailed booking data instead of aggregated time series historical data not only has the power to improve the accuracy of the forecasts (Hueglin & Vannotti, 2001; Petraru, 2016) but also permits the development of classification prediction models. Cancellation prediction models are
advantageous because they classify the cancellation outcome of each booking and allow an understanding of how each feature3 influences cancellations, i.e., an understanding of
cancellation drivers (Morales & Wang, 2010; Petraru, 2016). Of the identified publications, 10 employed classification algorithms, but only 8 treated the problem as a classification problem (Antonio et al., 2017a; Antonio, Almeida, & Nunes, 2017b, 2017c; Falk & Vieru, 2018; Huang et al., 2013; Iliescu, 2008; Iliescu et al., 2008; Petraru, 2016). Although Huang et al. (2013) treated the problem as a classification problem, the authors did not pursue the identification of cancellation drivers. The remaining two publications that employed classification algorithms used them to forecast cancellation rates and cancellation deadlines; that is, they treated the problem as a forecasting/regression problem and not as a classification problem (Cirillo, Bastin, & Hetrakul, 2018; Morales & Wang, 2010). The reason for this could lie in the authors’ stated belief that “it is hard to imagine that one can predict whether a booking will be canceled or not with high accuracy simply by looking at PNR information” (Morales & Wang, 2010, p. 556). Nevertheless, the results of Antonio et al. (2017a, 2017b, 2017c), Falk & Vieru (2018), and Huang et al. (2013) contradict this. Huang, Chang, and Ho's (2013) back-propagation neural network model for predicting cancellations in restaurants achieved 0.809 in AUC, 0.751 in
Accuracy and 0.389 in Precision (information on these machine learning metrics can be found in
Precision greater than 0.806, and an AUC greater than 0.935. More recently, Falk & Vieru
(2018) obtained an Accuracy greater than 0.910. In fact, the latter three publications are the only publications that combine the use of detailed booking data with advanced classification
algorithms, a strategy that can be used to implement bottom-up forecasts/predictions. As an example of the booking prediction cancellation problem, one prediction model can generate not only each booking outcome’s prediction but also a set of aggregated predictions. By adding up the outcome of bookings predictions for each distribution channel, segment or other aggregation level, it is possible to make predictions at an intermediary level and at a global level. However, only Antonio et al. (2017a, 2017b, 2017c) addressed the possibility of using separate booking cancellation outcome predictions to calculate net demand at different aggregation levels.
<Insert Table 1 here>
2.3 Factors affecting cancellations
As recognized by Jones & Chen (2011), many studies have addressed how customers select hotels and attempted to identify the factors that affect hotel demand. The factors affecting hotel demand can be divided into four categories: hotel, customer, booking and external (Chan & Wong, 2006; Chiang-Ming Chen, Tsai, & Chiu, 2017). Other hotel-related factors include variety of facilities, quality of service (Chan & Wong, 2006), advertisement/brand recognition (Chan & Wong, 2006; J. N. K. Liu & Zhang, 2014), location (Anderson, 2012), and star
classification (Masiero & Law, 2015). Customer factors include age group, customer type (e.g., group or transient), market segment (Chan & Wong, 2006; Chiang-Ming Chen et al., 2017; McGuire, 2016), distribution channel (J. N. K. Liu & Zhang, 2014; Masiero & Law, 2015), gender (Chiang-Ming Chen et al., 2017; H. Chen, Phelan, & Jai, 2016), and country of origin (Chiang-Ming Chen et al., 2017). Booking factors include price (Anderson, 2012; Chan &
Wong, 2006; Chiang-Ming Chen et al., 2017; J. N. K. Liu & Zhang, 2014; Lockyer, 2005; Masiero & Law, 2015), length of stay (Chiang-Ming Chen et al., 2017; Masiero & Law, 2015), lead time, party size (Masiero & Law, 2015), time of the year, day of the week, events (McGuire, 2016), and cancellation policy (C.-C. Chen et al., 2011; J. N. K. Liu & Zhang, 2014). External factors include recommendation by a third party (e.g., travel agent, company, or family) (Chan & Wong, 2006), social reputation (Anderson, 2012; Chan & Wong, 2006; J. N. K. Liu & Zhang, 2014; McGuire, 2016), competitors’ prices (Enz, Canina, & Lomanno, 2009; McGuire, 2016), special events (McGuire, 2016), weather (C.-M. Chen & Lin, 2014; Day, Chin, Sydnor, & Cherkauer, 2013), and macroeconomic performance (e.g., currency exchange rates) (Ivanov & Zhechev, 2012; Talluri & Van Ryzin, 2005).
Cancellations can occur for reasons that cannot be controlled by the customer, such as changes in plans (e.g., a meeting change), illness, accidents, or weather (C.-C. Chen et al., 2011; Falk & Vieru, 2018). However, cancellations can also occur due to customers’ actions, such as finding a hotel that offers a better price (C.-C. Chen et al., 2011), finding a hotel with a better or more desired location (e.g., where a conference is scheduled to take place), finding a hotel with better service/facilities (e.g., one with a better social reputation), or simply deciding to relocate to join friends or relatives in another hotel. However, although some studies mention factors that influence cancellations, few studies have addressed the roles that different factors play in
booking cancellation probabilities (Antonio et al., 2017c; Falk & Vieru, 2018; Morales & Wang, 2010).
Like hotel demand and hotel selection, cancellations are affected by diverse factors that are inherent to customers or bookings; these include the timing of the booking, the distribution channel, the origin of the customer (region), the season and duration of the stay, the type of
customer, and the hotel’s cancellation policy (C.-C. Chen et al., 2011; P. H. Liu, 2004; McGuire, 2017; Morales & Wang, 2010; Talluri & Van Ryzin, 2005). External factors such as competitors’ prices, social reputation, weather and macroeconomic performance may also impact
cancellations (C.-C. Chen et al., 2011; Ivanov & Zhechev, 2012; McGuire, 2016, 2017; Talluri & Van Ryzin, 2005). Therefore, bookings cancellation forecast/prediction that uses data
representing a large number of these factors is likely to present better performance results. This may help explain the results obtained by Antonio et al. (2017a, 2017b, 2017c), Falk & Vieru, 2018) and Huang et al. (2013) in similar classification problems for different industries. While the latter work employed only 12 features of customer and booking attributes (namely, year, month, day, whether or not the day was a holiday, gender, age, income, educational level, marital status, place of residence, cancellation record, and cumulative number of cancellations) to
predict cancellations for a restaurant chain, Antonio et al. (2017a, 2017b, 2017c), Falk & Vieru (2018), and Morales & Wang (2010) used additional features to characterize both the customer and the booking itself. These included features such as room price, booking date, arrival date, length of stay, distribution channel, room category, market segment, distribution channel, and number of guests. Antonio et al. (2017a, 2017b, 2017c) and Morales & Wang (2010) go even further by including a feature with a known predictive power for cancellations, booking cancellation policy (C.-C. Chen, 2016; C.-C. Chen et al., 2011; Talluri & Van Ryzin, 2005). Antonio et al. (2017a, 2017b, 2017c) added another feature, the customer’s previous cancellation history, which represents another known cancellation factor (C.-C. Chen, 2016; C.-C. Chen et al., 2011; Talluri & Van Ryzin, 2005). Nevertheless, all of these features were obtained from the same source, the PMS. Although the literature recognizes the benefits that can be obtained by
using data from other sources to predict booking cancellations, none of the studies listed in Table 1 employed features from non-PMS sources.
3 Methodology
Data are considered the lifeblood of a forecasting system (Talluri & Van Ryzin, 2005, p. 412). Hence, it is not surprising that the data collection and preparation process (collection, integration, and cleansing) forms the core of the present work. In fact, as in any analytical work, data
preparation represents a substantial part of the methodology (McGuire, 2017).
The well-known cross-industry standard process model for data mining (CRISP-DM) methodology (Chapman et al., 2000) was employed to build the models used in this study. CRISP-DM divides the development of predictive models into six phases: business
understanding, data understanding, data preparation, modeling, evaluation, and deployment. An important point in CRISP-DM is that these phases are not necessarily sequential; the
construction of a model usually requires several cycles. These development cycles are marked throughout this section by the presentation of intermediate results that justify the methodological choices we made to obtain the final round of results. Subsections 3.1 and 3.2 represent the phases of business and data understanding. Subsection 3.3 describes the phase of data preparation. The modeling phase is described in subsection 3.4, while the evaluation phase is presented in subsection 3.5. The deployment phase is not addressed because it is beyond the scope of this study.
All the models created for this work were programmed in R (R Core Team, 2016).
3.1 Bookings data
Uncensored real booking data from eight Portuguese hotels were used. Since these are real bookings and data, the hotels wished to remain anonymous, and no personal information about
the customers or hotels is disclosed. The hotels are identified as R1 to R4 (four resort hotels) and C1 to C4 (four city hotels). The datasets were collected directly from the hotels’ PMS databases using Structured Query Language (SQL) queries. As described in the following subsection, historical data were not available for the majority of the non-PMS data sources, which meant that extractors had to be built to collect daily data from non-PMS data sources. These extractors ran from January 1st, 2016 to November 20th, 2017. As such, PMS booking data were retrieved for the same period. During this period, the cancellation ratios for these hotels varied from 12.2% to 40.0% (Table 2).
<Insert Table 2 here>
PMS databases contain bookings with a known outcome (“canceled” or “not canceled”) and bookings with an “unknown” outcome, i.e., bookings for future dates. The latter were not extracted because, although these bookings had not been canceled at the moment of extraction, they could still be canceled prior to the guest’s expected arrival date. Therefore, the resulting dataset included only canceled bookings for future dates, making it highly imbalanced but reducing the risk of leakage1 and incorrect training2. Additionally, because predictive modeling makes use of historical data to predict future actions, ,the timeline of the historical data must be shifted for these data to be effective. In other words, the values of the input features should be obtained from a period prior to the fixation of the target variable (Abbott, 2014). As an example, it is common for bookings to undergo changes and amendments between the time at which they are entered into the hotel PMS and the time at which the guest checks out or cancels the booking. Some of these changes and amendments involve correction of the information that was entered or changes to the service required; they include changes in the length of stay, the number of guests, the type of meals and the addition of special requests or additional services (e.g., spa
treatments). In fact, it is very common for hotels not to record certain details until check-in, including the guest’s country of origin, his or her birthdate and other personal information. It is also common for guests to change their booking details at check-in (e.g., to add or remove nights or change the number of persons). Understandably, this situation makes the distributions of some features differ with respect to the cancellation outcome. If the objective of the model is to predict bookings cancellation outcomes for features that are set at the cancellation date or at the check-in date, the values of the input features must reflect this. Therefore, instead of extracting PMS data from the bookings table, the data were extracted from the bookings log table, which stores all changes that have been made in the details of bookings over time. This permitted extraction of the data in the state they were in prior to check-in for all bookings that were not canceled and in the state they were in on the cancellation date for canceled bookings.
The features extracted from the hotels’ PMS databases, as well as all other features employed in this work, are described in detail in Appendix A.
3.2 Additional data sources
One of the major difficulties encountered in this study was the selection of other data sources and the choice of methods for incorporating those data. Despite the recognized importance of
external factors in cancellations, to date no bookings cancellation forecast/prediction studies have employed data sources other than PMS data. Due to the importance of external factors in hotel demand, we decided to identify and collect data from other sources to make it possible to assess how features from non-PMS data sources contribute to enhancing the prediction of booking cancellations. However, as recognized by McGuire (2017), the identification of data sources proved to be a difficult task. One of the main reasons for this is the bidimensionality of data for hotel demand forecasting; the data include both the date of creation of the booking and
the date on which the room was occupied or the reservation was canceled (Larry R. Weatherford & Kimes, 2003). This requires that data sources present valid data for both dimensions. For example, despite the importance of weather in explaining hotel demand (McGuire, 2017 and Pan & Yang, 2017a), the incorporation of a weather forecast for far-off future dates is nonviable. However, depending on the selected data point, weather forecasts can be used as a feature in a machine learning model. This data point is the arrival date for bookings that are not canceled or the cancellation date for canceled bookings. In this way, the model can use this feature to determine whether or not the weather forecast is related to the booking cancellation outcome. One other essential requirement was the availability of “quality” data, i.e., the data had to be accurate, reliable, unbiased, valid, appropriate, and timely (McGuire, 2017; Rabianski, 2003). Lastly, we required that our data be public and available for general use to enable replication and, eventually, application by other hotels. This meant that access to external data had to be free and that data extraction could be accomplished using the data providers’ Application
Programming Interfaces (APIs) or, at least, via web scraping.
Based on the requirements for weather data incorporation, we selected the Weather Underground website (Weather Undergound, n.d.). This popular website provides a powerful API that allows the user to obtain current and 10-day forecast weather conditions for almost any location in the world. An automatic application was developed to call this API on a daily basis.
For the collection of information on a country’s national and local holidays, an automated web scraper was developed to extract data. TimeAndDate.com was considered since it is the largest time zone-related website (TimeAndDate.com, n.d.).
For data on special events that were scheduled to occur near the hotel’s location, another automated web scraper was built; on a daily basis, it extracted information from the popular
website Lanyrd.com (Lanyrd.com, n.d.). All of this information was later manually analyzed and used to classify the events into major and minor events. Special events with nationwide
recognition were classified as major events, while more local events or events that only attracted a niche market were considered minor events.
Social reputation data were extracted from online reviews available on two of the most popular websites in the area, Booking.com and Tripadvisor.com (European Commission, 2014). This extraction was again performed daily and automatically via custom-built web scrapers. All the collected data were stored in local databases.
Because of the increasing number of customers searching online for the best deals, sometimes even after having already booked their accommodations for a trip (C.-C. Chen et al., 2011), we decided to collect this type of data from Booking.com and use it to study the possible
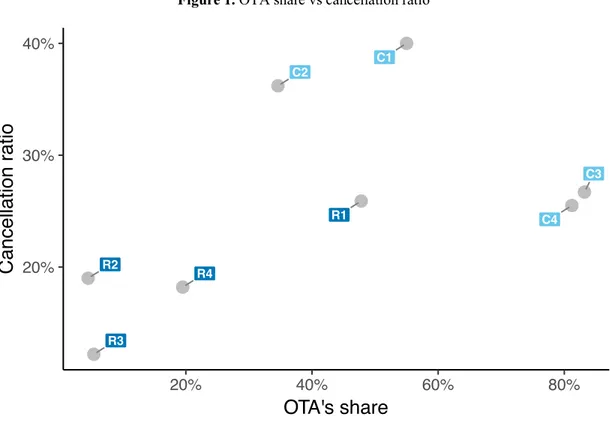
relationship between online prices and cancellations. The rationale for this was to understand whether, during the studied time period, a change in price or availability at a different hotel could lead a customer to cancel a booking. Booking.com was chosen as the source for this type of data; due to its predominance in Europe, it is representative of the influence that online travel agencies (OTA) exert on hotels (HOTREC - Association of Hotels, Restaurants and Cafes and similar establishments of Europe, 2016). In fact, for the studied hotels, OTA’s market share ranged from 4.5% to 83.2% (Table 2 and Figure 1), revealing a moderate correlation (0.5255) between the OTA’s market share and the cancellation ratio.
<Insert Figure 1 here>
An automatic web scraper extracted these data from Booking.com on a daily basis. In addition to price data, data on the inventory on sale were also extracted. Due to the previously mentioned issue of the two-fold dimensionality associated with time of booking, this data extraction also
required collecting data regarding future dates. Therefore, each day the extractor collected the prices and available quantities of all types of accommodation for each of the following 365 days. This process enabled the creation of features that could be used to study the impact of both online prices and available inventory on booking cancellation outcomes. As in the case of social reputation, data about the hotels’ competitors was also extracted. For each studied hotel, this competitive set consisted of five other hotels that were identified by the studied hotel’s manager. The data extractors for most of the additional data sources collected data from January 1st, 2016 to November 20th, 2017. Data regarding online prices and inventory on sale were collected from August 1st, 2016 to November 20th, 2017. Overall, more than 1 terabyte of data was collected for this period. As shown in Table 3, the number of observations collected from some sources, such as online prices and inventory, were very high, exceeding 80 million observations. The collected data (raw data) were then prepared and aggregated according to the features developed to
represent each source (prepared data). This highly computing-intensive task reduced the number of observations and permitted merging of the resulting features with features obtained from the PMS data.
<Insert Table 3 here>
3.3 Data preparation
Data analysis and summary statistics showed that despite the presence of some abnormalities, overall the data from all sources were of good quality. Except for the weather forecast dataset, none of the datasets presented missing values; the observations represented all bookings and dates, the categorical features were not of high multiplicity for the same meaning, and the data were properly formatted. For numeric/integer features, the abnormalities were essentially outliers that could be explained by the way hotels operate.
Feature selection, particularly feature engineering, can contribute positively to the accuracy of prediction models due to the information gain obtained from the association of multiple input variables (Abbott, 2014; Kuhn & Johnson, 2013). Indeed, authors such as Domingos (2012) consider feature engineering the key factor in the success of machine learning projects. In feature engineering, creativity, intuition, and domain knowledge are as important as technical
knowledge.
Based on features that could represent hotel demand/selection and on the features already employed in previous booking cancellation forecast/prediction research, our starting point was the inclusion of the PMS-based features Adults, Babies, Children (Antonio et al., 2017b; Falk & Vieru, 2018), Agent, Company, CustomerType, DepositType, MarketSegment (Antonio et al., 2017b; Morales & Wang, 2010), DistributionChannel, LeadTime (Antonio et al., 2017b; Falk & Vieru, 2018; Morales & Wang, 2010), IsRepeatedGuest, PreviousCancellationRatio (Antonio et al., 2017b; Huang et al., 2013), BookingChanges, DaysInWaitingList, Meal,
StaysInWeekendNights, StaysInWeekNights, ThirdQuartileDeviationADR, and
TotalOfSpecialRequests (Antonio et al., 2017b). Considering that we improved the method used
to extract data from the hotels’ PMS by extracting the values of the input variables at a time prior to check-in/cancellation, we were able to include additional important PMS-based features to represent the origin of the customer, the season, and the room type (Antonio et al., 2017c; Falk & Vieru, 2018; Morales & Wang, 2010); these features were Country, DayOfYear, and
ReservedRoomType. Furthermore, for models optimized for two of the hotels, we even included
additional PMS-based features that represented special requests made by customers
(SRDoubleBed, SRHighFloor, SRQuietRoom, SRTogether, and SRTwinBed) and features that represented services these two hotels offered that other hotels did not (AssociatedToEvent and
BookedSPA). The extraction and engineering of other PMS-based features, including features
employed in previous research (e.g., gender, rate code), was also tested (Morales & Wang, 2010), but the results did not show any improvement. None of the features proved to have predictive value. One example of these additional features was a feature that was designed to capture the time at which a booking was canceled prior to the guest’s expected arrival. The feature was calculated based on the time during which the booking was “alive”, that is, the number of days that elapsed between booking and check-in or cancellation, according to the outcome of the booking. One other feature tested with the same purpose was calculated by determining the number of days between the arrival date and the date of the booking outcome (check-in or cancellation). A description of these and all other features employed in the development of the models can be found in Appendix A; it can be observed that, of the 37 features employed, only 12 were created directly from the input variables. The remaining 25 features were engineered from multiple input variables (e.g., DepositType) or multiple
observations of the same input variables (e.g., PreviousCancellationRatio) or were at least based on some type of computational result (e.g., StaysInWeekendNights).
The outcome variable IsCanceled was directly extracted from the hotels’ PMS databases. This categorical variable is assigned a value of 0 for not canceled bookings and a value of 1 for canceled bookings. For the purpose of this research, although no-shows differ from
cancellations, no-shows were treated as cancellations because customers do not inform hotels of their check-in failure.
For the features that were added based on other data sources, the selection criterion was the possible impact the feature might have on booking cancellations. These features were the culmination of hundreds of iterations and experiments that were conducted with the purpose of
understanding which features were likely to contribute to improving the models. For example, it is known that precipitation should be considered over temperature when pondering the impact of weather (Day et al., 2013). Therefore, we constructed the feature
AvgQuantityOfPrecipitationInMM, which was based on the average forecasted quantity of
precipitation during each booking’s period of stay at the outcome date (StatusDate - the cancellation date for canceled bookings) or the arrival date for not canceled bookings.
CompSetSocialReputationDifference, which was crafted to include the impact of hotels’ social
reputations, was designed to reflect the fact that a customer might cancel a booking in one hotel in favor of a similar hotel with a better reputation. Since Booking.com and Tripadvisor.com use different rating scales, we employed one of the most commonly used normalization formulas (Abbott, 2014), the min-max formula, to normalize the ratings. The hotel daily ratings for each of the sources were normalized over the range 1-100 using 𝑥" = (%&'() (%))
(',-(%)&'() (%)× 100. We also
took into account that Booking.com ratings actually range from 2.5 to 10 and not from 1 to 10 (Mellinas, María-Dolores, & García, 2016). The normalized ratings of the two sources were then averaged to obtain one overall daily rating for the hotel in question. Next, the number of hotels from the competitive set with better average ratings in relation to the hotel’s booking was added to obtain the final feature value. The rating employed was the rating at the time of each
booking’s outcome date.
We created two features to reflect the possibility that a customer might cancel a booking in favor of a similar hotel with a better price: RatioADRbyCompsetMedianDifference and
HotelsWithRoomsAvailable. While the first feature attempts to depict the relationship of each
booking price to the hotel’s competitive set’s median average price, the second is designed to reflect demand by revealing how many hotels in the competitive set still have rooms available.
After retrieving the booking StatusDate, we fetched the cheapest price offered by each competitor for each night of the booking’s stay for a similar accommodation (i.e.,
accommodating the same number of people and providing the same type of meal package). These prices were used to calculate the median price of the competitive set per day. The median was chosen over the mean because it is less sensitive to outliers. Next, the average price for each booking’s period of stay was calculated using the daily calculated median price. Finally, the ratio between each booking’s average daily rate (ADR) and the average median price for the
competitive set was calculated. The rationale was to understand at what point competitor’s prices could influence a customer’s decision to cancel a booking.
The feature HotelsWithRoomsAvailable was calculated by counting the number of hotels in the competitive set that had accommodations available during the entire booking’s stay.
To reflect the number of holidays that a booking coincided with, we created the feature
nHolidays. The rationale behind this feature was that a customer who planned to travel or be on
vacation during a holiday would probably be less likely to cancel than someone who was not traveling on a holiday. Initially, the plan was to count these holidays according to the country of origin of the customer. However, due to the previously identified problem with the country variable, we opted to count the number of holidays at the hotel’s location, considering that most customers come from Portugal or nearby countries and thus share many public holidays. To reflect the possibility that special events such as conferences, sports events and concerts might generate more demand and therefore influence customers not to cancel, we created two other features: RatioMajorEventsNights and RatioMinorEventsNights. These features were obtained by dividing the total number of days of each booking’s stay by the number of days on
which major or minor events, respectively, were scheduled during that period. The
characteristics and engineering details of all of these features are described in Appendix A. After merging the data from the different sources into a unique dataset, we processed all features for missing values and cardinality. For the former, we employed the R package “MissForest” (Stekhoven, 2013), in which a random forest machine learning algorithm is used to train a model on observed values to predict the missing values. To process cardinality in categorical features, we employed the R package “vtreat” (Mount & Zumel, 2017). In fact, features with a high degree of cardinality can make model training slow and overfit the data (Abbott, 2014). Models that overfit do not generalize well (Hastie et al., 2001). To avoid this, we encoded all levels of categorical features with a minimum frequency of 0.02 into an indicator column (one-hot
encoding4). However, so as not to lose information about the less frequent levels, a new numeric feature was built for each categorical feature. This feature’s value represents the Bayesian change in the logit-odds from the mean distribution conditioned on the observed value of the original feature. Vtreat adds a suffix to the feature name according to the type of feature: “_clean” for numeric features, “_catB” for features that represent a Bayesian change of
categorical features, and “_lev_x.<level name>” for indicator features for categorical levels with a frequency greater than 0.02.
3.4 Model development
Most high-performance machine learning techniques are fundamentally black boxes that
generate highly complex predictive equations (Kuhn & Johnson, 2013). Nonetheless, the outputs of some techniques, such as those that are based on decision trees, are easier for humans to understand (Abbott, 2014; Hastie et al., 2001; Kuhn & Johnson, 2013). Decision tree-based
techniques also have the advantage of automatically incorporating the treatment of outliers, handle missing data well, are not affected by feature skewness, inherently detect feature interactions, are nonparametric (making no distribution assumptions about features and the outcome variable) and have a built-in feature selection mechanism (Abbott, 2014; Kuhn & Johnson, 2013). However, decision tree techniques also have weaknesses, including non-adaptability to slight changes in the data and failure to generalize well. To overcome these weaknesses, some approaches employ ensemble methods, which, by combining multiple trees into one model, tend to have better performance (Hastie et al., 2001; Kuhn & Johnson, 2013). We decided to employ the award-winning ensemble tree-based machine learning algorithm XGBoost (T. Chen & Guestrin, 2016), which is a gradient boosting-based algorithm. Gradient boosting algorithms are usually faster than other methods in training models and allow the user to understand the importance of each feature and its contribution to the prediction of the outcome (Hastie et al., 2001). XGBoost, one of the fastest and best machine learning algorithms available today (T. Chen & Guestrin, 2014/2018), is capable of addressing both regression and
classification problems and was designed to facilitate the understanding of the predictive power of the features employed in the models built with it. Therefore, XGBoost is the ideal algorithm for building “bottom-up” cancellation prediction models – models that can be used to make predictions at the booking level but whose results can also be used to make aggregated
predictions. Because data for the same period were not available from all data sources, we made the decision to build different models using datasets that differed in terms of features and
numbers of observations. The first model, Model 1, which used exclusively PMS features, encompassed arrivals from January 1st, 2016 to November 20th, 2017. A second model, Model 2, which also used PMS features, used arrivals from August 1st, 2016 to November 20th, 2017. The
objective was to understand whether reduction in the number of observations had a severe impact on the model’s performance. The third model, Model 3, included features from all sources (PMS, weather, social reputation, holidays, special events, and online prices/available inventory) and used observations from the same period as in the second model so that we could determine whether the inclusion of features from additional sources improved the results. Lastly, we
decided to build an optimized model (Model 4) for hotels R1 and C1 because these hotels shared characteristics that permitted the creation of some additional features; the observations for Model 4 were from the same time window as those for Models 2 and 3. The intention was to understand whether models that included features specifically tailored to each hotel’s characteristics and operations would provide better results than models built with “generic” features.
Comparing to previously published research, XGBoost use per se was not the major innovation introduced in the modeling. The novelty was the combination of XGBoost with the way in which data were extracted from the PMS and other sources and how datasets were split for training with XGBoost. Because we had a data-rich situation, we employed the approach recommended by Hastie et al. (2001) of splitting the datasets into three parts: a training set for fitting the model, a validation set for assessing the prediction error, and a test set (hold-out) for assessing the
generalization error. There is no specific rule for defining the quantity of observations or for determining which observations are included in each set; this depends on the characteristics of the data, such as size and structure (Hastie et al., 2001; Kuhn & Johnson, 2013). Furthermore, time is not irrelevant. For example, the more cancellations a customer has made in the past, the higher is the customer’s likelihood of canceling. This can be considered a temporal data
problem; thus, data for the test set should be chosen from a period that is not “known” by the training and validation sets (Abbott, 2014; Hastie et al., 2001). The StatusDate was selected as
the date to use for splitting in the creation of the test set. Thus, all bookings that were canceled or checked in after August 31st, 2017 formed the test set. Since hotel operations are not static, new travel operators emerge while others disappear, patterns in prices and booking antecedence change, customers’ preferences change over time, and the distribution of input features changes in relation to the outcome label; these changes contribute to what is known as “concept drift” (Gama, Medas, Castillo, & Rodrigues, 2004; Webb, Hyde, Cao, Nguyen, & Petitjean, 2016). To capture changes in behavioral data over time, we followed Antonio et al. (2017b) by dividing the remaining data into training and validation sets using the “convenience splitting” approach (Reitermanová, 2010). The remaining observations were ordered by arrival date and subdivided into month/year blocks. To preserve the features distribution of the outcome, we performed stratified splitting of each of these blocks, placing 75% in the training set and the remaining 25% in the validation set.
3.5 Evaluation
In this section, we present and discuss our results using the common machine learning metrics
Accuracy, Precision, and Area Under the Curve (AUC). Accuracy is a description of systematic
error. In this context, it is calculated by dividing the number of bookings whose outcomes were correctly predicted by the total number of bookings. Precision is considered a description of random error; it is calculated by dividing the number of bookings that were predicted as “likely to cancel” and were actually canceled by the total number of bookings that were predicted as “likely to cancel”. AUC can be described as a measure of how well a model distinguishes between classes; in this case, the classes are “canceled” and “not canceled”. These and other associated metrics are described in more detail in Appendix B.
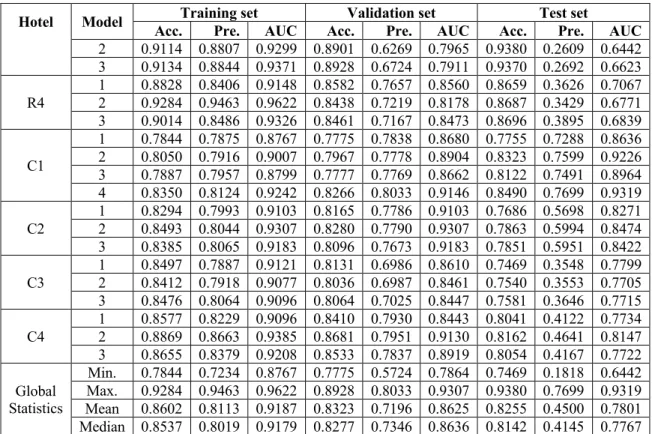
One of the first observations about the modeling results (Table 4) is that they differed not only for different models but also within hotels when the same type of model was employed.
<Insert Table 4 here>
Models 1 and 2 used only PMS data, but Model 2 was fed with data from a shorter period. However, in general, Model 2 showed better results than Model 1. The latter was better in only three cases, namely, for hotels R1, R4, and C3. In the validation set for R1, the Accuracy of Model 2 was 0.8232, whereas that of Model 1 was 0.8431. For Precision, we obtained 0.6934 for Model 2 and 0.7542 for Model 1. The AUC results were 0.8892 for Model 2 and 0.9051 for Model 1. The test set results for R1 were similar. In terms of Accuracy, the value was 0.8381 for Model 2 and 0.8409 for Model 1. The Precision of Model 2 was 0.4568 and that of Model 1 was 0.4607. The AUC for Model 2 was 0.8180, whereas that for Model 1 was 0.8293. The results were similar for R4 and C3. However, for these two hotels, the results diverged in some sets. For example, in R4 the Accuracy on the test set in Model 2 (0.8687) was slightly superior to that in Model 1 (0.8659), but the inverse was true for the validation set. There, Accuracy in Model 1 was 0.8582, while in Model 2 it was 0.8438. For the remaining hotels, most metrics presented better results both for the validation and test sets when Model 2 was used. These differences show that the use of more data does not always produce better predictive models (Abbott, 2014). Furthermore, as recognized by McGuire (2016), the use of more data from the same source might not result in better-performing models. This is particularly true if the data do not have a significant causal relationship with the outcome, if the data lack quality, or if the data do not change significantly over time.
Similarly, the results obtained using Model 3 show that the introduction of additional features from other data sources did not produce better results for any of the hotels. For hotels C1, C2,
and C4, Model 3 was beaten in every metric for both the validation and the test sets. However, almost all metrics for the Model 3 test set showed improved results over those of Model 2 for hotels R1, R2, R3, R4, and C3. Nevertheless, this was not matched in the validation set, where the improvement did not occur homogeneously for all the metrics.
On the other hand, the results obtained with Model 4 clearly show that inclusion of features specific to each hotel’s characteristics and operations imparts substantial performance
improvement. Compared with the Model 3 test set results for R1, Accuracy increased by more than 3 percentage points, Precision increased by more than 10 percentage points, and AUC increased by more than 3 percentage points. For C1, both Accuracy and AUC increased by more than 3 percentage points, while Precision increased by more than 2 percentage points.
From a general point of view, the overall statistics (Table 4) show some of the global results that were obtained. All metrics presented good results in terms of prediction performance using the validation set. Accuracy ranged from 0.7775 to 0.8928, Precision ranged from 0.5724 to 0.8033, and AUC ranged from 0.7864 (a value that is usually considered to indicate a fair-to-good model result) to 0.9307 (a value that indicates an excellent model result). In terms of the generalization performance, i.e., the models’ predictive capability using independent test sets (Hastie et al., 2001), the mean and median results show that the results for most hotels were good.
Nevertheless, this was not the case for hotels R2, R3, and R4, particularly with respect to
Precision and AUC. These three hotels also presented the lowest cancellation ratios. This might
indicate that, for hotels with low cancellation ratios, additional data or different features should be added to improve the capture of cancellation patterns; alternatively, it might simply be very difficult to predict cancellations for such hotels, perhaps because cancellations have no patterns other than the consumers’ own limitations.
Another important consideration arising from the results is the Pearson correlation values
between Accuracy and the hotels’ OTA share and between Accuracy and the hotels’ cancellation ratios for the Model 3 test set. The correlation between Model 3’s Accuracy and the OTA share in hotels can be considered moderate to strong (-0.5894). The correlation between Model 3’s
Accuracy and the hotels’ cancellation ratio can also be considered strong (-0.6282); the results
suggest the existence of a negative association between Accuracy and both the hotels’ OTA share and the hotels’ cancellation ratio. When the OTA share and the cancellation ratio decreased,
Accuracy increased, and vice versa. Since there was also a moderate positive correlation between
OTA share and cancellation ratio, it is suggested that the higher the hotel’s OTA market share is, the higher the cancellation ratio will be and the more difficult it will be to accurately predict cancellations.
One of the powerful characteristics of XGBoost is its ability to generate measures of each feature’s contribution to the whole model; these measures include Gain, Cover and Frequency.
Gain measures the improvement in accuracy contributed by a feature to the tree branches on its
own. Cover measures the relative number of observations for the feature. Frequency (also known as Importance) is a simpler measure that is calculated by counting the number of times a feature is used in all generated trees. A feature with Frequency 0 (zero) was not used in the model. The
Frequency in Model 3 shows which features were used in each hotel’s model version (Table 5).
As is common in predictive modeling, not all features had substantial influence on the prediction of the outcome (Hastie et al., 2001). Of the 29 features, only 13 to 15 were used, depending on the hotel. Also interesting is the fact that all the features used originated from the PMS. Features from the other data sources were not used. As previously mentioned, for some hotels the
were not due to the information gain brought to the models by the features but were instead due to the way in which the XGBoost algorithm works. As with other ensemble decision tree-based algorithms, XGBoost controls overfitting to the training data so that it can generalize better with unseen data. This control is achieved by using parameters that allow tuning of the model’s complexity (the simpler the model, the less likely it will be to overfit) and parameters that add randomness to make the training more robust to noise. These parameters include definition of the subsample of observations to be used in each tree and definition of the subsample of features to use in each tree and at each tree level. Thus, although introducing features from other data sources may not have added information, it made some of the models more robust to noise.
<Insert Table 5 here>
The analysis of the top 15 most important features per hotel, based on the Frequency/Importance measure calculated by XGBoost, is depicted in Figure 2. It is possible to verify that there are differences between the hotels in terms of the number of clusters and in the number of features in each of these clusters as well as in the degree of importance of the features by cluster and by hotel; this is because XGBoost uses one-dimensional clustering to determine the grouping of features in terms of importance. However, some of the features had similar importance for all hotels. Leadtime was the most important feature for six of the hotels and the second most
important feature for the remaining two hotels (R1 and C1). In hotel R1, a feature that represents bookings from a specific level (240) of the Agent categorical feature had the highest importance. In C1, the most important feature was the level “No deposit” jointly with the level
“Nonrefundable” of the categorical feature DepositType. Country was also one of the most important features for all hotels except R3, for which it ranked fourth. For the other hotels,
was BookingChanges. One other interesting point that Figure 2 highlights is that the feature
StaysInWeekNights was more important for cancellation prediction than the feature StaysInWeekendNights except in the case of hotel C4, for which the results were not
distinguishable.
<Insert Figure 2 here>
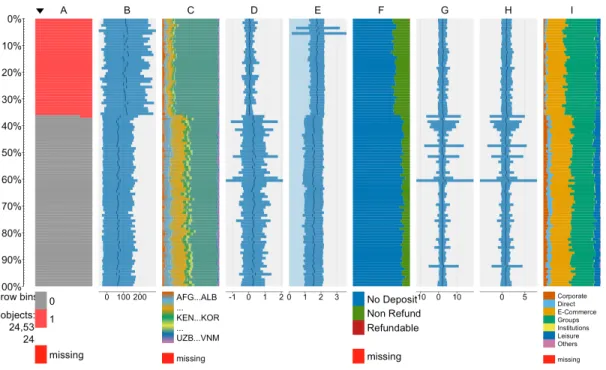
By identifying the features that are most important in predicting the outcome of a booking, we can narrow down the cancellation drivers. A smaller number of dimensions can make it easier to study the data and uncover hidden patterns. For example, Figure 3 presents a “tableplot”, a powerful technique for the visualization of big data that permits exploration and analysis of large multivariate datasets (Tennekes & de Jonge, 2017). The most important predictive features for hotel C2 using Model 3’s dataset are represented. The plot is composed of 100 bins (lines), and each line is composed of 245 observations. For categorical features, individual colors represent the distribution of a category level in each bin of observations. For numeric features, the bars show the range between the mean value plus the standard deviation and the mean value minus the standard deviation. The plot also includes a line that indicates the mean of each line’s observations. Using such a plot, it is possible to verify at a glance patterns in the distribution of the different features in relation to the outcome label, which is shown in column A. The
IsCanceled feature shows that cancellations for hotel C2 reach a value of approximately 36% of
all bookings, and this is corroborated by the data in Table 2. The first noticeable pattern is that average LeadTime tends to be higher in canceled bookings. However, other patterns are also apparent; Portugal presented the following: (1) a higher number of bookings (Country feature); (2) the lowest average number of amendments to bookings (BookingChanges); (3) a higher average number of adults per booking; (4) a higher percentage of “Nonrefundable” bookings
(DepositType); (5) a higher number of stays over weekends (StaysAtWeekendNights); (6) a higher number of “Groups” and lowest number of “Leisure” customers (MarketSegment); and (7) more canceled bookings for room type “A” than for other room types (ReservedRoomType). These patterns, which were identified using a visualization tool, require more in-depth analysis. However, the analysis presented here provides a starting point for understanding the reasons behind cancellations and developing measures to prevent them or at least to better estimate them. As an example, through analysis of the “Nonrefundable” (DepositType) canceled bookings in some Asiatic countries (Country) and from certain distribution channels (DistributionChannel and Agent), it is possible to understand why so many “Nonrefundable” bookings are canceled. These bookings are usually made through OTA using false or invalid credit card details. These bookings are issued as support for requests for visas to enter the country (a hotel booking is mandatory for applying for a Portuguese entry visa). After failing to charge the customer’s credit card, the hotel identifies these bookings as “fake” and contacts the customer; however, during the time required to verify these bookings, they contribute negatively to demand forecast and
demand management decisions.
<Insert Figure 3 here>
4 Discussion
4.1 Theoretical implications
The results of this study have several important implications for research on booking
cancellation prediction. First, as some forecast/prediction studies have recently shown (Antonio et al., 2017b, 2017a, 2017c; Falk & Vieru, 2018; Huang et al., 2013) and contrary to the position previously advocated by Morales & Wang (2010), it has now been confirmed that using
cancellation. This also confirms that classification prediction models that use detailed booking data, in comparison to regression models and models that use historical data, are much more effective in the development of comprehensive models. Classification prediction models can be used to create “bottom-up” forecasts (Talluri & Van Ryzin, 2005) that can be used to make predictions at a very detailed level (per booking) as well as to predict net demand at global or aggregated levels such as market segment, distribution channel, and travel agency, among others. Second, previous studies that employed machine learning algorithms draw conclusions from prediction error results obtained from validation sets built with data from the same period of the training data (Antonio et al., 2017a, 2017c, 2017c; Huang et al., 2013). By creating a test set consisting of bookings from a period that was not included in the training and validation sets, we demonstrated that models that produce good results with known data do not always generalize well. Therefore, future research should assess results based on data obtained from a period following the period from which the data used in the training and validation sets were obtained. Third, we showed that for booking cancellation prediction problems, booking data should include booking details prior to the cancellation outcome (arrival or cancellation date). In
particular, the details of noncancelled bookings should be those obtained by the hotel prior to the arrival date, not those updated at check-in or during the guest’s stay. As such, data should be extracted from PMS database log tables and not directly from PMS database bookings tables. If this is not done, the input features may not reflect the proper distribution in relation to the target variable (IsCanceled), thereby leaking the cancellation outcome of the bookings and resulting in weaker prediction models. The importance of extracting data prior to the outcome date is
emphasized by the predictive power of the feature BookingChanges. The results clearly show that the number of changes/amendments associated with a booking is an important cancellation
indicator. Fourth, demand and cancellations can differ by hotel, customer, or booking or due to external factors. Instead of building models that are generally applicable to the hotels under study, as was done in earlier studies (Falk & Vieru, 2018; Huang et al., 2013; Morales & Wang, 2010), we followed the approach proposed by Antonio et al. (2017a, 2017c, 2017c) and built a specific model for each hotel. This allowed us to confirm previous studies’ findings, namely, that factors such as lead time, country, length of stay, market segment and distribution channel are of high importance in predicting cancellations for any hotel (Falk & Vieru, 2018; Morales & Wang, 2010) but that this importance can vary for different hotels. Since we employed data from two different types of hotels with different characteristics, different types of customers and different distribution strategies, it is expected that the cancellation patterns would differ for different hotels. This contributes to the existence of differences among the features’ importance rankings at different hotels. Fifth, despite the suggested potential benefits of big data application in hotel revenue management forecasting (McGuire, 2017; Pan & Yang, 2017b; Talluri & Van Ryzin, 2005; Wang et al., 2015; Zhang et al., 2015), no evidence of such benefits was found for booking cancellation prediction. The models’ performance did not improve substantially with the
inclusion of features from other sources, and none of the features from non-PMS data sources showed predictive importance. These findings are consistent with the findings of Falk & Vieru (2018), which indicated that special events and customer confidence indicators do not explain cancellation patterns. Nonetheless, this study revealed which non-PMS data sources can be used in hotel revenue management forecasting problems and how data can be collected from non-PMS data sources. Lastly, although classical statistical methods are effective in demonstrating the explanatory power of features, explanatory power does not always imply predictive power (Domingos, 2012; Shmueli & Koppius, 2011). As shown, prediction models such as XGBoost
that make use of big data and advanced machine learning algorithms that allow a certain level of interpretability are relevant to understanding features’ true predictive power. This highlights how big data and machine learning-based models could be employed to understand and explain a variety of business prediction problems as well as to create more accurate forecasting models.
4.2 Managerial implications
This study has important managerial implications. Equipped with cancellation prediction models that can be used to estimate booking cancellation outcomes with high accuracy, hotels, prior to the expected arrival date, can contact customers who have been identified as having a high likelihood of canceling and take action to try to prevent these customers from canceling their bookings. Cancellation predictions could be used as inputs in revenue management systems to improve the systems’ accuracy and thereby enhance inventory allocation and pricing
recommendations. As a complement to RMS’s recommendations or even in the absence of an RMS, revenue managers can use the models’ global or aggregated net demand forecasts to make better informed demand-management decisions (e.g., how many rooms to oversell for specific dates or even whether to accept a late walk-in because the system predicts that some of the bookings that are due to arrive will cancel or not show on that day).
Comprehending which features are the best descriptors for cancellation allows hoteliers to rethink their cancellation policies in different ways. Since a large fraction of hotel distribution is now made online, it seems reasonable to take advantage of and encourage the application of dynamic cancellation policies (at least in online channels directly controlled by the hotel/chain). Instead of favoring the application of restrictive cancellation policies, why not foster the
application of cancellation policies that vary according to the lead time, country of origin, or other factors with predictive importance? Cancellation penalties could be dynamically calculated