sob uma Licença Creative Commons.
All the contents of this journal, except where otherwise noted, is licensed under a Creative Commons Attribution License.
Securities-Based Earnings Management in Banks: Validation of a
Two-Stage Model
José Alves Dantas
Ph.D., Department of Accounting Sciences, University Center of Brasilia E-mail: [email protected]
Otávio Ribeiro de Medeiros
Full Professor, Department of Accounting and Actuarial Sciences, University of Brasília E-mail: [email protected]
Fernando Caio Galdi
Associate Professor, Department of Accounting and Finance, FUCAPE Business School E-mail: [email protected]
Fábio Moraes da Costa
Associate Professor, Department of Accounting and Finance, FUCAPE Business School E-mail: [email protected]
Received on 11.2.2011 - Accepted on 11.3.2011 - 3rd. version accepted on 6.21.2012
ABSTRACT
Studies investigating earnings management in banks have been particularly concerned with the use of Loan Loss Provisions (LLP) and mainly use two-stage models to identify discretionary management actions. Another type of record that has received attention from researchers in identifying discretionary management actions is the classification and measurement of the fair value of securities. In this case, however, one-stage models have prevailed. The present study aims to develop and validate a two-stage model for the identification of discretionary management actions using gains obtained from securities. Our model incorporates macroeconomic indicators and spe-cific attributes of the securities portfolios to the traditional parameters used in models previously utilized in the literature. To validate the proposed model, the results are compared with the results from the estimation of a one-stage model - a methodology widely used in the literature. Tests conducted with the two models reveal evidence of income smoothing using securities and the classification of available-for-sale securities among the actions taken by management. The consistency of the results across the two models validates the proposed model, thereby contributing to the development of research on the topic that is not only concerned with determining whether earnings management is practiced but also whether it can be associated with other variables. We also find that securities-based earnings manage-ment is more significant in smaller-sized banks and in banks controlled by private capital.
1 INTRODUCTION
Empirical research on accounting choices, manipu-lation of accounting information, and earnings manage-ment is an area that has received a lot of attention from researchers evaluating the use of financial information in the capital markets (Kothari, 2001; Fields, Lys, & Vin-cent, 2001).
Different methodological procedures have been used to identify methods of earnings management. Although some studies have used frequency distributions (histo-grams), the empirical literature on the subject has been dominated by the analysis of the behavior of accruals, particularly those related to discretionary management actions (Healy & Wahlen, 1999). Several econometric models have been developed to measure discretion. Ac-cording to Paulo (2007), the most prominent models were developed by Healy (1985), DeAngelo (1986), and Jones (1991). In addition, Dechow, Sloan, and Sweeney (1995) developed the Modified Jones, and Kang and Si-varamakrishnan (1995) developed a model known as the KS. In general, these models attempt to segregate total accruals that are determined by discretionary manage-ment in response to incentives and that are applied to various economic segments.
Despite the numerous studies on the subject that use these models, several methodological limitations have been highlighted in the literature, including the diffi-culty of detecting and measuring earnings management practices (Dechow, Sloan, & Sweeney, 1995), the limi-tations of econometric models in capturing the recog-nition of accruals by discretionary management (Paulo, 2007; Jones, Krishnan, & Melendrez, 2008), and the fact that abnormal accruals, used as a parameter of discretion and as a proxy for earnings management, are influenced by unusual non-discretionary factors (Healy, 1996; Ber-nard & Skinner, 1996).
As a means of dealing with the limitations of econo-metric models, another branch of earnings management research has focused on the analysis of specific accruals. According to Martinez (2001) and Cheng, Warfield, and Ye (2011), focusing on the analysis of specific accounts (or of an industry) creates an opportunity for a more con-sistent and proper model for the problem in question. According to Healy and Wahlen (1999) and McNichols (2000), the use of this method, which produces empirical evidence regarding accounts used for earnings manage-ment, has the best potential in terms of advancing the li-terature on the subject.
Because of its particular characteristics, the banking industry is a favorable environment for the develop-ment of studies based on specific accruals. For Kanaga-retnam, Krishnan, and Lobo (2010), the use of specific accruals in an industry such as banking enables a more appropriate segregation of discretionary and non-dis-cretionary components and allows to control for other determinants of cross-sectional differences in accruals, increasing the reliability of inferences from empirical
analyses. These studies are particularly focused on the analysis of the process of determining Loan Loss Provi-sions (LLP), which Kanagaretnam, Lobo, and Mathieu (2003) justify by arguing that these allowances generally represent banks' largest accruals and thus play a key role in managers’ decisions about possible accounting mani-pulations. According to Alali and Jaggi (2010), there is a widespread belief in the market that bank managers use LLP extensively to manipulate published earnings and that LLP has been a focus of concern for regulators.
In addition to LLP, another type of record often studied to identify earnings management practices in financial institutions is the classification and measure-ment of the fair value of securities and the selection of the timing of their sale, which affects the profits and los-ses associated with these assets. According to Beatty, Ke, and Petroni (2002), research has shown that these are the two bank earnings components that are most subject to manipulation.
Among the studies conducted on the banking in-dustry focusing on the analysis of LLP and securities portfolios, one difference stands out. When the focus is on LLP, most studies use two-stage models - the first stage identifies the discretionary portion, as represen-ted by the error term of the non-discretionary por-tion of the specificapor-tion model, and the second stage evaluates the association between this discretion and the variables of interest for management. In the case of studies on securities, however, one-stage models are commonly used. This approach means that the portion resulting from managerial discretion is not identified; the association between the total accruals from securi-ties and the income variables that eliminate those ac-cruals is evaluated to ascertain whether the financial institution uses accruals with securities to achieve the goals of the managers. The use of one-stage models may hinder the development of studies where infor-mation concerning the extent of discretion practiced by the institutions at any particular time is required. Additionally, it is important to consider that there are two parts to the process of measuring financial instru-ments. The first relates to the recognition of interest for the period (where necessary) with little opportunity for a manager to exercise discretion in earnings mani-pulation. The second part concerns the updating of an instrument's fair value, which provides a manager the opportunity to exercise more discretion to manipulate an institution's earnings. Thus, it is recommended that discretionary and non-discretionary portions be sepa-rated in the empirical evaluation of securities-based earnings management.
used in previous research?
In order to address this problem, the present study aims at validating a two-stage model for the identifica-tion of discreidentifica-tionary activity by financial instituidentifica-tions using securities accruals while attempting to improve on the few models with these characteristics identified in the literature. To that end, the few contributions from studies on the subject in the banking field are considered, and the precepts are adopted for the deve-lopment of two-stage models for LLP; also, the charac-teristics of securities portfolios are taken into account. The validation of the proposed model is performed by comparing calculated results with the results found using a one-stage model, given the establishment in the literature of this type of model for securities-based ear-nings management in banks. This validation procedu-re seeks to avoid the problem highlighted by Lobo and Yang (2001), who attribute the existence of conflicting empirical results in studies on earnings management to the use of different models and the lack of methodolo-gical consensus among researchers.
Empirical tests were conducted using data from the Quarterly Financial Statements (QFS) of commercial banks, multiple-purpose banks, and savings banks ope-rating in Brazil from the third quarter of 2002 to the fourth quarter of 2010. These data are available on the website of the Central Bank of Brazil (Banco Central do Brasil - BCB).
Despite the concern expressed by Goldberger (1961) regarding underestimation of the absolute value of the regression coefficients in the second stage, the valida-tion of a two-stage model to identify discrevalida-tionary ac-tivity in the assessment and classification of a securities portfolio contributes to the development of research on the topic by not only aiming to ascertain whether ear-nings management is practiced but also by identifying the level of discretion that is applied. Moreover, this re-search can contribute to the development of studies in which banks’ discretionary management activity regar-ding their securities portfolios is one of the elements that is considered.
2 THEORETICAL FRAMEWORK
As a theoretical basis for the development of the model, the following topics are discussed: earnings ma-nagement practices in financial institutions; the use of the securities portfolio for this practice; a review of the studies on the use of securities by banks in earnings management practice; and the use of two-stage models to identify the discretionary management activities of banking institutions.
2.1 Earnings-Management Practices in
Financial Institutions.
According to Cornett, McNutt, and Tehranian (2006), the study of earnings management in the fi-nancial system is particularly important because of the impact that problems in banking institutions may have on the economy. This view is supported by the 2008 financial crisis when major banks considered “too big to fail” were rescued by national governments at a time of widespread distrust to avoid even more devastating consequences for financial systems and the global eco-nomy. Furthermore, according to Cheng, Warfield, and Ye (2011), the effects of this crisis increase the need to study earnings management practices in the banking industry because banks play such a critical role in the economy.
Goulart (2007) states that one of the foundations of a sound financial system is transparency, which is why international agencies and the central banks of various nations demand that financial institutions disclose in-formation that appropriately demonstrates their equity, as well as their financial and earnings situations, besides other aspects, such as organizational structure, internal controls, and risk management. The assumption is that this transparency requirement is mainly met by the
fi-nancial statements. According to the author, however, earnings management practices may harm the disclosu-re of the disclosu-real situation in these organizations.
In addition to concerns about possible manipulation to conceal a situation that could damage the financial health of an institution and the need to reduce infor-mation asymmetry among an institution’s shareholders, the issue of earnings management in banking institu-tions involves another important aspect, highlighted by Marcondes (2008): earnings management’s impact on market discipline. The author has shown empirically that accounting manipulation, as measured by discre-tionary accruals, influences the reduction of interest rates negotiated between banks and depositors, genera-ting benefits for the financial institutions that use this practice - they pay lower interest rates to depositors than risk indicators would suggest without such accru-als, thus exerting the transfer of income between these agents.
2.2 The Use of the Securities Portfolio for
Earnings Management in Banks.
As noted in the introduction, studies on earnings ma-nagement in financial institutions focus on specific accru-al models, concentrating in particular on the anaccru-alysis of LLPs. Another subject that raises concern in regard to the possibility of manipulation of the financial statements of banking institutions is the classification and measurement of the fair value of securities. Beatty, Ke, and Petroni (2002) have demonstrated that these are the two components of bank earnings that are most subject to manipulation.
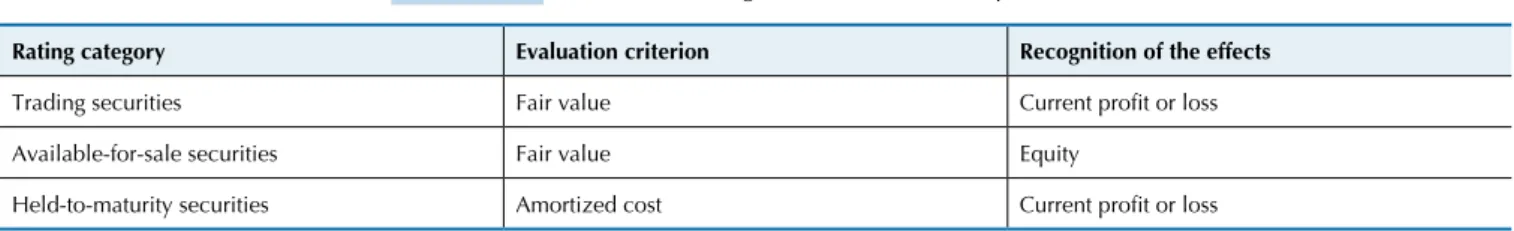
Table 1 Securities categories and evaluation parameters
Rating category Evaluation criterion Recognition of the effects
Trading securities Fair value Current profit or loss
Available-for-sale securities Fair value Equity
Held-to-maturity securities Amortized cost Current profit or loss
Source: Circular BCB 3.068/2001.
the criteria defined by the BCB, through Circular 3.068 of 11/08/2001, summarized in Table 1. Because evalu-ation parameters and the impact on earnings are diffe-rent depending on the category in which the securities are rated, managers may use this prerogative to practice earnings management. It is noteworthy that the recent changes introduced by the International Financial Re-porting Standard - IFRS 9, estimated to become
effec-tive January 1, 2015, modifies this classification system and the criteria for evaluation and recognition, but its guidelines are not considered in the present study be-cause they have not yet been approved by the regula-tory framework set by BCB, and even if they had, their effective term would not fall within the timescale of the present research.
Regarding fair value measurement, Fiechter and Meyer (2010) note that the process of valuing financial instruments at fair value is complex, particularly when they are or they become illiquid; such valuations are ba-sed on subjective conditions that are difficult to verify and involve a considerable degree of uncertainty. In such situations, the use of pricing models is required with the difficulties inherent in the definition of assumptions (Goulart, 2007). This approach contributes to an en-vironment that is conducive to the management of fi-nancial information, comprehensive disclosure require-ments notwithstanding (Fiechter & Meyer, 2010). Nissim (2003) also notes that although fair value is increasingly recommended by regulators and demanded by users of financial statements as the basis of accounting measure-ment, criticisms remain as to the potential uncertainty when there is no market price for the asset.
In the financial crisis of 2008, for example, the uns-table environment led the International Federation of Accountants (IFAC, 2008) to disseminate an alert to help auditors verify the fair value of financial instru-ments, in which concern regarding the degree of un-certainty in the absence of an active fair value was hi-ghlighted. According to IFAC, this uncertainty creates a natural tendency to bias in management's judgment, where management presents a more favorable scenario than reality dictates, requiring the auditor to identify indicators of possible management bias.
2.3 Studies on the Use of Securities for Earnings
Management in Banks.
The use of the securities portfolio for earnings or ca-pital management by banking institutions has received a good deal of attention from accounting researchers, especially regarding the practice of income smoothing, both internationally and in the Brazilian market.
The following studies can be highlighted in the in-ternational realm: Moyer (1990) found no evidence of the use of profits and losses from securities for capi-tal management; Beatty, Chamberlain, and Magliolo
(1995) and Kanagaretnam, Lobo, and Mathieu (2003, 2004) found income smoothing in earnings manage-ment, usually jointly and complementarily with the es-tablishment of LLP; Beatty and Harris (1999), Beatty, Ke, and Petroni (2002) and Shrieves and Dahl (2003) confirmed that publicly traded banks engage in earnin-gs management practices using profits and losses on securities more than privately held companies; Fiechter and Meyer (2010) found that banks engaged in discre-tionary evaluations of Level 3 financial instruments - those that display a higher degree of subjectivity given the absence of active markets - during the financial crisis of 2008 with the purpose of practicing big bath accounting (characterized by the anticipation of ex-penditures that need not be recognized in the ongoing fiscal year, thus creating conditions for increased fu-ture earnings); Quagli and Ricciardi (2010) found that European banks have used new options for the rerating of financial instruments provided by the October 2008 amendment to the International Accounting Standard - IAS 39 for earnings management practices but not for the level of capitalization.
In the Brazilian market, Zenderski (2005), Montei-ro, and Grateron (2006), Santos (2007), Xavier (2007), Goulart (2007), Baggio, Monteiro, and Toda (2007), and Gabriel and Corrar (2010) also evaluated the use of management discretion in relation to the classifi-cation and measurement of the fair value of securities portfolios for the purposes of earnings or capital ma-nagement.
An analysis of the impact of adopting fair value for the measurement of securities was conducted by Mon-teiro and Grateron (2006) in June 2002. The authors concluded that there was a decrease in volatility, and they showed evidence of income smoothing using fair value adjustments of securities by the banking institu-tions studied. In a later study using semiannual data from 2002 to 2005, Baggio, Monteiro, and Toda (2007) found that the volatility of the equity of banks has in-creased since the adoption of the fair value criterion for the measurement of financial instruments.
The hypothesis of earnings management using pre-miums on investments in subsidiaries and associates, securities operations, loan loss provisions, and con-tingent liabilities was analyzed by Xavier (2007), who found that 55% of the assessed banks used securities classification for earnings management.
Gabriel and Corrar (2010) adopted a two-stage model for identifying the discretionary and non-dis-cretionary portions of fair value adjustments to secu-rities portfolios to assess whether Brazilian banks use the prerogative of fair value adjustments in measuring securities for earnings and capital management. The authors concluded that managers of financial institu-tions use fair value adjustments as a method for prac-ticing earnings management and for the management of equity levels. As a caveat, it should be noted that in the second stage, a positive relationship was observed between the discretionary portion of fair value adjust-ments and quarterly earnings, contrary to the evidence of income smoothing in the Brazilian market found by Zenderski (2005), Monteiro and Grateron (2006), San-tos (2007), and Goulart (2007).
2.4 Use of Two-Stage Models for Identification
of Securities-Based Earnings Management
According to Goulart (2007), for the analysis of speci-fic accruals for earnings management, such as profits and losses on securities, the following can be adopted as rese-arch procedures: (i) the estimation and analysis of the re-lationship with accounting earnings, herein referred to as the one-stage model, to identify the possible use of inco-me smoothing, and (ii) the use of a model to estimate the discretionary component of the specific account under analysis, known as a two-stage model. The differences be-tween the two procedures are that in the two-stage model, first, the discretionary portion of the dependent variable is identified and is represented by the error term of the specification model for the non-discretionary portion, and second, the relationship between this discretionary portion and the variables of interest for earnings mana-gement are evaluated. In an one-stage model there is no separation of the discretionary portion.
In the literature concerning the use of income from secu-rities for earnings or capital-level management in financial institutions, the one-stage model has prevailed. In the studies listed in the previous section, for example, only four - Beatty and Harris (1999), Beatty, Ke, and Petroni (2002), Fiechter and Meyer (2010), and Gabriel and Corrar (2010) - used two-stage models where the discretionary portion was first identified, represented by the error term of the specification model for the non-discretionary portion, and the association between this discretionary activity and the variables of inte-rest in the study was subsequently evaluated.
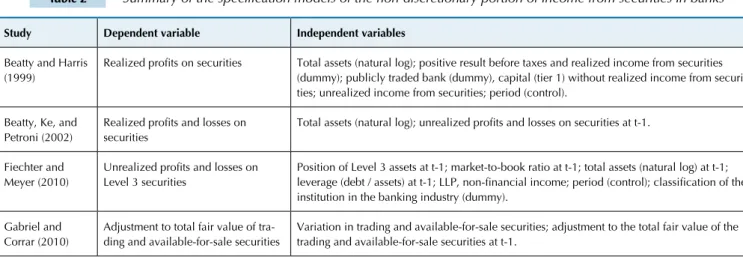
A summary of the models used for specifying the non-discretionary portion of income from securities is shown in Table 2.
Table 2 Summary of the specification models of the non-discretionary portion of income from securities in banks
Study Dependent variable Independent variables
Beatty and Harris (1999)
Realized profits on securities Total assets (natural log); positive result before taxes and realized income from securities
(dummy); publicly traded bank (dummy), capital (tier 1) without realized income from securi-ties; unrealized income from securisecuri-ties; period (control).
Beatty, Ke, and Petroni (2002)
Realized profits and losses on securities
Total assets (natural log); unrealized profits and losses on securities at t-1.
Fiechter and Meyer (2010)
Unrealized profits and losses on Level 3 securities
Position of Level 3 assets at t-1; market-to-book ratio at t-1; total assets (natural log) at t-1; leverage (debt / assets) at t-1; LLP, non-financial income; period (control); classification of the institution in the banking industry (dummy).
Gabriel and Corrar (2010)
Adjustment to total fair value of tra-ding and available-for-sale securities
Variation in trading and available-for-sale securities; adjustment to the total fair value of the trading and available-for-sale securities at t-1.
A common procedure adopted in the four models is the scaling of monetary variables, which is the case for all dependent and some independent variables – e.g., capital, income, position of Level 3 assets, LLP, varia-tion in the balance of securities, and fair value adjust-ments. The differences are in relation to the scaling parameters used: Beatty and Harris (1999) and Gabriel and Corrar (2010) used total assets; Beatty, Ke, and Pe-troni (2002) used total assets at the beginning of the
period, and Fiechter and Meyer (2010) used equity at the beginning of the period.
before profits and losses from securities, type of institution (publicly traded or private), level of capitalization, market-to-book ratio, leverage, and loan loss provision, for example, seem to more adequately constitute evidence of managerial discretion than a "natural" relationship of the dimension of income from securities. This property is especially the case in the models of Beatty and Harris (1999) and Fiechter and Meyer (2010). Although the need to meet specific research interests may justify the inclusion of these types of variables in the models, it is perhaps incorrect to isolate the impact of these variables from the error term and to call them discre-tionary or non-discrediscre-tionary portions.
In the case of the Beatty, Ke, and Petroni (2002) and Gabriel and Corrar (2010) models, the small number of explanatory variables must be emphasized
becau-se they are the determinants of the non-discretionary portion of the accruals. A likely consequence is the contamination of the error portion, which represents the discretionary actions of management. Although the limitations of econometric models in capturing mana-gerial discretion in the recognition of accruals are an issue addressed by several authors (Dechow, Sloan, & Sweeney, 1995; Healy, 1996; Bernard & Skinner, 1996; Paulo, 2007; Jones, Krishnan, & Melendrez, 2008), the greater exposure to risk from omitted variables may exacerbate this type of problem. This exposure may be the reason, for example, for the contradictory results found by Gabriel and Corrar (2010) in regard to the income smoothing hypothesis in the Brazilian market, as outlined in Section 2.3.
3 METHODOLOGICAL PROCEDURES
Given the purpose of this study, the methodological procedures consist of the specification of a two-stage mo-del aiming to show the use of discretion in income from securities and to provide a validation test of the model, comparing its results with those of a one-stage model.
In constructing the proposed operational model, an analytical research approach was used, focusing on the modeling of financial and economic phenomena to generate empirically testable hypotheses (Paulo, 2007). According to Demski (2005), the construction of a mo-del should be a product of analytical research with the application of a logical and deductive process. Ronen and Yaari (2008) highlight several concepts and models used for this purpose, particularly in analytical resear-ch aiming to identify earnings management practices.
3.1 Two-Stage Model for Discretion Over
Securities.
Based on arguments put forward by Beatty and Harris (1999), Beatty, Ke, and Petroni (2002), Fiechter and Meyer (2010), and Gabriel and Corrar (2010) mentioned in the theoretical framework section, the models developed to determine discretionary LLP in banks - such as in Kana-garetnam, Lobo, and Mathieu (2003, 2004), Zenderski (2005), Alali and Jaggi (2010), and Kanagaretnam, Krish-nan, and Lobo (2010) - and to gather information regar-ding securities portfolios available in the QFS of Brazilian banks, the following model was developed to identify the discretionary portion of income from securities:
IncSECi,t = β0 + βi + β1SECi,t-1 + β2ΔSECi,t +
β3BIRt + β4GDPt + β5EXCHt +β6IBOVt + ψ1 <TYPi,t>+ ψ2 <MATi,t> +
ψ3 <CONi,t> + εi,t , 3.1
where
IncSECi,t: Income from bank securities i at period t, scaled by total assets at the beginning of period t;
SECi,t-1: Portfolio balance of bank securities i at period t-1, scaled by total assets at the beginning of period t-1;
ΔSECi,t: Change in the securities portfolio of bank i
betwe-en periods t-1 and t, scaled by total assets at the begin-ning of period t;
BIRt: Base interest rate of the economy in real terms in quarter t - Selic rate, deflated by the Extended National Consumer Price Index (Índice de Preços ao Consumi-dor Amplo - IPCA);
GDPt: Gross Domestic Product variation from base values for period t;
EXCHt: Brazilian real exchange rate variation at period t - free exchange rate of the U.S. dollar (sale), deflated by the IPCA;
IBOVt: Ibovespa index (Sao Paulo Stock Exchange Index - Índice da Bolsa de Valores de São Paulo) variation at period t, deflated by the IPCA;
<TYPi,t>: Vector of variables representing the proportion of the bank's securities portfolio i at period t, repre-sented in five investment categories: Brazilian govern-ment securities (títulos públicos federais - TPF), state or municipal securities (títulos públicos estaduais ou municipais (STMN), Bank Deposit Certificates (Cer-tificado de Depósito Bancário – CDB), real estate, and mortgage bonds (CDBB), debentures and shares (DE-BSH), and other securities (OS);
<MATi,t>: Vector of variables representing the proportion of the bank's securities portfolio i at period t, distri-buted according to the maturity date of the securities: without maturity date (WMD), maturity in up to 12 months (U12M), maturity in over 1 and up to 5 ye-ars (U5Y), maturity in between 5 and 15 yeye-ars (U15Y), and maturity in more than 15 years (M15Y);
<CONi,t>: Vector of variables representing the degree of concentration of the bank's securities portfolio i at pe-riod t, identifying the proportion of the portfolio ap-plied to: governmental issuers (GOV), the 10 largest private issuers (L10PR), the following 50 largest private issuers (L50PR), the following 100 largest private is-suers (L100PR), and other private isis-suers (OPR); and
The construction of the model designed to identi-fy discretionary accruals related to the measurement of the securities portfolio at fair value initially considers that the non-discretionary portion of this income is re-lated to the portfolio balance at the end of the previous period (SEC(-1)) and to the variation in the current period (ΔSEC). The analytical assumption behind the inclusion of these variables is that the portion of income from secu-rities that is explained by the portfolio balance cannot be understood as a discretionary management action becau-se it is usual that a larger volume of resources invested in securities will generate higher income. Gabriel and Corrar (2010) use a similar approach with two exceptions: first, instead of using the portfolio balance from the previous period, they use the fair value adjustment. Second, the focus of those authors is specifically on the trading and available-for-sale securities portfolio. In addition to the analytical assumptions outlined and those from Gabriel and Corrar's (2010) study, the inclusion of these variables is also based by analogy on studies designed to identify discretionary LLPs in banks (Kanagaretnam, Lobo, & Ma-thieu, 2003, 2004; Zenderski, 2005; Alali & Jaggi, 2010; Kanagaretnam, Krishnan, & Lobo, 2010), which incorpo-rate the explanatory variables of expenditures on this type of provision in a given period, including the balance of loans overdue in the previous period, the variation in the balance of matured loans, and the variation in the balance of the loan portfolio, among others.
Regarding the variable ΔSEC, it is important to note a limitation due to the type of information available. It would be more appropriate to identify securities relative to effecti-ve purchases and sales, rather than the variation in the ba-lance of the portfolio, which includes profits and losses for the period. In any case, even with this limitation, the varia-tion of the portfolio is considered an appropriate proxy for the buying and selling of securities in the period. Thus, we start from the premise that the measurement of profits and losses on the securities has a relatively uniform association with the portfolio balance. The limitation highlighted lays in the fact that in times of crisis, this assumption may be compromised.
To improve the model’s specification while seeking to minimize the error term - which represents the dis-cretionary portion of the IncSEC - other explanatory variables that are associated with the non-discretiona-ry portion of income from securities are included in the model. Thus, in addition to the portfolio balance in the previous month and the proxy for movements during the period, variables regarding the base interest rate of the economy (BIR), the level of economic gro-wth (GDP), the exchange rate variation (EXCH), the Ibovespa variation (IBOV), the types of securities that comprise the portfolio (TYP), the maturity dates of the securities (MAT), and the degree of concentration by issuer (CON) are all included.
The justification for incorporating the base interest rate of the economy (BIR) among the explanatory variables for income from securities is that TPFs have significant
par-ticipation in the Brazilian securities market. Moreover, a change in the level of real interest rates will be reflected in the pricing of other securities in the market by affecting the expectations of market agents. Thus, it is assumed that the behavior of IncSEC explained by the BIR variable cannot be attributed to managerial discretion. As for the expected sign for this relationship, different effects are predicted ba-sed on the composition of the portfolio: for floating-rate securities indexed to the Selic rate, a change in the level of interest rates has a positive effect; for securities with pre-fixed interest rates, changes in the interest rate of the eco-nomy should be reflected in a decrease in fair value. The predicted relationship between the base interest rate of the economy and income from securities was first proposed by Shrieves and Dahl (2003), Agarwal, Chomsisengphet, Liu, & Rhee (2005), and Santos (2007).
In the case of the GDP variable, the assumption is that the behavior of the economy affects the value of se-curities, including the earnings from marketing actions of management, which are a possible trade-off with the loan portfolio. This assumption is based by analogy on the formulations of Shrieves and Dahl (2003) and Gray and Clarke (2004), which associated LLP in banking institutions with the level of economic activity repre-sented by the GDP variation. For the present study, we consider that in periods of great economic activity, for example, the demand for loans will increase, leading bank operations to be more profitable than income from securities and thus reducing the proportion of in-come from securities in relation to total assets. Thus, a negative relationship is expected between income from securities and the level of economic activity re-presented by the variation in gross domestic product. We consider that the variation in income from secu-rities that is explained by the behavior of the variable GDP cannot be credited to the opportunistic action of management.
The EXCH variable is included to capture the im-pact of exchange rate variation on the fair value of se-curities. The assumption is that the value of securities should react positively to changes in the exchange rate and such changes in the fair value of securities should not be attributed to the discretionary actions of bank managers, who have no control over this element. A positive association is expected between the IncSEC and EXCH variables because a negative impact of a po-sitive exchange rate variation on the income of banking institutions can only be associated with short positions in foreign currencies, particularly in derivative trading, and not with a securities portfolio.
Inco-meSEC and IBOV will be positive, which is consistent with the assumptions of Shrieves and Dahl (2003), Aga-rwal et al. (2005), and Santos (2007).
Regarding the use of vectors to represent characteris-tics of the portfolio (TYP, MAT, and CON), we base the present study on the works of Kanagaretnam, Krishnan, and Lobo (2010) and Kanagaretnam, Lim, and Lobo (2010), which used the parameters of the loan portfolios of banks to estimate their LLPs. Regarding the type of securities that comprise the portfolio, TYP, the aim is to capture the effects of behavioral differences in the fair value of securities as a function of the composition of the portfolio of each bank, particularly in relation to the type of financial instrument and the issuer. For the matu-rity of the securities comprising the portfolio, MAT, the assumption is that the effect on the fair value of financial instruments differs according to maturity, i.e., shorter-term securities are less subject to market risk and thus less susceptible to volatility resulting from changes in overall economic conditions. To measure the concentra-tion of the securities portfolio, the vector of variables CON, the understanding is that because the portfolio’s
concentration represents a measure of risk, it is impor-tant to control its effects in relation to the assessment of the fair value of the portfolio, bearing in mind that a fi-nancial institution that has concentrated its investments in securities from few issuers may behave differently in relation to the assessment of the fair value of its portfolio than a bank that has a more diversified portfolio.
For the abovementioned reasons, variations in inco-me from securities that may be attributed to the cha-racteristics of the type of security that comprises the portfolio, the maturity of such securities, and the degree of concentration by issuer are considered non-discretio-nary, i.e., they cannot be attributed to an opportunis-tic action of management. Regarding the variables that comprise the vectors, the expected behaviors for each also cannot be attributed. The behaviors’ aim is limited to controlling their effects on the behavior of the depen-dent variable, IncSEC.
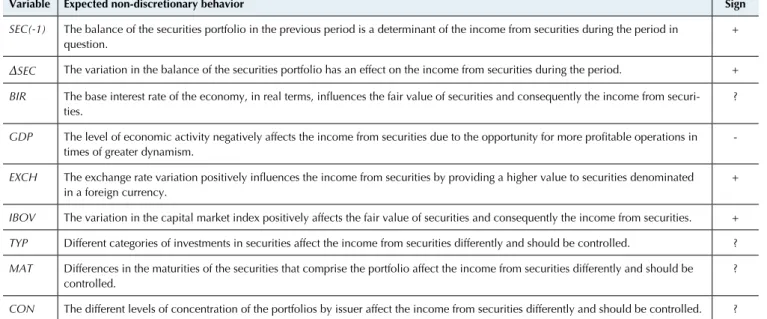
In summary, the process of estimating the non-discre-tionary portion of income from securities, proposed in Model (3.1), considers the variables and relationships sho-wn in Table 3.
Table 3 Summary of expected relationships in explaining the non-discretionary portion of income from securities (IncSEC) in the estimation of the Model (3.1)
Variable Expected non-discretionary behavior Sign
SEC(-1) The balance of the securities portfolio in the previous period is a determinant of the income from securities during the period in question.
+
ΔSEC The variation in the balance of the securities portfolio has an effect on the income from securities during the period. +
BIR The base interest rate of the economy, in real terms, influences the fair value of securities and consequently the income from securi
-ties.
?
GDP The level of economic activity negatively affects the income from securities due to the opportunity for more profitable operations in
times of greater dynamism.
-EXCH The exchange rate variation positively influences the income from securities by providing a higher value to securities denominated
in a foreign currency.
+
IBOV The variation in the capital market index positively affects the fair value of securities and consequently the income from securities. +
TYP Different categories of investments in securities affect the income from securities differently and should be controlled. ?
MAT Differences in the maturities of the securities that comprise the portfolio affect the income from securities differently and should be controlled.
?
CON The different levels of concentration of the portfolios by issuer affect the income from securities differently and should be controlled. ?
3.2 Procedure for Model Validation Test (3.1).
Considering the evidence obtained by Zenderski (2005), Monteiro and Grateron (2006), Santos (2007), and Goulart (2007) that Brazilian banking institutions have used securities operations to promote income smoothing, the procedures adopted for Model Valida-tion (3.1) comprise the following: (i) estimaValida-tion of a one-stage model to confirm the expected hypothesis of income smoothing, and (ii) the specification of the se-cond stage of Model (3.1) to confirm whether the results regarding income smoothing are consistent with the re-sults obtained from the one-stage model.
For validation purposes, therefore, Model (3.2) was used as a reference to confirm the hypothesis of income
smoothing:
IncSECi,t= β0 + βi + β1(NPi,t - IncSECi,t)+ β2ΔEVAi,t +
β3SECi,t + β4BIRt + β5GDPt + β6EXCHt +
β7IBOV+ β8NACi + β9PRVi+β10lnTAi,t + εi,t , 3.2
where
NPi,t: Net profit of bank i at period t, scaled by total assets at the beginning of period t;
ΔEVAi,t: Change in the Equity Valuation Adjustment ac-count of bank i between periods t-1 and t, scaled by total assets at the beginning of period t;
0 for the others;
PRVi: Dummy variable, assuming a value of 1 for private equity financial institutions i and 0 for the others; and lnTAi,t: Natural logarithm of total assets of the bank i at
pe-riod t, deflated by the IPCA.
For the construction of this model, variables used in studies cited in Sections 2.3 and 2.4 were included - in par-ticular, Shrieves and Dahl (2003) and Santos (2007), who inspired the inclusion of the variables NP-IncSEC, BIR, IBOV, PRV, and lnTA - and in the assumptions discussed in the development of Model (3.1).
The hypothesis of earnings management aimed at inco-me smoothing is confirinco-med if a negative relationship be-tween the dependent variable and net profit prior to gains and losses from securities (NP-IncSEC) is demonstrated. That is, income from securities increases (decreases) when earnings before profits and losses from securities are lower (higher). A negative sign for the variable ΔEVA means that
banks use the classification of the available-for-sale secu-rities portfolio as a management tool. In addition to these two variables of interest and the balance of the securities in the portfolio (SEC), control variables are included. The base interest rate (BIR), the exchange rate variation (EXCH), the behavior of the capital market (IBOV), and the level of eco-nomic growth (GDP) are included to capture their effects on the valuation of the securities portfolio for the same rea-sons that justified their inclusion in Model (3.1). In the case of variables NAC, PRV, and lnTA, the aim is to identify and control behavioral differences in the process of fair value measurement and the classification of the securities portfo-lio in relation to the characteristics of financial institutions according to the origin of capital control - national/foreign bank and private/government-owned - and the size of the institution.
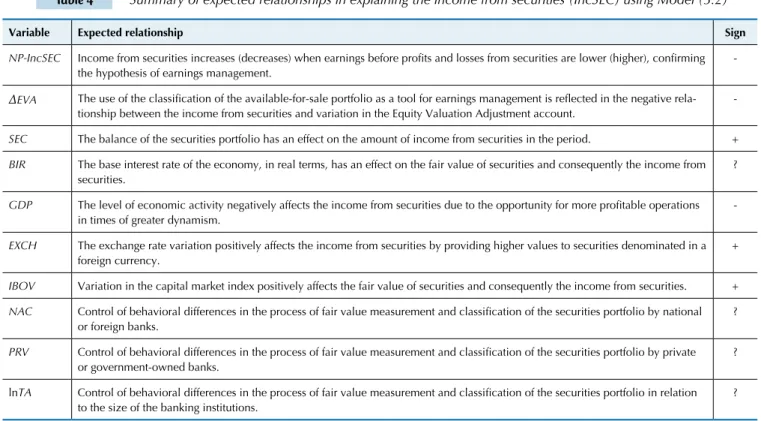
Considering this context, Table 4 summarizes the ex-pected results in the estimation of income from securities according to Model (3.2):
Table 4 Summary of expected relationships in explaining the income from securities (IncSEC) using Model (3.2)
Variable Expected relationship Sign
NP-IncSEC Income from securities increases (decreases) when earnings before profits and losses from securities are lower (higher), confirming the hypothesis of earnings management.
-ΔEVA The use of the classification of the available-for-sale portfolio as a tool for earnings management is reflected in the negative rela
-tionship between the income from securities and variation in the Equity Valuation Adjustment account.
-SEC The balance of the securities portfolio has an effect on the amount of income from securities in the period. +
BIR The base interest rate of the economy, in real terms, has an effect on the fair value of securities and consequently the income from securities.
?
GDP The level of economic activity negatively affects the income from securities due to the opportunity for more profitable operations
in times of greater dynamism.
-EXCH The exchange rate variation positively affects the income from securities by providing higher values to securities denominated in a foreign currency.
+
IBOV Variation in the capital market index positively affects the fair value of securities and consequently the income from securities. +
NAC Control of behavioral differences in the process of fair value measurement and classification of the securities portfolio by national
or foreign banks.
?
PRV Control of behavioral differences in the process of fair value measurement and classification of the securities portfolio by private
or government-owned banks.
?
lnTA Control of behavioral differences in the process of fair value measurement and classification of the securities portfolio in relation
to the size of the banking institutions.
?
The next step of the validation process is to identify the practice of income smoothing, where the dependent varia-ble is not total income from securities but its discretionary portion (DIncSEC), measured as the error term of Model (3.1) - the first stage. To assess the hypothesis of income smoothing, the following model is applied, which constitu-tes the second stage of the Model (3.1):
DIncSECi,t = β0 + βi + β1(NPi,t - IncSECi,t)+ β2ΔEVAi,t + βSNACi + β4PRVi+β5lnTAi,t + εi,t . 3.3
As observed, apart from a change in the dependent va-riable, Model (3.3) follows the same construction logic as Model (3.2) for the assessment of earnings management, except that variables SEC, BIR, and GDP are excluded be-cause they have already been considered in the calculation
of the non-discretionary portion of the income from se-curities in Model (3.1). Confirmation of the hypothesis of income smoothing in Model (3.3) is dependent on the sta-tistical significance and negative sign on the variable (NP-IncSEC), while the observation of the use of classification of the portfolio for earnings management purposes depends on the evidence obtained in relation to the variable ΔEVA, similar to Model (3.2).
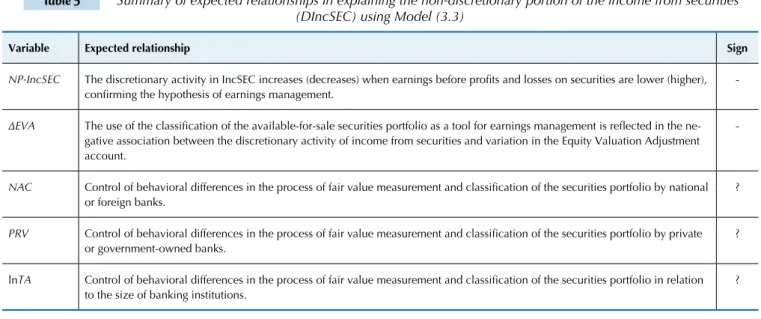
Table 5 Summary of expected relationships in explaining the non-discretionary portion of the income from securities (DIncSEC) using Model (3.3)
Variable Expected relationship Sign
NP-IncSEC The discretionary activity in IncSEC increases (decreases) when earnings before profits and losses on securities are lower (higher), confirming the hypothesis of earnings management.
-ΔEVA The use of the classification of the available-for-sale securities portfolio as a tool for earnings management is reflected in the ne
-gative association between the discretionary activity of income from securities and variation in the Equity Valuation Adjustment account.
-NAC Control of behavioral differences in the process of fair value measurement and classification of the securities portfolio by national
or foreign banks.
?
PRV Control of behavioral differences in the process of fair value measurement and classification of the securities portfolio by private
or government-owned banks.
?
lnTA Control of behavioral differences in the process of fair value measurement and classification of the securities portfolio in relation
to the size of banking institutions.
?
3.3 Sample.
The empirical tests were based on data from the QFS of commercial banks, multiple-purpose banks, and savings banks, all of which are members of the Brazilian Financial System (Sistema Financeiro Nacio-nal - SFN), for the period between the third quarter of 2002 and fourth quarter of 2010. The reason for the restriction of the initial sample period was the need to avoid the effects of the initial adoption of the criteria for the classification and valuation of securities defined in Circular BCB 3.068/2001. The approach was to work with data produced after the closing of the first semi-annual balance sheet after the effective date of the rule to avoid any "noise" caused by adjustments in the por-tfolio when the rule was first adopted.
Given the parameters that define the sample and the QFS disclosed on the BCB website, data from 207 commercial banks, multiple-purpose banks, and savings banks were considered. In the preliminary data analy-sis, several observations were made that provided strong evidence of inconsistencies or particular situations that were usually associated with startup periods or periods during which the institutions' operations were disconti-nued. To avoid the risk of contaminated test results cau-sed by anomalous situations that presented a clear dis-proportion between income and the assets invested, 16 observations were excluded from the database (all were at least 4 standard deviations from the mean), resulting in 5,827 bank observations per quarter.
4 RESULTS
As a precondition to ensure the robustness of the results from the estimation of Models (3.1), (3.2), and (3.3), Im, Pesaran, and Shin unit root tests were per-formed, as shown in Table A.1 (Appendix), to check the condition of stationarity of the non-dichotomous series, and the null hypothesis of a unit root was rejec-ted in all of them. The risk of spurious regressions was thereby eliminated.
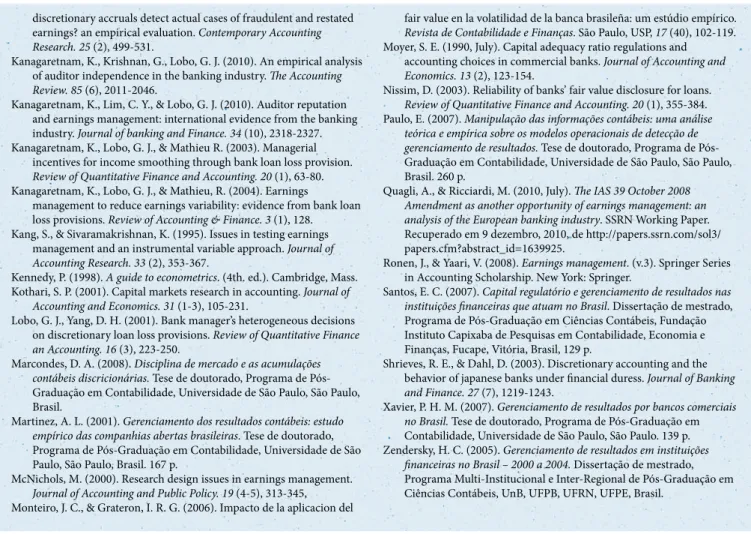
Additionally, prior to model estimation, Pearson’s Correlation Matrix was applied between the regressors, as shown in Tables A.2 and A.3 (Appendix), to assess the correlation between the explanatory variables of the tes-ted models, which could reflect a high degree of multi-collinearity and could even result in changes in the signs of the coefficients for the variables of interest. The rule of thumb suggested by Kennedy (1998) that the risk of multicollinearity is a serious problem when the correla-tion coefficients between the regressors are high - higher than 0.8 - was considered. One case of a high correlation coefficient close to that limit was identified - a positive
correlation of 0.78 between holdings of government se-curities (TPF) and concentration of government bonds in the portfolio (GOV), which can be explained by the low representativeness of state and municipal bonds. Thus, to minimize the risk of multicollinearity in the results, these variables are not jointly included when es-timating Models (3.1) and (3.2).
4.1 Specification of the Non-Discretionary
Portion of Income from Securities.
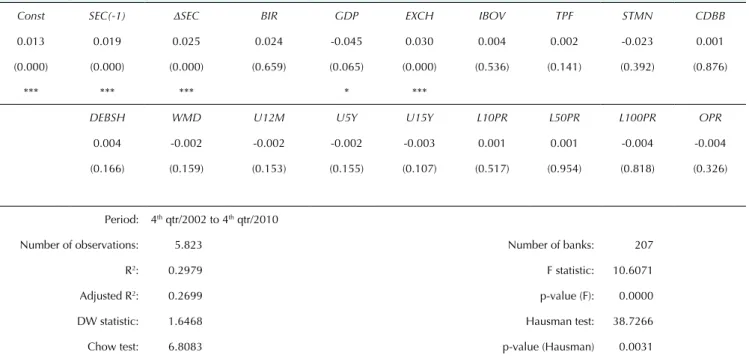
Table 6 Results of cross-sectional fixed-effects regression estimation for identification of discretionary activity in income from securities.
Model tested:
IncSECi,t = β0 + βi + β1SECi,t-1 + β2ΔSECi,t + β3BIRt + β4GDPt + β5CAMt +β6IBOVt + ψ1 <TYPi,t>+ ψ2 <MATi,t> + ψ3 <CONi,t> + εi,t
Const SEC(-1) ΔSEC BIR GDP EXCH IBOV TPF STMN CDBB
0.013 0.019 0.025 0.024 -0.045 0.030 0.004 0.002 -0.023 0.001
(0.000) (0.000) (0.000) (0.659) (0.065) (0.000) (0.536) (0.141) (0.392) (0.876)
*** *** *** * ***
DEBSH WMD U12M U5Y U15Y L10PR L50PR L100PR OPR
0.004 -0.002 -0.002 -0.002 -0.003 0.001 0.001 -0.004 -0.004
(0.166) (0.159) (0.153) (0.155) (0.107) (0.517) (0.954) (0.818) (0.326)
Period: 4th qtr/2002 to 4th qtr/2010
Number of observations: 5.823 Number of banks: 207
R2: 0.2979 F statistic: 10.6071
Adjusted R2: 0.2699 p-value (F): 0.0000
DW statistic: 1.6468 Hausman test: 38.7266
Chow test: 6.8083 p-value (Hausman) 0.0031
IncSEC is the income from securities, scaled by total assets at the beginning of the period; SEC is the balance of the securities portfolio, scaled by total assets at the beginning of the period; ΔSEC is the variation in portfolio securities, scaled by total assets at the beginning of the period; BIR is the base inte-rest rate of the economy in real terms; GDP is the variation of the Gross Domestic Product at base values; EXCH is the real variation in the exchange rate; IBOV is real Ibovespa growth, TYP is the proportion of the securities portfolio represented in the five categories of investments – Brazilian government bonds (TPF), state, or municipal securities (STMN), CDBs, real estate, and mortgage bonds (CDBB), debentures and shares (DEBSH), and other securities (OS); MAT is the proportion of the securities portfolio distributed according to the maturity of the financial instruments - without maturity date (WMD), up to 12 months (U12M), more than 1 and up to 5 years (U5Y), more than 5 to 15 years (U15Y), and more than 15 years (M15Y); CON is the degree of
con-centration in the securities portfolio, which identifies the proportion of the portfolio applied to government issuers (GOV), the 10 largest private issuers
(L10PR), the following 50 largest private issuers (L50PR), the following 100 largest private issuers (L100PR), and the other private issuers (OPR).
Legend for the significance level of the parameters: at 1% (***), at 5% (**), and at 10% (*). Figures between parentheses are the parameters’ p-values.
Consistent with the hypothesis proposed in Section 3.1, significant positive parameters were found for the variables
SEC(-1) and ΔSEC, indicating that income from securities is related to the size of the resources invested in the por-tfolio, which cannot be attributed to the discretionary ac-tions of management. A positive relaac-tionship between Inc-SEC and the exchange rate variation variable (EXCH) was also observed, confirming the expectations outlined in the construction of the model. For the GDP variable, a negative relationship was found, indicating that in times of greater economic growth there is a decrease in the relative income from securities, which can be explained by the trade-off with loan transactions, i.e., in periods of greater economic dynamism, a natural transfer of resources for loans may oc-cur, reducing the proportion of income from securities in relation to total assets.
For the IBOV variable, the expected positive rela-tionship with income from securities was not confirmed, which could be explained by the low proportion of proper-ty securities in the portfolio. In the case of the BIR variable, no significant relationship was found, which constitutes evidence of the dichotomy highlighted in Section 3.1 that a
variation in interest rates can have different effects on the fair value of securities, depending on whether the rate is pre-fixed or is a floating rate indexed to the Selic rate.
The effects of type, maturity, and degree of concen-tration of the securities portfolio were also controlled for. There were no significant associations found betwe-en income from securities and the variables that cons-titute the vectors TYP, MAT, and CON. One potential explanation for this result could be the detailing of these vectors. Additionally, it is noteworthy that for the speci-fication of the non-discretionary portion, the portion of cross-sectional fixed-effects (βi) is considered in addi-tion to the coefficients of the variables and the constant. The error term corresponds to the discretionary portion of income from securities.
4.2 Identification of Income Smoothing Using a
One-Stage Model.
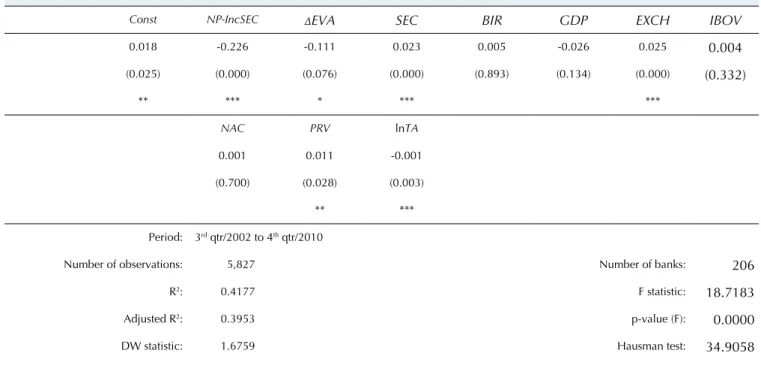
Table 7 Results of cross-sectional fixed-effects regressions tests using the one-stage model for identifying income
smoothing
Model tested:
IncSECi,t = β0 + βi + β1(NPi,t - IncSECi,t)+ β2ΔEVAi,t + β3SECi,t + β4BIRt + β5GDPt + β6EXCHt +β7IBOV+ β8NACi + β9PRVi+β10ln TAi,t + εi,t
Const NP-IncSEC ΔEVA SEC BIR GDP EXCH IBOV
0.018 -0.226 -0.111 0.023 0.005 -0.026 0.025 0.004
(0.025) (0.000) (0.076) (0.000) (0.893) (0.134) (0.000) (0.332)
** *** * *** ***
NAC PRV lnTA
0.001 0.011 -0.001
(0.700) (0.028) (0.003)
** ***
Period: 3rd qtr/2002 to 4th qtr/2010
Number of observations: 5,827 Number of banks: 206
R2: 0.4177 F statistic: 18.7183
Adjusted R2: 0.3953 p-value (F): 0.0000
DW statistic: 1.6759 Hausman test: 34.9058
Chow test: 7.5115 p-value (Hausman) 0.0001
IncSEC is the income from securities, scaled by total assets at the beginning of the period; NP is the net profit, scaled by total assets at the beginning of the period; ΔEVA is the variation in the Equity Valuation Adjustment account, scaled by total assets at the beginning of the period; SEC is the balance of the securities portfolio, scaled by total assets at the beginning of the period; BIR is the base interest rate of the economy in real terms; GDP is the variation of the Gross Domestic Product at base values; EXCH is the real variation in the exchange rate; IBOV is the real Ibovespa growth; NAC takes a value of 1 for financial institutions under the control of national capital and 0 for the rest; PRV takes a value of 1 for financial institutions with private capital and 0 for the rest; and lnTA is the natural logarithm of total assets.
Legend for the significance level of the parameters: at 1% (***), at 5% (**), and at 10% (*). P-values between parentheses.
The statistical significance and the negative sign of the variable (NP-IncSEC) in explaining the IncSEC va-riable are consistent with the hypothesis of using inco-me from securities for the purpose of incoinco-me smoo-thing. This corroborates the findings of Zenderski (2005), Monteiro and Grateron (2006), Santos (2007), and Goulart (2007). A significant and inverse rela-tionship between the explanatory variable and ΔEVA
shows that banks use the classification of the available-for-sale portfolio in these discretionary management actions.
Regarding control variables, positive relationships were found between income from securities and: (i) the balance of the securities portfolio, which was natural and predictable, (ii) the exchange rate variation, demonstra-ting its relevance in the valuation of the portfolio as a re-sult of being a remuneration parameter of certain secu-rities, and (iii) financial institutions with private capital, demonstrating that these banks recorded higher income from securities than entities under government control. An inverse relationship was also observed between
Inc-SEC and the size of institutions, represented by lnTA, in-dicating that smaller-sized banks recorded a higher pro-portion of income from securities relative to total assets. For the variables BIR, GDP, and NAC, no relevant para-meters were identified, demonstrating that the net effects of the real base interest rate of the economy, the level of economic activity, and whether the capital control of the institution has foreign participation are not relevant to in-come from securities.
4.3 Identification of Income Smoothing using a
Two-Stage Model.
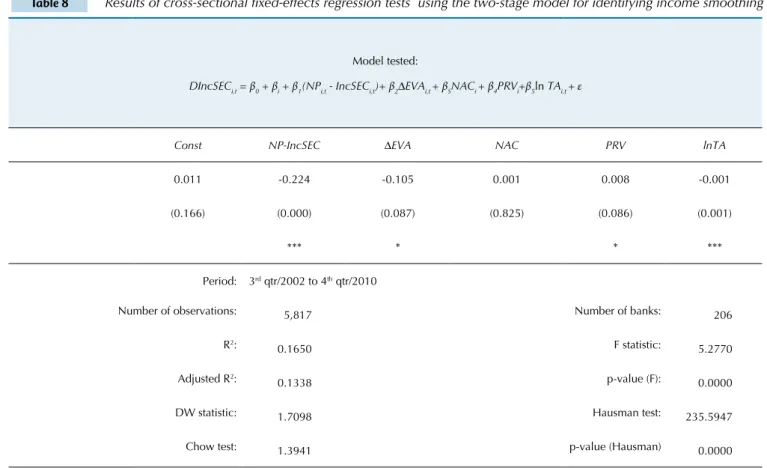
Table 8 Results of cross-sectional fixed-effects regression tests using the two-stage model for identifying income smoothing
Model tested:
DIncSECi,t = β0 + βi + β1(NPi,t - IncSECi,t)+ β2ΔEVAi,t + βSNACi + β4PRVi+β5ln TAi,t + ε
Const NP-IncSEC ΔEVA NAC PRV lnTA
0.011 -0.224 -0.105 0.001 0.008 -0.001
(0.166) (0.000) (0.087) (0.825) (0.086) (0.001)
*** * * ***
Period: 3rd qtr/2002 to 4th qtr/2010
Number of observations: 5,817 Number of banks: 206
R2:
0.1650 F statistic: 5.2770
Adjusted R2:
0.1338 p-value (F): 0.0000
DW statistic: 1.7098 Hausman test: 235.5947
Chow test: 1.3941 p-value (Hausman) 0.0000
DIncSEC is the discretionary portion of income from securities, scaled by total assets at the beginning of the period, which corresponds to the error term resulting from the estimation of Model (3.1); NP is the net profit, scaled by total assets at the beginning of the period; IncomeSEC is the income from securities, scaled by total assets at the beginning of the period; ΔEVA is the variation in the Equity Valuation Adjustment account, scaled by total assets at the beginning of the period; NAC takes a value of 1 for financial institutions under the control of national capital and 0 for the rest; PRV takes a value of 1
for financial institutions with private capital and 0 for the rest; and lnTA is the natural logarithm of total assets.
Legend for the significance level of the parameters: at 1% (***), at 5% (**), and at 10% (*). P-values in parentheses.
The statistical significance and negative sign of the va-riables (NP-IncSEC) and ΔEVA show similar results to those found with the one-stage model (Table 7), reinforcing the hypothesis of earnings management by income smoothing using securities, including the possibility of classification of securities in the available-for-sale category. The reasoning behind these models is that banks discretionarily increase the income from securities using subjectivity in the valua-tion or classificavalua-tion of the portfolio (available-for-sale) to increase (or decrease) profits in an attempt to avoid marked variations that can convey a perception of greater risk to the market.
Regarding the control variables, the results show that the larger-sized banks (lnTA) are less likely to adopt discretionary actions with respect to income from securities. This practice is more common among private banks. No significant differences were found with regard to the adoption of discretion in the measu-rement of securities among banks under the control of national or foreign capital.
The main conclusion from these tests is that Model (3.1), which was constructed to identify the discretio-nary portion of income from securities, is robust with respect to the identification of earnings management in a similar manner to the results for the one-stage mo-del - a method wimo-dely used in the literature to assess
income smoothing using securities.
4.4 Procedures to Ensure Robustness of the
Tests.
In addition to the unit root tests and the procedu-res used to minimize the risk of multicollinearity, other technical procedures were adopted to ensure the robus-tness of the results. To evaluate the existence of indi-vidual effects, which justifies the use of panel data, a test suggested by Baltagi (2008) was performed. This is the Chow test because of its similarity with the struc-tural break test. In line with the statistics incorporated in Tables 6, 7, and 8, the null hypothesis that the results calculated without considering individual heterogenei-ty were appropriate was rejected, demonstrating the importance of the use of panel data to provide eviden-ce with greater informational power when applying the models in question.
used. Moreover, according to Gujarati (2006), the basis of the random-effects model is that the errors are ran-dom extractions from a much larger population, which is not the case in the present study, which considers all banking institutions of interest.
Finally, despite the adoption of scaling of the variables
IncSEC, SEC, ΔSEC, (NP-IncSEC), and ΔEVA by total as-sets at the beginning of the period to minimize the risk of heteroskedasticity, and the fact that Durbin-Watson test statistics, highlighted in Tables 6, 7, and 8, fell within the "inconclusive" zone, the Panel Corrected Standard Errors (PCSE) method for cross-sectional fixed-effects of panel data was used as a precaution to generate robust results even in the presence of autocorrelation and heteroskedas-ticity in the residuals.
The adjusted goodness of fit coefficients (R2) of the
regressions, highlighted in Tables 6, 7, and 8, show that
Models (3.1), (3.2), and (3.3) explain 26.99%, 39.53%, and 13.38%, respectively, of the behavior of the corres-ponding dependent variables. It should be noted, ho-wever, that these results are not sufficient to compare the levels of determination of the one- and two-stage models adequately because the one-stage model, the results of which are summarized in Table 7, explains the total income from securities, whereas the two-stage model only isolates and assesses the determinants of the discretionary portion of the income from securi-ties, as shown in Table 8. It should also be emphasized that the contribution of the two-stage model does not necessarily lie in its superiority to a one-stage model but as a validated instrument that enables the resolu-tion of research problems that depend on the identi-fication of the discretionary portion of income from securities.
5 CONCLUSIONS
The present study was aimed at developing and validating a two-stage model for the identification of discretionary activity of accruals from securities by banking institutions. The development of the proposed model is based on the precepts of the few studies on the subject, the incorporation, by analogy, of the parame-ters used in two-stage models to identify discretiona-ry LLP in banks, the consideration of macroeconomic variables that may be involved in the evaluation of fi-nancial instruments, and the specific attributes of the securities portfolio of each bank.
The empirical procedures were focused on the va-lidation process of this model. For this purpose, the results are compared with those obtained using a one-stage model – aiming to strengthen the use of this type of methodology for the analysis of earnings manage-ment of securities in banks. As a reference, a model for identifying the practice of income smoothing is defined, taking into account that previous studies also identified this type of earnings management by Brazi-lian banking institutions.
The tests were performed using the financial state-ments of commercial banks, multiple-purpose banks, and savings banks from the third quarter of 2002 to the fourth quarter of 2010. Using the one-stage reference model, negative and significant relationships were con-firmed between income from securities and the follo-wing variables: profit before income from securities, which were consistent with the hypothesis identified in previous studies on the use of portfolio classification for the purpose of income smoothing; and the variation in the Equity Valuation Adjustment account, which ac-crues the variations in the value of securities classified as available-for-sale, indicating that banks use this type of classification in their managerial actions.
The proposed two-stage model was subsequently tested, isolating the discretionary portion of income from securities. The results show that the use of
discre-tion in income from securities is negatively related to profit before income from securities and with the va-riation in Equity Valuation Adjustments. Thus, the re-sults obtained with the developed model are consistent with those found with the reference model, i.e., they confirm that Brazilian banks use income from securi-ties for the purpose of income smoothing and that the classification of the available-for-sale portfolio is used in discretionary actions.
The main conclusion from the tests is that the mo-del constructed to identify the discretionary portion of income from securities is validated. This model is robust because it can identify earnings management in a similar manner to the one-stage model that was used as a reference.