Article
, Vol. 30, No. 1, 132-139, 2019Printed in Brazil - ©2019 Sociedade Brasileira de Química
*e-mail: [email protected]
Ultrasonic
Extracts
of
Morinda
citrifolia
L.:
Characterization
of
Volatile
Compounds
by
Gas
Chromatography-Mass
Spectrometry
DaianeB.M.Lima,aAnaíL.dosSantos,bArielO.Celestino,aNaynaSampaio,a JéssicaBaldez,aMariaI.S.Melecchi,cThiagoR.Bjerk,aLaízaC.Krausea,dand
ElinaB.Caramão *,a,b,d
aPrograma de Pós-Graduação em Biotecnologia Industrial (PBI), Universidade Tiradentes (UNIT),
Av. Murilo Dantas, 300, 49032-490 Aracaju-SE, Brazil
bPrograma de Pós-Graduação em Química (PPGQ), Universidade Federal do Rio Grande do Sul (UFRGS),
Av. Bento Gonçalves, 9500, 90040-060 Porto Alegre-RS, Brazil
cColégio Militar de Porto Alegre (CMPA), Av. José Bonifácio, 363, Farroupilha,
90040-130 Porto Alegre-RS, Brazil
dInstituto Nacional Ciência e Tecnologia em Energia e Ambiente (INCT E&A),
Universidade Federal da Bahia (UFBA), 40170-110 Salvador-BA, Brazil
Morinda citrifolia (noni) is found in the Atlantic and Amazonian Forest in Brazil and with recognized uses in folk medicine. However, few studies exist in its chemical characterization. The present work aims to investigate the efficiency of the sonication for extracting bioactive compounds from fruits and leaves of noni, using an experimental design of 23, whose variables were time,
temperature and mass of the plant. Parallel extractions were performed using two extraction solvents (hexane and ethanol) and the same experimental design. The compounds were identified by gas chromatography coupled to mass spectrometry. The independent variable was the mass yield and all the variables studied in the sonication process were significant (p < 0.05%) for the process. Ethanol was more effective than hexane and the leaves produced higher yield and diversity of compounds than fruits. Vitamin E (tocopherol), octanoic acid, hydroxymethylfurfural, phytol and squalene were the main compounds identified.
Keywords:Morinda citrifolia L., sonication, gas chromatography, GC-MS, tocopherols
Introduction
Morinda citrifolia Linn. (noni) is natural from Hawaii and Tahiti and belongs to the Rubiacea Juss. family. Noni has a pantropical distribution and a capacity of growth in several kinds of soils and in all seasons.1,2 More than
160 phytochemical compounds were already described as constituents of noni extracts (by maceration and Soxhlet).1-4
Phytochemical compounds are normally present in plants as secondary metabolites and they are responsible for plants growth and protection against oxidation and plagues.5
Many methodologies have been developed worldwide for characterizing different natural compounds aiming to identify and quantify the bioactive ones, indicating their application in food or phytomedicine.6-8 The amount and
quality of extracts are strongly associated to the extraction technique applied.
Sonication, or ultrasound-assisted extraction (UAE), is a physical procedure that uses the energy of ultrasound waves for producing variations on the liquid pressure, generating the cavitation process and promoting the extraction.9 UAE
is one of the most efficient extraction techniques due to its intense interaction between solid (plant) and liquid (solvent) phases.8-11 Sonication has some advantages over
other extraction techniques such as the low cost, simplicity, efficiency, reproducibility and the applicability for a high range of samples.8,10-12
The implosion of bubbles generated by cavitation releases heat and increases turbulence on the liquid, causing the disruption of the plant cells, allowing the diffusion of the solvent into the matrix. Therefore, this process increases the solubility of the analytes, which will also enhance the
Ultrasonic
Extracts
of
Morinda
citrifolia
L.:
Characterization
of
Volatile
Compounds
by
Gas
Chromatography-Mass
Spectrometry
DaianeB.M.Lima,aAnaíL.dosSantos,bArielO.Celestino,aNaynaSampaio,a JéssicaBaldez,aMariaI.S.Melecchi,cThiagoR.Bjerk,aLaízaC.Krausea,dand
extraction efficiency.13,14 The extracts are normally analyzed
by gas chromatography-mass spectrometry (GC-MS).8,15
Among the phytotherapeutic effects of noni, it is possible to highlight the anti-inflammatory, analgesic and diuretic activities. In addition, noni contains vitamins C and E in amounts similar to papaya, acerola, cashew and pineapple.16
However, it is important to cite that ANVISA (Brazilian Company of Sanitary Vigilance)17 does not indicate the use
of noni for food purposes due to the few scientific studies presented in literature, clearly demonstrating the need of its total characterization.
Many chemical compounds normally found in noni are acids (octanoic, decanoic, ursolic, linoleic), vitamins (C and E), anthraquinone derivatives (nordamnacanthal, morindone, rubiadin and rubiadin-1-methyl ether), terpenoids, amino acids, alkaloids, carotenoids, flavone and anthraquinone glycosides, γ-sitosterol, scopoletin, alizarin, acubine,
L-asperulose, rutin and proxeronine.3,6,18 Some quantitative
differences between the identified compounds may be related to the different environmental conditions of their growth, such as temperature, precipitation, sunlight and soil quality proving that its composition is seasonally dependent.18
The objective of this study is to evaluate the chemical composition of volatile compounds in sonication extracts of fruits and leaves of Morinda citrifolia Linn.,looking for substances that could be used for medicinal purposes.
Experimental
Materials
The leaves and fruits of Morinda citrifolia Linn. were collected in the vegetative and reproductive period on a rural property, in the city of São Cristovão, Sergipe, Brazil, according to the geographic coordinates: latitude 10°88’39.26”S and longitude 37°20’92.87”W, at an elevation of 37 m.
Dr Marla Ibrahim Uehbe de Oliveira, from the Botany Department of UNIT (Universidade Tiradentes), Aracaju (SE, Brazil) identified the plant and it received the No. 835 in the Tiradentes-AJU Herbarium. Leaves and fruits (mesocarp, epicarp and seeds), were lyophilized, cut into small pieces and stored at low temperature for analysis.
Ethanol and hexane were analytical grade purchased from Merck (Dashmund, Germany). Helium (ultrapure, 99.999%) was acquired from White Martins (Aracaju, SE, Brazil). The standards (n-alkanes) (from C7 to C30) used for retention indices determination were purchased from Sigma-Aldrich (Sigma-Aldrich Brazil, São Paulo, SP, Brazil).
The lyophilization of the leaves and fruits of Morinda citrifolia L. was carried out using a Liobras brand equipment, model Liotop L101, São Carlos, Brazil.
Sonication extraction
Sonication was performed using an ultrasonic bath (model US1450A, at 40 kHz and 135 W, UNIQUE, São Paulo, Brazil) with the dimensions of 24 × 13.7 × 10 cm. It was used an experimental design 23 with three variables in
two levels using a central point for repeatability calculations for each solvent extract (hexane and ethanol). To perform the experiments, reflux condenser were connected to 250 mL Erlenmeyer to prevent the loss of volatile compounds during the experiment. Each extract was filtered and the solvents evaporated to calculate the mass yield, which was used as the dependent variable of the planning.19
The independent variables were time of extraction (50 and 100 min), temperature of extraction (25 and 55 °C) and mass of sample (1 and 3 g) using the same volume of solvent (80 mL). The full factorial design was composed by 3 factors, 11 runs, 1 replicate and 3 central points (for repeatability determination). All data were analyzed using the StatisticaTM software.
Chromatographic analyzes
The extracts with the higher sonication yields were analyzed by gas chromatography coupled to quadrupole mass spectrometry detector (GC-qMS) on a Shimadzu equipment, model QP5050-A (Kyoto, Japan), using a DB-5 capillary column (60 m length, 0.25 mm internal diameter and 0.25 µm phase thickness). The injection was performed in split mode (1:40), using helium (ultrapure, 99.999%, White Martins, Aracaju, SE, Brazil) as the carrier gas at flow rate of 1.5 mL min-1. The oven was
heated from 100 to 300 °C at 10 °C min-1, remaining
45 min in the final temperature. Injector and detector were kept at 300 °C.
Retention times, mass spectra and retention indices calculated according to Van Den Dool and Kratz20 for
linear temperature programming (LTPRI) were used to identify the compounds. They were only identified when these three data were concordant. In order to compare the retention indices, the data from the online library of NIST-WEB-BOOK21 were used. The software
Results and Discussion
Mass yield
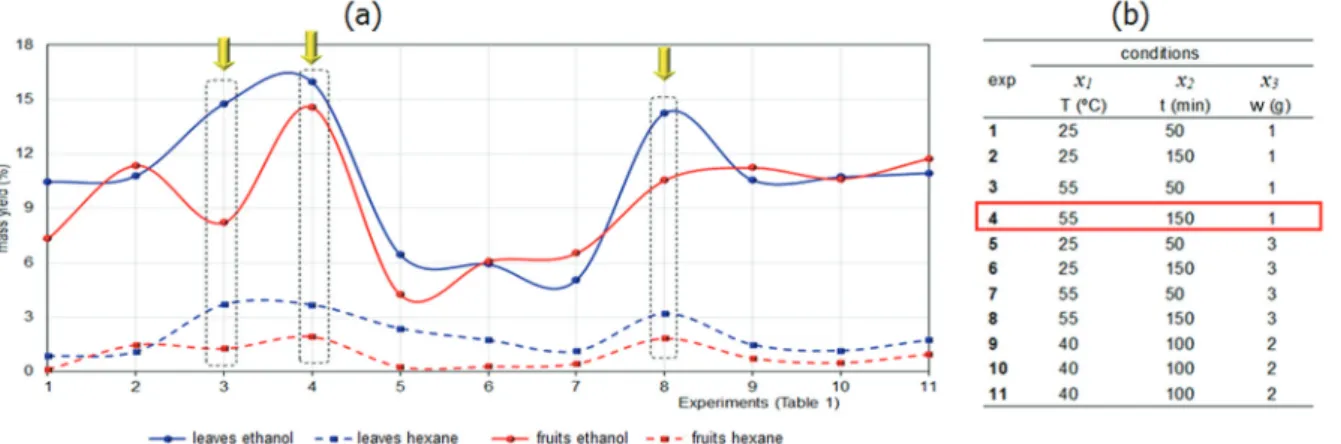
Figure 1 shows the result of the full factorial design applied in this study, with codified values for independent variables and using the mass yield (%) as the dependent variable. Figure 1a shows the graphic distribution of the yields and in Figure 1b it is shown the description of the variables that compose the factorial design using two levels (+1; –1) and three factors (time, temperature and mass/solvent ratio), comprising 8 experiments and 3 times the central point (experiments 9, 10 and 11).
From Figure 1 it is possible to observe that three experiments show higher yields (experiments 3, 4 and 8), which are highlighted in the four conditions used (leaves, fruits and with both extraction solvents). In general, ethanol was considered a better solvent, yielding higher amount of extract than hexane, both for leaves and fruits, as already found in the literature.8 According to Sticher,22
using non-polar solvents (such as hexane), more lipophilic compounds are obtained, while polar solvents as alcohols provide an extract with a broad spectrum of polar and non-polar substances, increasing the yield of extraction.
The yields for the leaves extracts were slightly higher than those obtained for the fruits, considering both solvents. The repeatability of the process was tested with experiments 9, 10 and 11 (central point of the factorial design), finding good results, with standard deviations ranging from 1.8 to 32%, and the lowest values of standard deviation were found for ethanol that had significantly higher yields than hexane.
The high standard deviation obtained for the fruits extraction with hexane (32%) is probably related to the sugar content that can mask the final mass. In this case, sugars have low affinity to hexane, but they may
be dragged during extraction, masking the final yield obtained.
The greater is the contact surface with the solid matrix, the more complete is the extraction and the solvent selectivity. The obtained yield variation can be considered relatively satisfactory for extraction of real and complex samples as plant extracts.23
Moreover, the fruits (which presented greater variation when compared to leaves) presented hydrophilic compounds (like sugars), which cannot be totally extracted with this process, and they can also cause variation in the yield.24
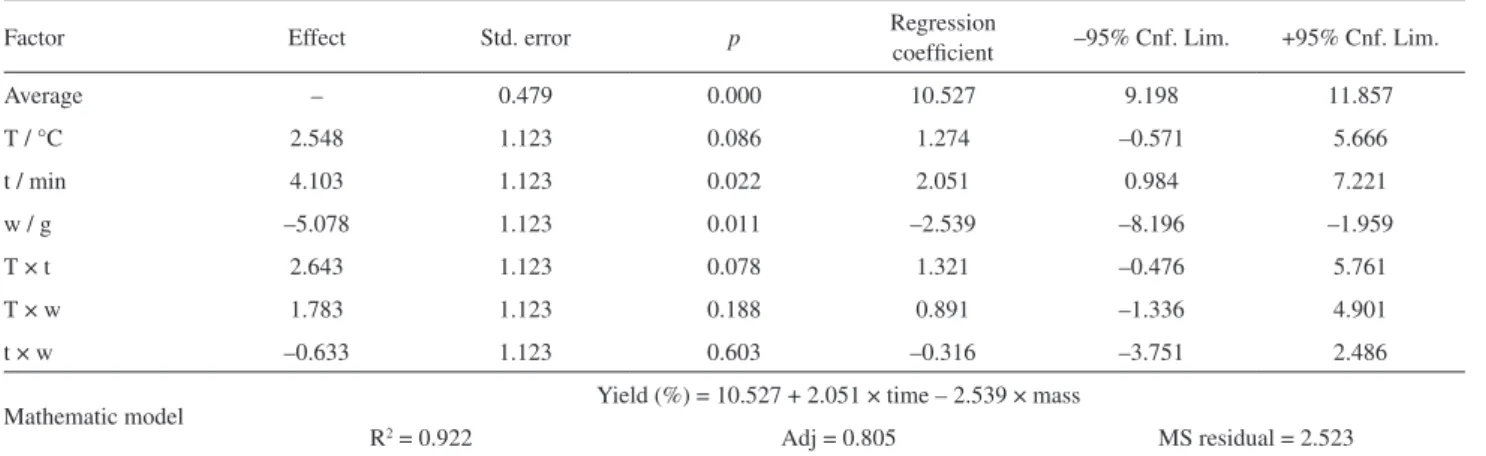
Aiming to perform analysis of the effects of each variable in the extraction procedure, experiment 4 (Figure 1) for leaves extracted with ethanol, which presented the best yield, was submitted to a statistical treatment using the software Statistica 7, with a confidence level of 95%, as can be seen in Table 1.
This result shows that time and mass were the independent variables that influenced to a greater degree the yield of the process. The proposed equation for the mathematical model showed to be adjusted and statistically significant, meaning that this regression model provides a good explanation on the relationship between the independent variables and the mass yield (dependent variable) at the expected confidence level.
The data of the analysis of variance (ANOVA) (Table 2 and Figure 2a) and the Pareto chart (Figure 2b) confirm the applicability of the model and the adjusted equation, guaranteeing the significance of the variables time and mass in obtaining an improvement in the yield of the sonication. Moreover, it was verified by F test that the model explains a significant variation in the data obtained by the simulation, once it is observed that the F value is slightly higher than the tabled value, at a 95% confidence level.
The time (t) and weight (w) variables presented positive effects, while the temperature (T) had a negative effect. The
Figure1. Comparison between the mass yields obtained according to the experimental design applied to the ultrasonic extraction of leaves and fruits of
first effect can be easily understood because an increase in time causes an increase in the possibility of interaction between the molecules and the solvent, facilitating the extraction. The temperature did not influence positively, due to the possible saturation of the solvent reducing its capacity of extraction above a certain temperature.25-28
In the Supplementary Information (SI), it is possible to observe the response surface graph (Figure S1), indicating the yield behavior as the variables are changed, confirming the conclusions presented in this study.
GC-qMS analysis
The experiment 4, highlighted in Figure 1, was used for detailed GC-qMS. The other experiments were also chromatographed and their profiles were very poor or, in some cases, similar to those of experiment 4, which is why they will not be discussed in this work. It is important to clarify that only the volatile compounds will be analyzed due to the use of only GC analysis. The non-volatile compounds will be object of another work using high-performance liquid chromatography (HPLC).
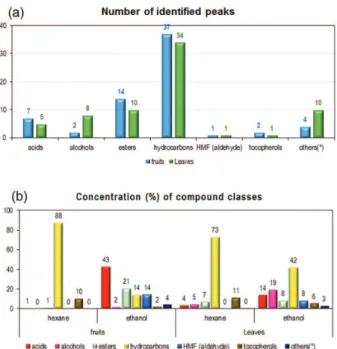
Figure 3 shows the profile of the GC-MS chromatograms of these extracts for leaves and fruits, with hexane (Figures 3a and 3b) and ethanol (Figures 3c and 3d). Figure 4 shows the distribution of the chemical classes Table1. Estimative of the effects of the study of the variables in the experiments using noni leaves and ethanol as solvent extractor and its mathematical model (significant variables)
Factor Effect Std. error p Regression
coefficient –95% Cnf. Lim. +95% Cnf. Lim.
Average – 0.479 0.000 10.527 9.198 11.857
T / °C 2.548 1.123 0.086 1.274 –0.571 5.666
t / min 4.103 1.123 0.022 2.051 0.984 7.221
w / g –5.078 1.123 0.011 –2.539 –8.196 –1.959
T × t 2.643 1.123 0.078 1.321 –0.476 5.761
T × w 1.783 1.123 0.188 0.891 –1.336 4.901
t × w –0.633 1.123 0.603 –0.316 –3.751 2.486
Mathematic model Yield (%) = 10.527 + 2.051 × time – 2.539 × mass
R2 = 0.922 Adj = 0.805 MS residual = 2.523
Std. error: standard error; p: significance level; Cnf. Lim.: confidence limit; T: temperature; t: time; w: weight; R2: determination coefficient; Adj: average value.
Table2. Analysis of variance (ANOVA) for the experiments involving the extraction of the noni leaves with ethanol
Factor SS DF AS Fcalculated Ftabled p value
Regression 85.223 6 14.21 6.282 6.163 < 0.001
Residue 9.049 4 2.262
Total 129.415 10 –
SS: sum of squares; DF: degrees of freedom; AS: average squares.
considering the relative area of chromatographic peaks in the extracts while the identification of the peaks can be observed in Tables S1 and S2 (SI section). Table S3, also in the SI section, shows distribution of the compounds in the chromatographically analyzed samples according to the predominant chemical class (according to Figure 4).
About 69 compounds were identified in the extracts (from leaves and fruits) using GC-qMS and comparing mass spectra and retention indexes (LPTRI) with the data on the online NIST library.
Through the analysis of Figure 4 (and Table S3, SI section), a qualitative and semi-quantitative comparison can
be made between the main classes of compounds extracted. The major chemical classes of compounds identified were esters, alcohols, acids, aldehydes and hydrocarbons.
It can be observed the significant presence of hydrocarbons (from 14.45 to 87.56%, corresponding to 37 peaks in the fruit extracts and 34 peaks in leaf extracts). The presence of hydrocarbons is higher in the hexane extracts, being justified by the non-polarity of the solvent. The tocopherols (among them, vitamin E) were also found in the hexane extracts (10.41% in the fruit extract and 11.41% in the leaves extracts). Another important difference between the extracts is the content of acids and
esters, which are high in ethanolic extracts (about 63% in fruits and about 22% in leaves). The presence of these acids and esters is due to the greater extractive power of ethanol for polar compounds. Figure 5 shows the distribution of the major compounds in each sample (concentration greater than 3%).
In the extracts using hexane, about 15% of squalene was obtained. This analysis indicates the influence of both the extractor solvent and the experimental conditions used. The hexane proved to be a more suitable solvent for the extraction of squalene and derivatives, whereas ethanol was more efficient for furfural and derivatives. Different
solvents can lead to different products and indicate different applications for the extracts.
Comparing the data from Figure 5a with the literature, we found that several authors28-31 have also performed leaf
extractions and obtained slightly different compounds from those identified in this study, such as alanine, scopoletin and leucine.
The compounds identified in the fruits of noni (Figure 5b) present some similar characteristics with the compounds analyzed in the leaves, but no alcohols were identified, which were present in about 7% of the total composition of the extracted leaves. Shami32 analyzed methanol extracts
via GC-MS and obtained the acids 1-butanoic (19.06%), butyric (8.49%), propanoic (14.85%) and carbamimidic (6.03%), beside others like N-acetylisoxazolidine (10.15%), 1,3-propanediol (6.61%), 4,5-octanediol (2.22%), 1,3-oxazine (0.64%) and semicarbazone (0.64%). Pino et al.33 analyzed the fruit in different stages, identified and
isolated two main compounds (octanoic acid and hexanoic acid), through the solid phase microextraction (SPME) technique via headspace.
The hexane extract showed the highest percentage of vitamin E (7.7%) and a distribution of various hydrocarbons in concentrations ranging from 3 to 8%, totaling 70.4% of the total area. Hexane was the most suitable solvent for the extraction of vitamin E, while ethanol was more efficient for acidic compounds (octanoic acid, 25%), confirming the previous statement about the influence of the extracting solvent on the quality of the obtained extract.
In addition to these compounds, the most important in the leaves was the hydroxymethylfurfural (HMF) and the octanoic acid in the fruits. In literature studies, other compounds were found in extracts of fruits of noni, such as anhydrous sugars, ascorbic acid and rubiadin. None of Figure 4. Comparison between chemical classes of extracted compounds
using both solvents (hexane and ethanol): (a) total number of peaks for leaf and fruit samples; (b) composition (% m/m) of extracts from leaves and from fruits.
these compounds were found in this study.1,30,32,34,35 These
compounds are more correctly analyzed by HPLC than GC, which is why they were probably not detected in this work. Potterat and Hamburger2 analyzed extracts of fruits of
noni by HPLC-MS and identified 3-methyl-1, 3-butanediol, scopoletin, iridoid glucosides, anthraquinones, rutin, and glycosides of fatty acids. Phenolic compounds have also been an important group of functional micronutrients found in noni juice, such as damnacanthal, scopoletin, morindone, alizarin, rubiadin and rubiadin-1-methyl ether, all analyzed by HPLC.36
Conclusions
The samples were subjected to ultrasonic extraction using two solvents and analyzed by GC-MS. Different profiles were found between the extracts as much by the difference between the solvents (hexane and ethanol) as by the difference of the matrix (leaves and fruits). In the leaves, the hydrocarbons predominated, while more polar compounds were found in the fruits. The high standard deviation obtained during the fruit extraction process was associated to the influence of its high sugar content, since the behavior was not observed in the leaf samples. The extraction with hexane was selective for hydrocarbons and vitamin E in both samples, while ethanol was more efficient for fatty acids.
The major compounds found were octanoic acid, vitamin E, phytol, squalene and hydroxymethylfurfural. All these substances have great application potential, either as phytochemicals or in food industry.
The sequence of this work will be the complete characterization of the extracts by HPLC, aiming to determine the content of polyphenols and other compounds not detectable by GC-MS.
Supplementary Information
Supplementary data are available free of charge at http://jbcs.sbq.org.br as PDF file.
Acknowledgments
The authors thank to CNPq, FAPITEC and CAPES for financial support.
References
1. Nelson, S. C.; Elevitch, C. R.; Noni: The Complete Guide for
Consumers and Growers; Permanent Agriculture Resources:
Holualoa, Hawaii, USA,2006, p. 13.
2. Potterat, O.; Hamburger, M.; Planta Med. 2007, 73, 191. 3. Satwadhar, P. N.; Deshpande, H. W.; Syed, I. H.; Syed, K. A.;
Food Chem. 2011, 52, 5843.
4. Souza, A.; Alves, M. G.; dos Santos, D. S.; Brito, J.; Food Sci.
Technol. 2010, 30, 641.
5. Miron, T. L.; Plaza, M.; Bahrim, G.; Ibánez, E.; Herrero, M.;
J. Chromatogr. A 2011, 1218, 4918.
6. Chan-Blanco, Y.; Vaillant, F.; Mercedes-Perez, A.; Reynes, M.; Brillouet, J.-M.; Brat, P.; J. Food Compos. Anal. 2006, 19, 645. 7. Azmir, J.; Zaidul, I. S. M.; Rahman, M. M.; Sharif, K. M.;
Mohamed, A.; Sahena, F.; Omar, A. K. M.; J. Food Eng. 2013,
117, 426.
8. Melecchi, M. I. S.; Martinez, M. M.; Abad, F. C.; Zini, P. P.; Nascimento Filho, I.; Caramão, E. B.; J. Sep. Sci. 2002, 25, 86. 9. Sun, Y.; Liu, Z.; Wang, J.; Sep. Purif. Technol. 2011, 78, 49. 10. Jacques, R. A.; Oliveira, A. P.; Freitas, L. S.; Caramão, E. B.;
Oliveira, J. V.; Dariva, C.; Ultrason. Sonochem. 2007, 14, 6. 11. Péres, V. F.; Jacques, R. A.; Saffi, J.; Melecchi, M. I. S.; Abad,
F. C.; Martinez, M. M.; Oliveira, E. C.; Caramão, E. B.;
J. Chromatogr. A 2006, 1105, 115.
12. Bimakr, M.; Rahman, R. A.; Taip, F. S.; Ganjloo, A.; Salleh, L. M.; Selamat, J.; Hamid, A.; Zaidul, I. S. M.; Food Bioprod.
Process. 2011, 89, 67.
13. Wang, J.; Sun, B.; Cao, Y.; Tian, Y.; Li, X.; Food Chem. 2013,
106, 804.
14. Carrera, C.; Rodríguez, A. J.; Palma, M.; Barroso, C. G.; Anal.
Chim. Acta 2012, 732, 100.
15. Khoddami, A.; Wilkes, M. A.; Roberts, T. H.; Molecules 2013,
18, 2328.
16. Silva, L. R.; Medeiros, P. V. Q.; Leite, A. G.; Silva, K. J. P.; Mendonça, C. V.; Silva, C. G. G.; Rev. Cubana Plant. Med.
2012, 17, 93.
17. http://portal.anvisa.gov.br/documents/33916/388729/Informe +T%C3%A9cnico+n.+25%2C+de+maio+de+2007/f1652e84-4529-4844-9c82-9d0f889e1fd0, accessed on August 17, 2018. 18. Torres, M. A. O.; Braga, F. M. I.; Oliveira, R.; Sá, J. C.; Rocha,
A. L.; Silva, A. L.; Phytother. Res. 2017, 31, 971.
19. Oliveira, R. C.; Barros, S. T. D.; Gimenes, M. L.; J. Food Eng.
2013, 117, 458.
20. Van Den Dool, H.; Kratz, D. J.; J. Chromatogr. 1963, 11, 463. 21. http://webbook.nist.gov/cgi/cbook.cgi?ID=C56554348&Units
=SI&Mask=2000, accessed in April 02, 2018. 22. Sticher, O.; Nat. Prod. Rep. 2008, 25, 517.
23. Tiwari, P. B.; Kumar, M.; Kaur, G.; Kaur, K.; Sci. Pharm. 2011,
1, 98.
24. Chemat, S.; Lagha, A.; Aitamar, H.; Bartels, P. V.; Chemat, F.;
Flavour Frag. J. 2004, 19, 188.
25. Corbin, C.; Fidel, T.; Leclerc, E. A.; Barakzoy, E.; Sagot, N.; Falguiéres, A.; Renouard, S.; Blondeau, J. P.; Ferroud, C.; Doussot, J.; Lainé, E.; Hano, C.; Ultrason. Sonochem. 2015,
26. Wang, J.; Sun, B.; Cao, Y.; Tian, Y.; Li, X.; Food Chem. 2008,
106, 804.
27. Ghafoor, K.; Choi, H. C.; Jeon, J. Y.; Jo, I. H.; J. Agric. Food
Chem. 2009, 57, 4988.
28. González-Centeno, M. R.; Comas-Serra, F.; Femenia, A.; Rosselló, C.; Simal, S.; Ultrason. Sonochem. 2015, 22, 506. 29. Sang, S.; Wang, M.; He, K.; Liu, G.; Dong, Z.; Badmaev, V.;
Zheng, Q. Y.; Ghai, G.; Rosen, R. T.; Ho, C.-T. In Quality
Management of Nutraceuticals, ACS Symposium Series, vol.
803; Ho, C.-T.; Zheng, Q. Y., eds.; American Chemical Society: Washington, DC, USA,2001, ch. 10.
30. Kamiya, K.; Tanaka, Y.; Endang, H.; Umar, M.; Satake, T.; Food
Chem. 2010, 118, 725.
31. Ross, I. A.; Medicinal Plants of the World: Chemical
Constituents, Traditional and Modern Medicinal Uses, vol. 2;
Humana Press: New York, 2001, ch. 16. 32. Shami, A. M. M.; AASCIT J. Biol. 2015, 1, 75.
33. Pino, J. A.; Marquez, E.; Quijano, C. E.; Castro, D.; Food Sci.
Technol. 2010, 31, 183.
34. Zin, M. Z.; Abdul, H. A.; Osman, A.; Food Chem. 2002, 78, 227.
35. Lin, Y. L.; Chang, Y. Y.; Yang, D. J.; Tzang, B. S.; Chen, Y. C.;
Food Chem. 2013, 140, 31.
36. Dittmar, A.; J. Herbs, Spices Med. Plants 1993, 1, 77.
Submitted: April 11, 2018
Published online: August 22, 2018