ISSN 0101-2061 Food Science and Technology
DI:
D http://dx.doi.org/10.1590/1678-457X.19216
1 Introduction
Aroma is the most important factor to assess the quality of coffee, as well as the main aspect of consumers’ choice (Farah et al., 2006). Coffea arabica is often the subject of commercial falsification because of the economic factors.
Coffea arabica is often mixed with beans of coffees that are less expensive, such as Coffea canephora, but still labeled as “100% Arabica” or “Highland coffee” and often sold at the same price as real Arabica (Schievano et al., 2014). Most consumers are not experienced enough to recognize the difference between a 100% Arabica and an admixture of Robusta.
Coffea arabica has a mild aroma, whereas Coffea canephora
- raw and earthy. There is a price difference between the above-mentioned types of coffee on the global market. The average price of Arabica on the US market in February was 179.94 cents per pound (IndexMundi, 2016a), while the price of Robusta was 103.74 cents per pound (IndexMundi, 2016b).
The sensory aroma profile is very important in indicating the authenticity of Coffea arabica. The basic taste sensations in coffee are formed by volatile compounds present in coffee beans. They are the main factors responsible for the aroma. They belong to various chemical groups: aliphatic hydrocarbons, sulfur compounds, pyrazines, pyridines, oxazoles, pyrroles, furans, aldehydes, ketones and phenols (Freitas & Mosca, 1999; Buffo & Cardelli-Freire, 2004; Bröhan et al., 2009; Rodriguez et al., 2010) but only a relatively small group of them (called the key
components) is responsible for the aroma of coffee, such as dimethyl disulfide, which is an essential element for improving the fragrance of coffee aroma (Huang et al., 2007; Bröhan et al., 2009). Dptimal climate conditions are important during the grow, flowering and ripening of the coffee fruit. The optimal climate conditions make impact on quantity and quality of volatile compounds and have some extent on shaping of the smell of coffee (Wrigley, 1988; Destreich-Janzen, 2013). The production of high quality coffee depends on many factors i.e.: a variety of genetic, an environmental conditions, a brewing methods and management (agronomic and after harvesting) and a degree of roasting and grinding coffee. The environmental factors – a geographical location, a soil type, a time of harvesting coffee berry, a species of coffee, a type of collection, a climatic conditions, a fertilizing, have a large extent of impact on the profile of volatile compounds in coffee (Wintgens, 2004; Bosselmann et al., 2009; Bhumiratana et al., 2011; Sunarharum et al., 2014). Coffea arabica
and Coffea canephora differ in chemical composition as well as the occurrence of volatile compounds and, as a consequence, in aroma.
Volatile compounds found in coffee can be detected by using various methods, including the solid phase microextraction (SPME), the headspeace and the GC/MS methods. These methods are time-consuming, labour-intensive and costly but this methods are very popular for the identify volatile compounds in foodstuffs. Therefore, there is a need to establish new methods that are fast,
Volatile compounds profiles in unroasted
Coffea arabica
and
Coffea canephora
beans
from different countries
Daniel KNYSAK1*
Received 25 July, 2016 Accepted 28 Apr., 2017
1Department of Technique and Food Development, Faculty of Human Nutrition and Consumer Sciences, Warsaw University of Life Sciences, Warsaw, Poland
*Corresponding author: [email protected]
Abstract
Aroma is the most important factor in assessing the quality of coffee. The volatile compounds profile could be very important to confirm the authenticity of Coffea arabica. The study was carried out on two species of unroasted coffee beans: Coffea arabica from Colombia and Nepal and Coffea robusta from Uganda and Vietnam. Both Coffea arabica and Coffea canephora were imported to the country of analysis approximately 5 months prior to the research. Before the analysis, the coffee beans were kept in a sealed, dark container, at 21 °C. The tests were performed using an electronic nose. Its functioning is based on gas chromatography with two columns of different polarities in parallel and with 2 ultra sensitive Flame Ionization Detectors (FID). With multivariate statistics – Principal Components Analysis – it was possible to reduce the number of links and present them in two dimensions, which allowed for the unambiguous identification and assignment of samples to a particular species of coffee. By using an electronic nose, one can distinguish and group unroasted coffee beans’ flavours depending on the country of origin and species.
Keywords: volatile compounds profiles; coffee; Coffea Arabica; Coffea canephora.
chemistry-free and non-invasive. The electronic nose (e-nose) instrument is less expensive, precise, giving rapid results in short response time. It is a good gear to identify, typify and classify foodstuffs aromas (Wilson & Baietto, 2009; Suslick et al., 2010; Rodriguez et al., 2010; Baietto & Wilson, 2015). It consists of a sensor assembly (part of the receptor). These receptors have a limited selectivity and react to the presence of large amounts of compounds which are changing in their physicochemical properties recorded by the transducers. It identifies compounds in the mixture and analyses the main components based on the retention time of volatile compounds profile of samples. Moreover, as in the case of human nose, it gives an overall perception (Shilbayeh & Iskandarani, 2004; Win, 2005; Cho & Kang, 2011; Baietto & Wilson, 2015). For quick interpretation of a volatile pattern the data collected must be combined with chemometric analysis which deals with obtaining multi-dimensional data from the measuring system using both methods: statistical analysis and mathematics. Based on the analysis of coffee volatile compounds and the results obtained through the PCA method, it is possible to classify different samples of coffee in terms of substances present in samples and indicate the substances allowing us to recognize different samples of coffee. Electronic nose performs measurements that allow qualitative and quantitative analysis of volatile compounds in real time. It creates digital fingerprints odors. It is an instrument which allows thorough analysis of mixtures of volatile compounds in various foodstuffs. With it is possible to analyze and control the quality of food (Suslick et al., 2010; Cho & Kang, 2011; Wilson, 2013).
The aim of the paper was to analyse the possibility of using the electronic nose as a quick tool to detect the difference between coffee beans compounds and distinguish two species of coffee.
2 Materials and methods
The study was carried out on two species of unroasted coffee beans: Coffea arabica and Coffea robusta with different places of origin: Arabica from Colombia and Nepal and Robusta from Uganda and Vietnam. Both Coffea arabica and Coffea canephora were imported to Poland approximately 5 months prior to the research. Before the analysis, the coffee beans were kept in a sealed, dark container at 21 °C. Samples were prepared immediately after opening the container.
The device used for the analysis and identification of volatile compounds was an electronic nose with Ultra Fast GC (ultra-fast gas chromatography), the Heracles II (Alpha MDS, Toluse, France). The system was equipped with a trap to pre-concentration of light volatile compounds, like the SPME. It consists of two
columns of different polarities in parallel DB-5 and CD-1701 (10 m x 0.18 mm x 0.4 μm; Restek, Munich, Germany) and coupled with two Flame Ionization Detectors (FID).
Approximately 3 grams of coffee beans were weighed into each vial, sealed with a silicon-teflon septum soon afterwards. All samples were placed on a tray with blanks (empty/control vials). The study was repeated 3 times for each type of coffee. The initial temperature was 40 °C, while the initial isothermal was 5 seconds and the acquisition time was 93 seconds. The temperature control was following at 80 °C in 300 seconds. Injection volume was 1000 µL, the rate of 125 mL/s and the injection temperature was 200 °C. The calibration method was described in the previous studies (Brodowska et al., 2016; Wojtasik-Kalinowska et al., 2016).
Principal Components Analysis (PCA) is a statistical method that enables the analysis of multidimensional sets of results. This method was used to analyse data due to the possibility of reducing the number of variables and present them in a space of two or three dimensions. Alpha Soft (v. 8.0) software was used for data processing.
3 Results and discussion
The study included two different species of unroasted coffee originating from four different countries. C. arabica was from Colombia and Nepal and C. canephora was from Uganda and Vietnam. It is significant differences between the two types of coffee. Volatile compounds tentatively identified in C.
arabica from Nepal and Colombia are shown in Tables 1 and 2. These countries have different location above sea level, climate, annual precipitation and temperature. Such conditions have an impact on growth, flowering, the way of harvesting coffee as well as on the formation of different volatile compounds in coffee. The volatile compounds tentatively identified in coffee samples proved to be different. The only common feature of both species of coffee is one sensory descriptor but it is represented by various chemical compounds.
Table 3 and 4 present the results for Coffea canephora from Uganda and Vietnam, characterised by earthy and fruity / fresh smell. They have two common compounds: 2-methylpentanal and methyl hexanoate (Table 3 and 4). Methyl hexanoate was tentatively identified also in our study of Coffea arabica from Colombia (Table 2).
In our study propanal was tentatively identified in Coffea arabica from Nepal (Table 1). Propanal was identified by Yeretzian et al. (2002) in green coffee and in green robusta coffee by Nebesny et al. (2007).
Table 1. Volatile compounds marked in green beans Coffea arabica from Nepal.
Retention time/Kovacs1
Retention
time/Kovacs2 Peak heights/area Name of compounds Empirical formula Relevance index
Analytical Standards RT3/KRI4
17.53 (452) 18.31 (558) 726.41/284.81 propanal C3H6D 78.50 RT
31.82 (700) 34.65 (799) 180.91/98.44 pentan-2-ol C5H12D 88.18 RT
48.73 (910) 49.01 (1001) 434.83/249.65 2,3-dimethylpyrazine C6H8N2 57.54 KRI
49.84 (927) 49.01 (1001) 359.72/152.08 ethylpyrazine C6H8N2 84.94 KRI
57.64 (1048) 59.27 (1186) 134.18/66.42 benzene acetaldehyde C8H8D 80.90 RT
Pentan-2-ol was marked in green Arabica coffee beans in the study by Bertrand et al. (2012). 2,3-dimethylpyrazine, which was tentatively identified in our study in Coffea arabica from Nepal, was marked in the study by Nebesny et al. (2007), in brewed coffee (Dchiai et al., 2014), roasted coffee (Toci & Farah, 2008) and extracts of coffee (Coffea arabica) (Cheong et al., 2013).
The apparent presence of benzene acetaldehyde and ethylpyrazine in Coffea arabica from Nepal in our study is consistent with the results of the study by Vitzthum (1976), who documented the presence of these compounds in green coffee (Flament & Bessière-Thomas, 2002). Beznene acetaldehyde (Phenylacetaldehyde) was also marked in green coffee beans in the study by Cantergiani et al. (2001), Yeretzian et al. (2002) and in green coffee beans (Coffea arabica) from Hawaii (Lee & Shibamoto, 2002). Also Fisk et al. (2012) found these compounds in their study of roasted and ground coffee and Mestdagh et al. (2014) in coffee beverage. Ethylopyrazine (2-Ethylopyrazine) was identified by Nebesny et al. (2007) in green robusta coffee and in roasted coffee in the study by Toci & Farah (2008).
2-methylpropanoic acid (isobutanoic acid) was marked in green coffee beans in the study by Yeretzian et al. (2002) and in green Mexican coffee by Cantergiani at al. (2001); methyl hexanoate
(Hexanoic acid) (Table 2, 3 and 4) was marked in green coffee by Cantergiani at al. (2001), Yeretzian et al. (2002), by Toci & Farah (2008) in black-immature coffee beans and by Bertrand et al. (2012) in green Arabica coffee beans. 2-propionylpyrrole (1H-Pyrrole) was found in roasted coffee (Toci & Farah, 2008), in green Mexican coffee (Cantergiani et al., 2001) and in black coffee beans (Agresti et al., 2008). Dimethyl trisulfide marked in our study by the e-nose was also shown in the study by Blank (2002) in roasted and ground coffee and in roasted coffee by Michishita et al. (2010).
4-Methoxy-2-methyl-2-mercaptobutane (Table 3) was identified by Kumazawa & Masuda (1999) in green tea.
2-furanmethanol, tentatively identified in Coffea canephora
in our study (Table 4), is consistent with the results of the study by Nebesny et al. (2007) and Bertrand et al. (2012); maltol in roasted coffee, Robusta, was found by Silwar & Lüllmann (1993) and 1-heptanol was identified by Gutmann et al. (1979) in green coffee beans. Methional was found by Semmelroch & Grosch (1995) in roasted coffee powders and brews (Arabica and Robusta) and by Buffo & Cardelli-Freire (2004) in roasted ground Arabica coffee (Flament & Bessière-Thomas, 2002).
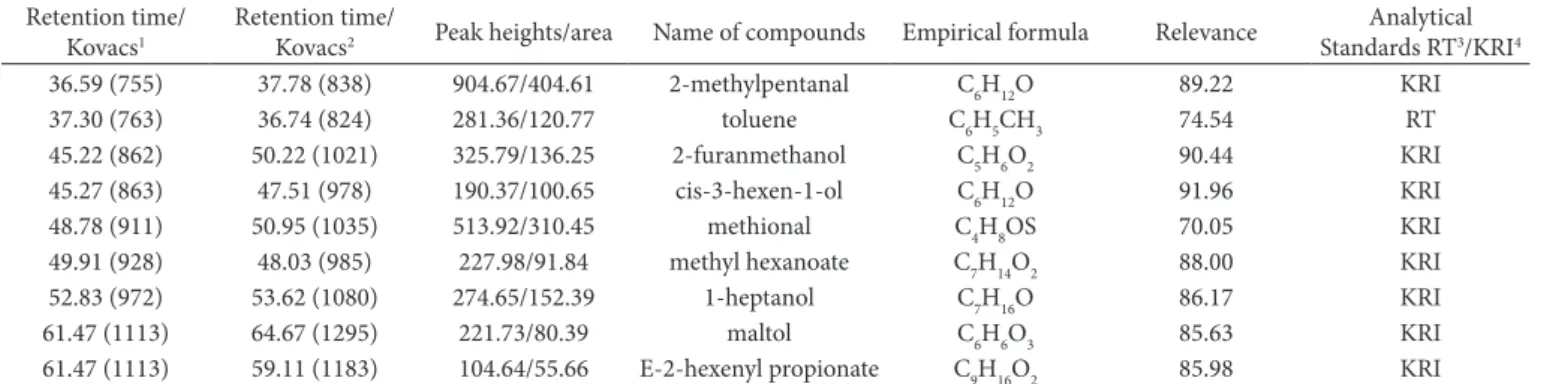
Table 4. Volatile compounds marked in green beans Coffea robusta from Vietnam.
Retention time/ Kovacs1
Retention time/
Kovacs2 Peak heights/area Name of compounds Empirical formula Relevance
Analytical Standards RT3/KRI4
36.59 (755) 37.78 (838) 904.67/404.61 2-methylpentanal C6H12D 89.22 KRI
37.30 (763) 36.74 (824) 281.36/120.77 toluene C6H5CH3 74.54 RT
45.22 (862) 50.22 (1021) 325.79/136.25 2-furanmethanol C5H6D2 90.44 KRI
45.27 (863) 47.51 (978) 190.37/100.65 cis-3-hexen-1-ol C6H12D 91.96 KRI
48.78 (911) 50.95 (1035) 513.92/310.45 methional C4H8DS 70.05 KRI
49.91 (928) 48.03 (985) 227.98/91.84 methyl hexanoate C7H14D2 88.00 KRI
52.83 (972) 53.62 (1080) 274.65/152.39 1-heptanol C7H16D 86.17 KRI
61.47 (1113) 64.67 (1295) 221.73/80.39 maltol C6H6D3 85.63 KRI
61.47 (1113) 59.11 (1183) 104.64/55.66 E-2-hexenyl propionate C9H16D2 85.98 KRI
1DB-5 apolar column (10m); 2DB-1701 slightly polar column (10m); 3RT – Retention time; 4KRI - Kovats Retention Index.
Table 2. Volatile compounds marked in green beans Coffea arabica from Colombia.
Retention time/Kovacs1
Retention
time/Kovacs2 Peak heights/area Name of compounds Empirical formula Relevance index
Analytical Standards RT3/KRI4
37.26 (763) 47.44 (977) 364.22/213.18 2-methylpropanoic acid C4H8D2 66.78 KRI 49.88 (924) 47.94 (985) 252.32/145.66 methyl hexanoate C7H14D2 77.12 KRI 52.84 (972) 51.13 (1034) 253.33/118.48 dimethyl trisulfide C2H6S3 80.54 KRI 56.52 (1030) 55.22 (1109) 197.51/65.89 2-Propionyl pyrrole C7H9ND 88.61 KRI
1DB-5 apolar column (10m); 2DB-1701 slightly polar column (10m); 3RT – Retention time; 4KRI - Kovats Retention Index.
Table 3. Volatile compounds marked in green beans Coffea robusta from Uganda.
Retention time/Kovacs1
Retention
time/Kovacs2 Peak heights/area Name of compounds Empirical formula Relevance index
Analytical Standards RT3/KRI4
36.55 (755) 37.77 (838) 454.47/180.76 2-methylpentanal C6H12D 92.49 KRI
48.73 (910) 47.76 (984) 255.33/147.04
4-methoxy-2-methyl-2-mercaptobutane C6H12DS 70.88 KRI
49.82 (926) 47.94 (984) 225.40/96.14 methyl hexanoate C7H14D2 76.52 KRI
Cis-3-Hexenol was identified in coffee in the study by Dchiai et al. (2014), Bertrand et al. (2012) identified toluene in green Arabica coffee and Nebesny et al. (2007) in green coffee beans, Procida et al. (1997) in green coffee (arabica and robusta) and Cantergiani at al. (2001) in green C. arabica from Mexico (Flament & Bessière-Thomas, 2002).
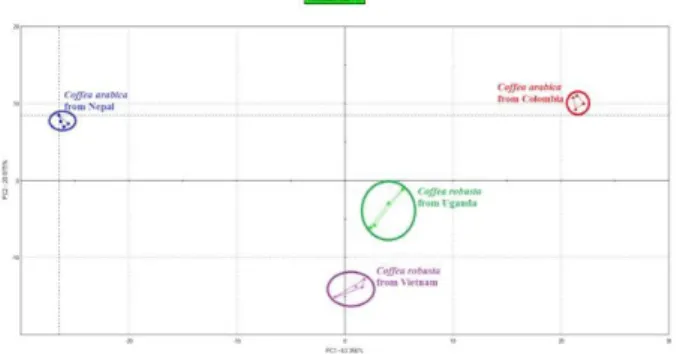
PCA method enables identification of separate compounds that differ among coffee species. The results of the PCA analysis of volatile compounds are described in Figure 1. Based on this analysis, it can be stated that the four analysed types of coffee differ from each other, enabling unambiguous identification as well as the assignment of samples to a specific group.
Samples of Arabica from Colombia are set in the upper left part of the chart, Arabica from Nepal in the upper right part and roasted Robusta can be found in the third quadrant of the graph. A clear arrangement of samples can be observed in the chart: the Arabicas are on the opposite sides of the graph while the Robustas are close to each other. Coffea arabica seems to be well grouped. Types of Coffea canephora are close to each other, which results from the more similar sensory descriptors than in the case of Arabica.
Volatile compounds occurring in roasted and unroasted coffee allow for differentiating from which country they come from. These countries have different location above sea level, climate, annual precipitation and temperature. Such conditions have an impact on growth, flowering, the way of harvesting coffee as well as on the formation of different volatile compounds in coffee. The volatile compounds identified in coffee samples proved to be different. The only common feature of both species of coffee is one sensory descriptor but it is represented by various chemical compounds. Dur findings could be confirmed by the results of the study by Freitas et al. (2001), in which volatile compounds profiles of Coffea arabica and Coffea robusta occurred on the opposite sides of the PC1 axis.
Coffea arabica is used in blends for the aroma effect whereas
Coffea robusta is used for taste. Consumers are rather unable to notice the difference between Arabica and Robusta in the taste of coffee beverage. However, the difference between the two types of coffee is perceptible, not only in price but also in the volatile compounds profiles. It can be determined by using the electronic nose. With these designations and this method it is
possible to easily and quickly verify the contents of the product and check its accordance with the manufacturer’s declaration and whether the country of origin is compatible with the indication on the packaging.
References
Agresti, P. D. C. M., Franca, A. S, Dliveira, S. L., & Augusti, R. (2008). Discrimination between defective and non-defective Brazilian coffee
beans by their volatile profile. Food Chemistry, 106(2), 787-796.
http://dx.doi.org/10.1016/j.foodchem.2007.06.019.
Baietto, M., & Wilson, A. D. (2015). Electronic-nose applications for
fruit identification, ripeness, and quality grading. Sensors, 15(1),
899-931. PMid:25569761. http://dx.doi.org/10.3390/s150100899. Bertrand, B., Boulanger, R., Dussert, S., Ribeyre, F., Berthiot, L.,
Descroix, F., & Joët, T. (2012). Climatic factors directly impact the volatile organic compound fingerprint in green Arabica coffee bean
as well as coffee beverage quality. Food Chemistry, 135(4), 2575-2583.
PMid:22980845. http://dx.doi.org/10.1016/j.foodchem.2012.06.060. Bhumiratana, N., Adhikari, K., & Chambers, E. (2011). IV: Evolution of sensory aroma attributes from coffee beans to brewed coffee.
LWT – Food Science and Technology, 44, 2185-2192.
Blank, I. (2002). Sensory relevance of volatile organic sulfur compounds
in food. In G. A. Reineccius & T. A. Reineccius (Eds.), Heteroatomic
aroma compounds (chap. 2, pp. 25-53). Washington: ACS Pulications.
http://dx.doi.org/10.1021/bk-2002-0826.ch002.
Bosselmann, A. S., Dons, K., Dberthur, T., Dlsen, C. S., Ræbild, A., & Usma, H. (2009). The influence of shade trees on coffee quality in small holder coffee agroforestry systems in Southern Colombia.
Agriculture, Ecosystems & Environment, 129(1-3), 253-260. http://
dx.doi.org/10.1016/j.agee.2008.09.004.
Brodowska, M., Guzek, D., Kołota, A., Głąbska, D., Górska-Horczyczak, E., Wojtasik-Kalinowska, I., & Wierzbicka, A. (2016). The effect of diet on oxidation and profile of volatile compounds of pork after
freezing storage. Journal of Food and Nutrition Research, 55, 40-47.
Bröhan, M., Huybrighs, T., Wouters, C., & Van der Bruggen, B. (2009). Influence of storage conditions on aroma compounds in coffee pads
using static headspace GC–MS. Food Chemistry, 116(2), 480-483.
http://dx.doi.org/10.1016/j.foodchem.2009.02.072.
Buffo, R. A., & Cardelli-Freire, C. (2004). Coffee flavour: an overview.
Flavour and Fragrance Journal, 19(2), 99-104. http://dx.doi.
org/10.1002/ffj.1325.
Cantergiani, E., Brevard, H., Krebs, Y., Feria-Morales, A., Amadò, R., & Yeretzian, C. (2001). Characterisation of the aroma of green Mexican
coffee and identification of mouldy/earthy defect. European Food
Research and Technology, 212(6), 648-657. http://dx.doi.org/10.1007/
s002170100305.
Cheong, M. W., Tong, K. H., Dng, J. J. M., Liu, S. Q., Curran, P., & Yu, B. (2013). Volatile composition and antioxidant capacity of Arabica
coffee. Food Research International, 51(1), 388-396. http://dx.doi.
org/10.1016/j.foodres.2012.12.058.
Cho YJ, Kang S. (2011) (Eds.). Emerging technologies for food quality
and food safety evaluation. Arlington: Press Taylor & Francis Group.
Farah, A., Monteiro, M. C., Calado, V., Franca, A. S., & Trugo, L. C. (2006). Correlation between cup quality and chemical attributes
of Brazilian coffee. Food Chemistry, 98(2), 373-380. http://dx.doi.
org/10.1016/j.foodchem.2005.07.032.
Fisk, I. D., Kettle, A., Hofmeister, S., Virdie, A., & Kenny, S. J. (2012).
Discrimination of roast and ground coffee aroma. Flavour and
Fragrance Journal, 1(1), 14. http://dx.doi.org/10.1186/2044-7248-1-14.
Flament, I., & Bessière-Thomas, Y. (2002). Coffee flavor chemistry (pp. 123; 303). Hoboken: John Wiley & Sons.
Freitas, A. M. C., & Mosca, A. I. (1999). Coffee geographic origin – an
aid coffee differentiation. Food Research International, 32(8),
565-573. http://dx.doi.org/10.1016/S0963-9969(99)00132-5.
Freitas, A. M. C., Parreira, C., & Vilas-Boas, L. (2001). The use of an electronic aroma-sensing device to assess coffee differentiation-comparison with SPME gas chromatography-mass spectrometry
aroma patterns. Journal of Food Composition and Analysis, 14(5),
513-522. http://dx.doi.org/10.1006/jfca.2001.0987.
Gutmann, W., Werkhoff, P., Barthels, M., & Vitzthum, D. G. (1979). Comparison of the aromatic substances of Arabusta, Arabica, and
Robusta coffee beans by the “headspace technique”. In Proceedings
of the 8th International Scientific Colloquium on Coffee, Paris.
Huang, L.-F., Wu, M.-J., Zhong, K.-J., Sun, X.-J., Liang, Y.-Z., Dai, Y.-H., Huang, K.-L., & Guo, F.-Q. (2007). Fingerprint developing of coffee flavor by gas chromatography – mass spectrometry and combined
chemometrics methods. Analytica Chimica Acta, 588(2), 216-223.
PMid:17386813. http://dx.doi.org/10.1016/j.aca.2007.02.013.
IndexMundi. (2016a). Coffee, other mild arabicas. Retrieved from
http://www.indexmundi.com/commodities/?commodity=other-mild-arabicas-coffee&months=60
IndexMundi. (2016b). Coffee, robusta. Retrieved from http://www.
indexmundi.com/commodities/?commodity=robusta-coffee&months=60 Kumazawa, K., & Masuda, H. (1999). Identification of potent odorants
in Japanese green tea (Sen-cha). Journal of Agricultural and Food
Chemistry, 47(12), 5169-5172. PMid:10606589. http://dx.doi.
org/10.1021/jf9906782.
Lee, K.-G., & Shibamoto, T. (2002). Analysis of volatile components
isolated from Hawaiian green coffee beans (Coffea arabica L.).
Flavour and Fragrance Journal, 17(5), 349-351. http://dx.doi.
org/10.1002/ffj.1067.
Mestdagh, F., Davidek, T., Chaumonteuil, M., Folmer, B., & Blank, I. (2014).
The kinetics of coffee aroma extraction. Food Research International,
63, 271-274. http://dx.doi.org/10.1016/j.foodres.2014.03.011. Michishita, T., Akiyama, M., Hirano, Y., Ikeda, M., Sagara, Y., & Araki,
T. (2010). Gas chromatography/ olfactometry and electronic nose analyses of retronasal aroma of espresso and correlation with sensory
evaluation by an artificial neural network. Journal of Food Science,
75(9), S477-489. PMid:21535621. http://dx.doi.org/10.1111/j.1750-3841.2010.01828.x.
Nebesny, E., Budryn, G., Kula, J., & Majda, T. (2007). The effect of roasting an headspeace composition of robusta coffee bean aroma.
European Food Research and Technology, 225(1), 9-19. http://dx.doi.
org/10.1007/s00217-006-0375-0.
Dchiai, N., Tsunokawa, J., Sasamoto, K., & Hoffmann, A. (2014). Multi-volatile method for aroma analysis using sequential dynamic
headspace sampling with an application to brewed coffee. Journal
of Chromatography. A, 1371, 65-73. PMid:25456588. http://dx.doi.
org/10.1016/j.chroma.2014.10.074.
Destreich-Janzen S. (2013). Chemistry of coffee: reference module in
chemistry, molecular sciences and chemical engineering (pp. 1-28).
Cambridge: Elsevier.
Procida, G., Palo, D., & Bogoni, P. (1997). Analysis of the volatile
constituents of green coffee by headspace GC-MS. Rivista Italiana
EPSOS, 251-261.
Rodriguez, J., Duran, C., & Reyes, A. (2010). Electronic nose for quality control of Colombian coffee through the detection of defects in
“Cup Tests”. Sensors, 10(1), 36-46. PMid:22315525. http://dx.doi.
org/10.3390/s100100036.
Schievano, E., Finotello, C., De Angelis, E., Mammi, S., & Navarini, L. (2014). Rapid authentication of coffee blends and quantification of 16-D-methylcafestol in roasted coffee beans by nuclear magnetic
resonance. Journal of Agricultural and Food Chemistry, 62(51),
12309-12314. PMid:25431971. http://dx.doi.org/10.1021/jf505013d. Semmelroch, P., & Grosch, W. (1995). Analysis of roasted coffee powders and brews by gas chromatography-olfactometry of headspace samples.
LWT – Food Science and Technology, 28(3), 310-313.
Shilbayeh, N. F., & Iskandarani, M. Z. (2004). Quality control of coffee
using an electronic nose system. American Journal of Applied Sciences,
1(2), 129-135. http://dx.doi.org/10.3844/ajassp.2004.129.135. Silwar, R., & Lüllmann, C. (1993). Investigation of aroma formation
in Robusta coffee during roasting. Café Cacao Thé, 37(2), 145-152.
Sunarharum, B. W., Williams, D. J., & Smyth, E. H. (2014). Complexity
of coffee flavor: a compositional and sensory perspective. Food
Research International, 62, 315-325. http://dx.doi.org/10.1016/j.
foodres.2014.02.030.
Suslick, B. A., Feng, L., & Suslick, K. S. (2010). Discrimination of complex mixtures by a colorimetric sensor array: Coffee aromas.
Analytical Chemistry, 82(5), 2067-2073. PMid:20143838. http://
dx.doi.org/10.1021/ac902823w.
Toci, A. T., & Farah, A. (2008). Volatile compounds as potential
defective coffee beans’ markers. Food Chemistry, 108(3), 1133-1141.
PMid:26065781. http://dx.doi.org/10.1016/j.foodchem.2007.11.064. Vitzthum, D. G. (1976). Chemistry and processing of coffee. ln D.
Eichler (Ed.), Coffee and caffeine (GeL). (pp. 3-64). Berlin: Springer.
Wilson, A. D. (2013). Diverse applications of electronic-nose technologies
in agriculture and forestry. Sensors, 13(2), 2295-2348. PMid:23396191.
http://dx.doi.org/10.3390/s130202295.
Wilson, A. D., & Baietto, M. (2009). Applications and advances in
electronic-nose technologies. Sensors, 9(7), 5099-5148. PMid:22346690.
http://dx.doi.org/10.3390/s90705099.
Win, D. T. (2005). The electronic nose – a big part of our future. AU
Journal of Technology, 9(1), 1-8.
Wintgens, J. N. (2004). Coffee: growing, processing, sustainable production.
Hoboken: Wiley.
Wojtasik-Kalinowska, I., Guzek, D., Górska-Horczyczak, E., Głąbska, D., Brodowska, M., Sun, D.-W., & Wierzbicka, A. (2016). Volatile
compounds and fatty acids profile in Longissimus dorsi muscle from
pigs fed with feed containing bioactive components. LWT - Food
Science and Technology, 67, 112-117.
Wrigley, G. (Ed.). (1988). Coffee. London: Longman.
Yeretzian, C., Jordan, A., Badoud, R., & Lindinger, W. (2002). From the green bean to the cup of coffee: investigating coffee roasting by
on-line monitoring of volatiles. European Food Research and Technology,