Economic and climatic models for estimating coffee supply
Adriana Ferreira de Moraes-Oliveira(1), Lucas Eduardo de Oliveira Aparecido(2) and Sérgio Rangel Fernandes Figueira(1)
(1)Universidade Estadual Paulista (Unesp), Faculdade de Ciências Agrárias e Veterinárias, Departamento de Economia, Administração e Educação, Via de Acesso Prof. Paulo Donato Castellane, s/no, CEP 14884-900 Jaboticabal, SP, Brazil. E-mail: adriana_fmoraes@hotmail.com, figueira@fcav.unesp.br (2)Unesp, Faculdade de Ciências Agrárias e Veterinárias, Departamento de Ciências Exatas, Via de Acesso Prof. Paulo Donato Castellane, s/no, CEP 14884-900 Jaboticabal, SP, Brazil. E-mail: lucas-aparecido@outlook.com
Abstract ‒ The objective of this work was to estimate the coffee supply by calibrating statistical models with economic and climatic variables for the main producing regions of the state of São Paulo, Brazil. The regions were Batatais, Caconde, Cássia dos Coqueiros, Cristais Paulista, Espírito Santo do Pinhal, Marília, Mococa, and Osvaldo Cruz. Data on coffee supply, economic variables (rural credit, rural agricultural credit, and production value), and climatic variables (air temperature, rainfall, potential evapotranspiration, water deficit, and water surplus) for each region, during the period from 2000–2014, were used. The models were calibrated using multiple linear regression, and all possible combinations were tested for selecting the variables. Coffee supply was the dependent variable, and the other ones were considered independent. The accuracy and precision of the models were assessed by the mean absolute percentage error and the adjusted coefficient of determination, respectively. The variables that most affect coffee supply are production value and air temperature. Coffee supply can be estimated with multiple linear regressions using economic and climatic variables. The most accurate models are those calibrated to estimate coffee supply for the regions of Cássia dos Coqueiros and Osvaldo Cruz.
Index terms: Coffea arabica, climate, econometrics, modelling, rural credit.
Modelos econômicos e climáticos para estimativa da oferta cafeeira
Resumo – O objetivo deste trabalho foi estimar a oferta cafeeira por meio da calibração de modelos estatísticos, com variáveis econômicas e climáticas, das principais regiões produtoras do Estado de São Paulo. As regiões estudadas foram Batatais, Caconde, Cássia dos Coqueiros, Cristais Paulista, Espírito Santo do Pinhal, Marília, Mococa e Osvaldo Cruz. Foram utilizados dados de oferta cafeeira, variáveis econômicas (crédito rural, crédito rural na agricultura e valor da produção) e variáveis climáticas (temperatura do ar, precipitação pluvial, evapotranspiração potencial, deficiência e excedente hídrico) de cada região, para o período de 2000– 2014. Os modelos foram calibrados com uso de técnicas de regressão linear múltipla, e todas as combinações possíveis foram testadas para a seleção das variáveis. A oferta cafeeira foi a variável dependente, e as demais, as independentes. A acurácia e a precisão dos modelos foram analisadas pelo erro percentual médio e pelo coeficiente de determinação ajustado, respectivamente. As variáveis que mais influenciam a oferta cafeeira são o valor de produção e a temperatura do ar. É possível estimar a oferta cafeeira com regressões lineares múltiplas por meio de variáveis econômicas e elementos climáticos. Os modelos mais acurados são os calibrados para estimar a oferta cafeeira das regiões de Cássia dos Coqueiros e Osvaldo Cruz.
Termos para indexação: Coffea arabica, clima, econometria, modelagem, crédito rural.
Introduction
Coffee (Coffea arabica L.) is a commodity that generates employment and income in several Brazilian regions (Aparecido et al., 2015) and is one of the country’s main agricultural exports (Resende et al., 2009; Barbosa et al., 2012). Worldwide, it is the most consumed beverage after water (Zelber-Sagi et al., 2015). Brazilian production is 51.94 million
60-kg sacks (Acompanhamento…, 2016). A method for estimating supply would undoubtedly be a useful strategic marketing tool, considering the importance of this commodity.
in the future markets (Aparecido et al., 2017). These determinants of supply may be economic, such as product price, production value, and public credit (Goedert et al., 1980), and climatic, including air temperature, rainfall, and water deficit (Martins et al., 2015).
Simulation models can be used to efficiently evaluate the economic and climatic effects on crop supply (Vianna & Sentelhas, 2014; Shao et al., 2015). The models integrate information from several areas (Aparecido et al., 2014), from economic variables to crop agrometeorological conditions (Jame & Cutforth, 1996; Gouranga & Kumar, 2014). The models help producers in their strategic planning (Lucio et al., 2016) and decision-making in the production chain (Chipanshi et al., 2015). Simulation models were used to generate and analyse temporal projections (Pinto et al., 2015) for Brazilian coffee cultivation (Aparecido et al., 2017).
Previous studies have used econometric analyses. Shikida et al. (2007), for example, evaluated the variation of sugar and alcohol supplies in the state of Paraná from 1980 to 2015 and found that the supply of sugar varied inversely with the price of alcohol; the quantity of sugar on the market decreased by 2% with a 1% increase in the average price of alcohol. Satolo & Bacchi (2009) evaluated the role of sudden changes in supply and demand in the recent evolution of sugarcane production for the state of São Paulo and concluded that the variation of the price of sugarcane had an impact of >40% on the productivity of the supply of sugarcane. A few studies, however, have boldly estimated coffee supply based on economic and climatic conditions.
The objective of this work was to estimate coffee supply by calibrating statistical models with economic and climatic variables for the main producing regions of the state of São Paulo, Brazil.
Materials and Methods
Historical series of economic, climatic, and phytotechnical data of arabica coffee planted in the state of São Paulo, Brazil, were used. Representative regions of the state were selected for estimating coffee production: Batatais (BTT), Caconde (CCD), Cássia dos Coqueiros (CDC), Cristais Paulista (CTP), Espírito Santo do Pinhal (ESP), Marília (MAR), Mococa (MCC), and Osvaldo Cruz (OVC).
Multiple linear regression models (RLM) were used for the modeling of coffee production supply. In the present study, the equation used was:
Y=CL+a×X1+b×X2+c×X3+d×X4+ε,
in which Y is the coffee supply of the municipalities (bags of 60 kg); a, b, c, and d are the parameters of the model (weight); X1, X2, X3, and X4 are the economic and climatic variables selected; CL is the linear coefficient (constant term); and ε is the random error.
Economic and climatic variables were used as independent variables in the construction of the models. The economic variables were the total rural credit of the municipality (real), the rural credit of the municipality’s agriculture (real), and the value of coffee production, which consisted of the unit price multiplied by the quantity produced (current thousand real). The climatic variables were air temperature (ºC), rainfall (mm per year), potential evapotranspiration (mm per year), water deficit (mm per year), and water surplus (mm per year). The coffee-supply and economic data were for 2000-2014 and were obtained from the Instituto de Economia Agrícola (IEA, 2017) and Fundação Sistema Estadual de Análise de Dados (São Paulo, 2015). The series of climatic data was obtained from the National Institute of Meteorology.
Correlations (r) were estimated between coffee supply and the economic and climatic variables, in order to identify those with the largest effect on the coffee supplies of the municipalities. The climatic and economic variables with the highest Pearson’s correlation coefficients (r=1) were also subjected to a simple linear regression analysis to explore and infer the relationship of these variables as a function of coffee supply.
A sensitivity analysis, also known as “elasticity”, was applied with the calibrated models (Gujarati & Porter, 2011). In this analysis, the angular coefficients (weight) of the independent variables are compared, and the higher the weight, the greater the effect of that variable on coffee supply.
The models were calibrated using visual basic for applications. The models were selected by an evaluation of the accuracy indicated by MAPE (%) and of the precision indicated by the adjusted coefficient of determination (adjusted R2 ), according to the equations:
MAPE
Yest Yobs Yobs
n
i
n i i
i
=
∑ − ×
=1 100
,
in which Yesti is an estimated variable; Yobsi is an observed variable; and n is the number of datapoints (years).
Adjusted R R n
n k 2
2
1 1 1
1 = −
(
−)
×( − )− −
,
in which n is the number of datapoints (years), and k is the number of independent variables in the regression. Only the significant regressions by the F-test, at 5% probability, were selected.
Results and Discussion
The economic variables evaluated had a direct relationship with coffee supply in the state of São Paulo (Table 1). Coffee supply increased with increases in total rural credit (RC), rural credit from agriculture (RCA), and the value of coffee production (VP), because the increases in the credits and the price of the product allowed coffee growers to invest in their crops, which led to increased production (Tosi et al., 2007).
The climatic variables were variously correlated with coffee supply (Table 1). Coffee supply decreased with increases in mean air temperature (T), potential evapotranspiration (ETo), and water deficit (WD). Other studies, such as that of Martins et al. (2015), have also reported that high T and intense WD negatively affected coffee production.
The economic variables were also variously correlated with the climatic conditions. P and WD were directly and indirectly correlated, respectively, with RC, RCA, and VP, showing that the financing
Table 1. Pearson’s correlation coefficients (r) between the economic and climatic variables for coffee (Coffea arabica) supply of the state of São Paulo, Brazil(1).
Supply RC RCA VP Temperature Rainfall ETo WD SUR
Supply 1.0
RC 0.286* 1.0
RCA 0.340* 0.988* 1.0
VP 0.808* 0.261* 0.319* 1.0
Temperature -0.552* -0.387* -0.418* -0.437* 1.0
Rainfall 0.101 0.078 0.085 0.016 -0.432 1.0
ETo -0.249* -0.080 -0.083 -0.179 0.437* -0.045 1.0
WD -0.208* -0.217* -0.218* -0.067 0.570* -0.471* 0.731* 1.0
SUR 0.162 0.064 0.069 0.115 -0.528* 0.811* -0.488* -0.564* 1.0
(1)RC, total rural credit by municipality (real); RCA, rural credit of the municipality’s agriculture (real); VP, value of coffee production (real); T, air
of crops by public agencies was higher in years with high water rates and product prices. These effects of climatic conditions on the credits have already been highlighted in other studies, such those of as Rossetti (2001) and Guanziroli & Guanziroli (2015), who also found that the financing sources varied their capital investments as a function of meteorological conditions.
Coffee supply was more highly correlated with the economic than the climatic variables (Figure 1 A). It was most correlated with VP, followed by T, with high coefficients of 0.808 and -0.552, respectively. Identifying the variables that were highly correlated with coffee supply allowed to evaluate these relationships more thoroughly. VP had a direct relationship, which explained 83% of the variation in coffee supply. This value of VP was high, because production increased by 2,820 sacks of 60-kg for every 1,000 real increase in VP (Figure 1 B).
Testing all possible combinations with up to five variables produced models with a total of 1,744 combinations of independent variables (Figure 2 A). This method of selecting variables by testing all combinations was efficient; p decreased as the precision increased (adjusted R² ≈ 1.00) and the mean absolute percentage error (MAPE) gradually decreased, ultimately reaching zero (Figure 2 B).
This classification was essential for selecting the most accurate models (more accurate and with less tendency), because only those with the lowest MAPEs and the highest precision (adjusted R2) with p<0.05 were selected for estimating coffee supply.
The calibrated models were efficient; the accuracy and precision for all regions averaged 5.04% (MAPE) and 0.90 (adjusted R2) (Table 2). These values are considered adequate by crop modellers (Santos & Camargo, 2006; Savin et al., 2007; Rosa et al., 2010). Chipanshi et al. (2015) used accurate estimation models to show that producers could improve their decision-making and strategic planning. The calibrated model for estimating the coffee supply of the CDC region (model 3) had a low MAPE and a high adjusted R2 of 2.30 and 0.97%, respectively. An estimate of the supply of a region with an error of only 2.30% is considered very low (Aparecido et al., 2017); an average supply of 25,000 sacks of coffee in a municipality would vary by only 575 sacks. RC, VP, T, and annual rainfall had the greatest effect on the quantification of the coffee supply in CDC (Table 2). Of these, T showed the greatest effect and was inversely proportional to the supply.
The largest difficulty in estimating coffee supply was the high bienniality of coffee between
Figure 1. Effect of the economic and climatic variables on coffee (Coffea arabica) supply (A) and linear regression between the production value and the coffee supply of the state of São Paulo, Brazil (B). RC, total rural credit by municipality (real); RCA, rural credit of the municipality’s agriculture (real); VP, value of the coffee production (real); T, air temperature (°C); R, rainfall (mm per year); ETo, potential evapotranspiration (mm per year); WD, water deficit (mm per year); and SUR water surplus (mm per year).
-0.8 -0.6 -0.4 -0.2 0 0.2 0.4 0.6 0.8
VP T CRA CR Eto WD SUR R
Supply = 2.82VP + 904.25 Adjusted R² = 0.83 0
50,000 100,000 150,000 200,000 250,000 300,000
0 10,000 20,000 30,000 40,000 50,000 Production value (thousand real)
Correlation (r)
Cof
fee supply (60-kg sacks)
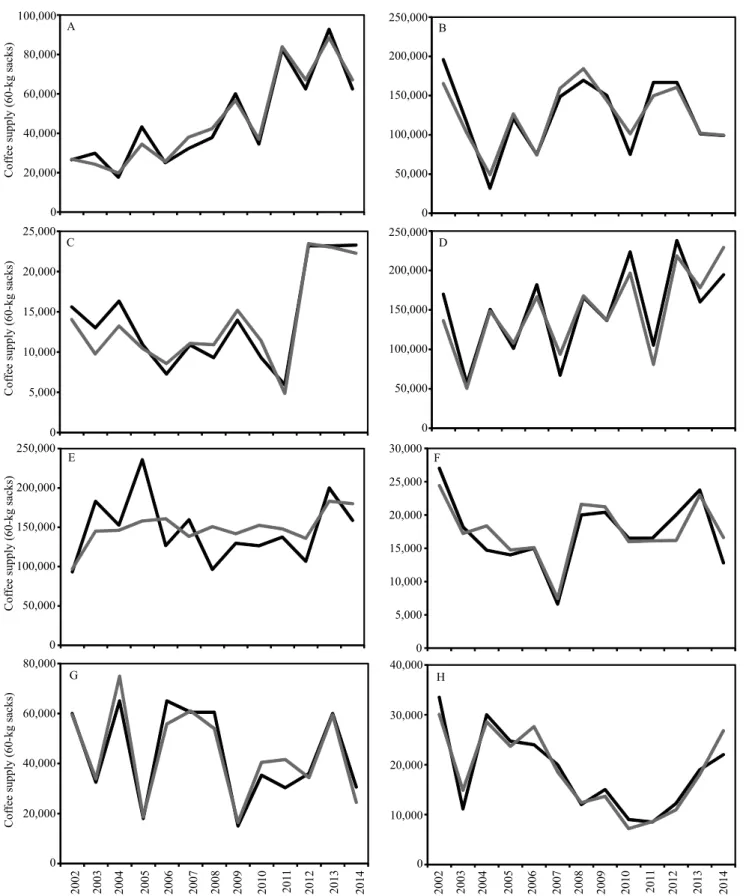
harvests, which is due to the physiology of the crop (Rodrigues et al., 2013; Melke & Fetene, 2014). The calibrated models for the coffee regions followed the variability of coffee supply. Notably, the models calibrated with economic and climatic variables, in addition to accompanying the bienniality, also followed the tendencies of increases and decreases in coffee supply, as in BTT and OVC, respectively (Figure 3).
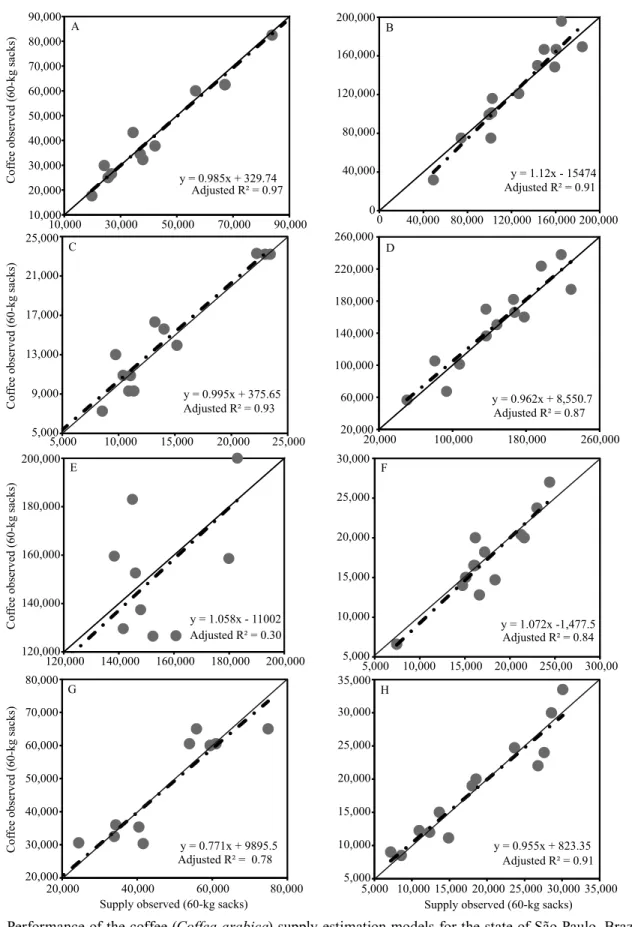
The highest performances were in the models calibrated for BTT, CDC, and OVC, with adjusted R2 of 0.97, 0.93, and 0.91, respectively (Figure 4), which are considered high in the calibration of estimation models (Savin et al., 2007). Moreto & Rolim (2015) also reported precisions >0.95 (adjusted R2) in calibrated models for estimating orange [Citrus sinensis (L.) Osbeck] production for the state of São Paulo. The model developed for ESP performed the worst, with
Figure 2. Multiple regression models calibrated (A) and example of the classification of the models according to the criteria
of accuracy (minor MAPE), precision (greater adjusted R²), and reliability (p-value) (B) for Batatais, in the state of São Paulo, Brazil. MAPE, mean absolute percentage error.
Table 2. Calibrated models to estimate the coffee (Coffea arabica) supply of the state of São Paulo, Brazil, as affected by economic and climatic parameters(1).
Region Models p-value Calibration
MAPE (%) Adjusted R² (1) BTT Y=0 00165. CR−0 00166. CRA+3 419. VP+5686 20. T−4 063. SUR−121479 74. 0.001 6.5 0.89
(2) CCD Y= −0 00119. CRA+3 86. VP−51 20. R−113 23. ETo−169 09. WD+41615 47. 0.002 4.6 0.96
(3) CDC Y=0 000438. CRA+3 17. VP−1660 79. T−1 260. R+46934 7. 0.004 2.3 0.97
(4) CTP Y=0.0661CR−0 0655. CRA−0 840. VP−45223T−151 34. SUR−1154451 0.002 3.7 0.93
(5) ESP Y=0 000039. CR+1 245. VP−221 16. ETo−59 95. WD+456296 40. 0.004 10.7 0.75
(6) MAR Y=0.0021CR+0 00301. CRA+1 376. VP+1 900. ETo−17 762. WD+12526 20. 0.002 4.2 0.90
(7) MCC Y=0 00097. CR+10.37VP−55267 4. T−219 9. R+206 26. SUR+1453247 0.002 3.3 0.92
(8) OVC Y= −0.00145CR+3 899. VP−1282 95. T−2 155. SUR+7 213. WD+58424 29. 0.001 2.9 0.94
(1)BTT, Batatais; CCD, Caconde; CDC, Cássia dos Coqueiros; CTP, Cristais Paulista; ESP, Espírito Santo do Pinhal; MAR, Marília; MCC, Mococa; and
OVC, Osvaldo Cruz. Y, coffee supply (sacks); RC, total rural credit by municipality (real); RCA, rural credit of the municipality’s agriculture (real); VP, value of coffee production (real); T, air temperature (°C); R, rainfall (mm per year); ETo, potential evapotranspiration (mm per year); WD, water deficit (mm per year); and SUR, water surplus (mm per year). MAPE, mean absolute percentage error.
0 100 200 300 400 500 600 700 800 900
1 2 3 4 5 Total
Independent variables of the model (unit)
0 5 10 15 20 25 30 35 40
0 0.2 0.4 0.6 0.8
Adjusted R , p-value
2
2 6 11 16 20 25 30 34 39 44 48 53 58 63 67 72 77 81 86 91 95 Number of models (%)
Adjusted R2
p-value MAPE
Number of models (unit)
A
B
Figure 3. Coffee (Coffea arabica) supply estimated by the calibrated models for the state of São Paulo, Brazil, in: A, Batatais; B, Caconde; C, Cássia dos Coqueiros; D, Cristais Paulista; E, Espírito Santo do Pinhal; F, Marília; G, Mococa; and H, Osvaldo Cruz.
0 50,000 100,000 150,000 200,000 250,000
B
0 5,000 10,000 15,000 20,000 25,000
C
0 50,000 100,000 150,000 200,000 250,000
D
0 50,000 100,000 150,000 200,000 250,000
E
0 5,000 10,000 15,000 20,000 25,000 30,000
F
0 20,000 40,000 60,000 80,000
2002
G
0 10,000 20,000 30,000 40,000
H 0
20,000 40,000 60,000 80,000 100,000
Observed Estimated A
Cof
fee supply (60-kg sacks)
Cof
fee supply (60-kg sacks)
Cof
fee supply (60-kg sacks)
Cof
fee supply (60-kg sacks)
2003 2004 2005 2006 2007 2008 2009 2010 201
1
2012 2013 2014 2002 2003 2004 2005 2006 2007 2008 2009 2010 201
1
an accuracy of 0.30 (Figure 4 E). ESP had the largest deviations in the estimates of the coffee supply, due to the effect of climatic factors not used in the calibration of the models, e.g., low minimum air temperature, cold winds, and frost.
Conclusions
1. Coffee (Coffea arabica) supply is controlled by economic and climatic variables.
2. The value of coffee production and air temperature have the greatest effect on the variation of coffee supply in the state of São Paulo, Brazil.
3. Coffee supply increases with an increase in production value.
4. Coffee supply can be estimated with multiple linear regressions of economic and climatic variables.
5. The models calibrated with economic and climatic variables are accurate and precise, and the models calibrated for estimating the coffee of the regions of Cássia dos Coqueiros and Osvaldo Cruz are the most accurate.
References
ACOMPANHAMENTO DA SAFRA BRASILEIRA [DE] CAFÉ:safra 2016: primeiro levantamento, v.2, n.1, janeiro 2016. 68p. Available at: <http://www.conab.gov.br/OlalaCMS/uploads/ arquivos/16_01_20_17_01_56_boletim_cafe_-_ janeiro_2016. pdf>. Accessed on: Jan. 14 2017.
ALVES, L.R.A.; BACCHI, M.R.P. Oferta de exportação de açúcar
do Brasil. Revista de Economia e Sociologia Rural, v.42, p.9-33, 2004. DOI: 10.1590/S0103-20032004000100001.
APARECIDO, L.E. de O.; ROLIM, G. de S.; LAMPARELLI, R.A.C.; SOUZA, P.S. de; SANTOS, E.R. dos. Agrometeorological Models for Forecasting Coffee Yield. Agronomy Journal, v.109, p.249-258, 2017. DOI: 10.2134/agronj2016.03.0166.
APARECIDO, L.E. de O.; ROLIM, G. de S.; SOUZA, P.S. de. Épocas de florescimento e colheita da nogueira-macadâmia para áreas cafeícolas da região Sudeste. Revista Brasileira de Fruticultura, v.36, p.170-178, 2014. DOI: 10.1590/0100-2945-288/13.
APARECIDO, L.E. de O.; ROLIM, G. de S.; SOUZA, P.S. de. Sensitivity of newly transplanted coffee plants to climatic conditions at altitudes of Minas Gerais, Brazil. Australian Journal of Crop Science, v.9, p.160-167, 2015.
BARBOSA, J.N.; BORÉM, F.M.; CIRILLO, M.A.; MALTA, M.R.; ALVARENGA, A.A.; ALVES, H.M.R. Coffee quality
and its interactions with environmental factors in Minas Gerais, Brazil. Journal of Agricultural Science, v.4, p.181-190, 2012. DOI: 10.5539/jas.v4n5p181.
CHIPANSHI, A.; ZHANG, Y.; KOUADIO, L.; NEWLANDS, N.; DAVIDSON, A.; HILL, H.; WARREN, R.; QIAN, B.; DANESHFAR, B.; BEDARD, F.; REICHERT, G. Evaluation of the Integrated Canadian Crop Yield Forecaster (ICCYF) model for in-season prediction of crop yield across the Canadian agricultural landscape. Agricultural and Forest Meteorology, v.206, p.137-150, 2015. DOI: 10.1016/j.agrformet.2015.03.007.
GOEDERT, W.J.; LOBATO, E.; WAGNER, E. Potencial agrícola da região dos cerrados brasileiros. Pesquisa Agropecuária
Brasileira, v.15, p.1-17, 1980.
GOURANGA, K.; KUMAR, A. Forecasting rainfed rice yield with biomass of early phenophases, peak intercepted PAR and ground based remotely sensed vegetation indices. Journal of Agrometeorology, v.16, p.94-103, 2014.
GUANZIROLI, C.E.; GUANZIROLI, T. Modernização da Agricultura em Moçambique: determinantes da renda agrícola.
Revista de Economia e Sociologia Rural, v.53, p.S115-S128, 2015. Suplemento 1. DOI: 10.1590/1234-56781806-94790053s01009. GUJARATI, D.N.; PORTER, D.C. Econometria básica. 5.ed. Porto Alegre: AMGH, 2011.
IEA. Instituto de Economia Agrícola. Estatísticas da produção paulista. Available at: ˂http://ciagri.iea.sp.gov.br/nia1/subjetiva.
aspx?cod_sis=1&idioma=1˃. Accessed on: Feb. 19 2017.
JAME, Y.W.; CUTFORTH, H.W. Crop growth models for decision support systems. Canadian Journal of Plant Science, v.76, p.9-19, 1996. DOI: 10.4141/cjps96-003.
LUCIO, A.D.; SARI, B.G.; RODRIGUES, M.; BEVILAQUA, L.M.; VOSS, H.M.G.; COPETTI, D.; FAÉ, M. Modelos não-lineares para a estimativa da produção de tomate do tipo cereja. Ciência Rural, v.46, p.233-241, 2016. DOI: 10.1590/0103-8478cr20150067.
MARTINS, E.; APARECIDO, L.E. de O.; SANTOS, L.P.S.; MENDONÇA, J.M.A. de; SOUZA. P.S. de. Influencia das condições climáticas na produtividade e qualidade do cafeeiro produzido na região do Sul de Minas Gerais. Coffee Science, v.10, p.499-506, 2015.
MELKE, A.; FETENE, M. Eco-physiological basis of drought stress in coffee (Coffea arabica, L.) in Ethiopia. Theoretical and Experimental Plant Physiology, v.26, p.225-239, 2014. DOI: 10.1007/s40626-014-0022-2.
MORETO, V.B.; ROLIM, G. de S. Estimation of annual yield and quality of “valencia” orange related to monthly water deficiencies.
African Journal of Agricultural Research, v.10, p.543-553, 2015. DOI: 10.5897/AJAR2014.9090.
PINTO, V.M.; REICHARDT, K.; DAM, J. van.; LIER, Q. de J. van; BRUNO, I.P.; DURIGON, A.; DOURADO-NETO, D.; BORTOLOTTO, R.P. Deep drainage modeling for a fertigated coffee plantation in the Brazilian savanna. Agricultural Water Management, v.148, p.130-140, 2015. DOI: 10.1016/j.
agwat.2014.09.029.
Acta Scientiarum. Agronomy, v.1, p.189-196, 2009. DOI: 10.4025/actasciagron.v31i2.588.
RODRIGUES, W.N.; TOMAZ, M.A.; FERRÃO, R.G.; FERRÃO, M.A.G.; FONSECA, A. F.A. da; MARTINS, L.D. Crop yield bienniality in groups of genotypes of conilon coffee. African Journal of Agricultural Research, v.8, p.4422-4426, 2013. DOI: 10.5897/AJAR12.1999.
ROSA, V.G.C. da; MOREIRA, M.A.; RUDORFF, B.F.T.; ADAMI, M. Estimativa da produtividade de café com base em um modelo agrometeorológico-espectral. Pesquisa Agropecuária Brasileira, v.45, p.1478-1488, 2010. DOI: 10.1590/S0100-204X2010001200020.
ROSSETTI, L.A. Zoneamento agrícola em aplicações de crédito e securidade rural no Brasil: aspectos atuariais e de política agrícola. Revista Brasileira de Agrometeorologia, v.9, p.386-399, 2001. Número especial.
SANTOS, M.A. dos; CAMARGO, M.B.P. de. Parametrização de modelo agrometeorológico de estimativa de produtividade do cafeeiro nas condições do Estado de São Paulo. Bragantia, v.65, p.173-183, 2006. DOI: 10.1590/S0006-87052006000100022. SÃO PAULO. Fundação Sistema Estadual de Análise de Dados.
Portal de Estatísticas do Estado de São Paulo. 2015. Available at: <http://www.imp.seade.gov.br/frontend/#/dashboards>. Accessed on: Jan. 14 2017.
SATOLO, L.F.; BACCHI, M.R.P. Dinâmica econômica das flutuações na produção de cana-de-açúcar. Economia Aplicada, v.13, p.377-397, 2009. DOI: 10.1590/S1413-80502009000300002. SAVIN, I. Y.; STATHAKIS, D.; NEGRE, T.; ISAEV, V.A. Prediction of crop yields with the use of neural networks. Russian Agricultural Sciences, v.33, p.361-363, 2007. DOI: 10.3103/ S1068367407060031.
SAYLOR, R.G. Procura e oferta de mão-de-obra agrícola no estado de São Paulo. Agricultura em São Paulo, v.21, p.129-146,
1974.SHAO, Y.; CAMPBELL, J.B.; TAFF, G.N.; ZHENG, B. An
analysis of cropland mask choice and ancillary data for annual corn yield forecasting using MODIS data. International Journal of Applied Earth Observation and Geoinformation, v.38, p.78-87, 2015. DOI: 10.1016/j.jag.2014.12.017.
SHIKIDA, P.F.A.; ALVES, L.R.A.; SOUZA, E.C. de; CARVALHEIRO, E.M. Uma análise econométrica preliminar das ofertas de açúcar e álcool paranaenses. Revista de Economia Agrícola, v.54, p.21-32, 2007.
TOSI, P.G.; FALEIROS, R.N.; TEODORO, R. da S. Crédito e pequena cafeicultura no oeste paulista: Franca/SP 1890-1914. Revista Brasileira de Economia, v.61, p.405-426, 2007. DOI: 10.1590/S0034-71402007000300006.
VIANNA, M. dos S.; SENTELHAS, P.C. Simulação do risco de deficit hídrico em regiões de expansão do cultivo de cana-de-açúcar no Brasil. Pesquisa Agropecuária Brasileira, v.49, p.237-246, 2014.
WALPOLE, R.E.; MYERS, R.H.; MYERS, S.L.; YE, K.E.
Probability and statistics for engineers and scientists. 9th ed. Boston: Prentice Hall, 2012. 816p.
WHITE, H. A heteroskedasticity-consistent covariance matrix estimator and a direct test for heteroskedasticity. Econometrica, v.48, p.817-838, 1980. DOI: 10.2307/1912934.
ZELBER-SAGI, S.; SALOMONE, F.; WEBB, M.; LOTAN, R.; YESHUA, H.; HALPERN, Z.; SANTO, E.; OREN, R.; SHIBOLET, O. Coffee consumption and nonalcoholic fatty liver onset: a prospective study in the general population. Translational Research, v.165, p.428-436, 2015. DOI: 10.1016/j.trsl.2014.10.008.