AbstrAct: The increase of yield potential in new rice (Oryza sativa L.) varieties has been a major challenge for genetic improvement.
The generation of mutants, followed by their characterization, constitutes a great possibility to isolate and select genes and genotypes that present agronomic traits of interest. This study aimed to evaluate the effect of chemical mutagen ethyl methane sulphonate (EMS) on agronomic traits in 340 M3 families of rice derived from BRS Querência cultivar. Seeds from each family and the original genotype BRS Querência were sown in the experimental field, and the characters main panicle length, main panicle weight, main panicle grain weight, flag leaf width and plant height were evaluated. Data were subjected to analysis of variance (p ≤ 0.05),
PlAnt breeding -
Article
Identification of variability for agronomically
important traits in rice mutant families
Viviane Kopp da Luz1, Solange Ferreira da Silveira Silveira1, Gabriela Magalhães da Fonseca1,
Eder Licieri Groli1, Ricardo Garcia Figueiredo1, Diego Baretta1, Mauricio Marini Kopp2, Ariano Martins
de Magalhães Junior3, Luciano Carlos da Maia1, Antonio Costa de Oliveira1*
1. Federal University of Pelotas - Eliseu Maciel School of Agronomy - Plant Genomics and Breeding Center - Pelotas (RS), Brazil.
2. Embrapa Pecuária Sul - Bagé (RS), Brazil. 3. Embrapa Clima Temperado - Pelotas (RS), Brazil.
*Corresponding author: [email protected]
Received:Jul. 4, 2015– Accepted:Jul. 20, 2015
and a comparison of means was carried out by Dunnett’s test at 5% significance. The results show that there is genetic variability among the mutant families, suggesting that the mutagen EMS at 1.5% is effective for generating mutants for all assessed traits. Among the characters, plant height was the most affected by the mutagen, which provided an increase in the character. For the main panicle length character, seven families showed means above the control; for main panicle weight and grain weight, four and six mutant families were observed, respectively, with a superior performance in comparison to the control.
intrOdUctiOn
Rice (Oryza sativa L.) is the second most-produced cereal in the world, representing a staple food source for more than half of the world’s population. In 2012, Brazil was the largest rice producer (11.5 million tons) out of the Asian continent (FAOSTAT 2014), being a country with high export potential.
Rice consumption and cultivation in different regions, followed by selection of specific types of rice (variation in amylose content and/or aroma), generated a remarkable phenotypic diversity in the genus Oryza (Harland 1975). The genetic variability constitutes the principle of evolutionary processes and plant breeding, enabling its creation through mutations or expansion through hybridization, followed by selection of genotypes (Jennings et al. 1981; Jalata et al. 2011).
Mutation induction assists breeding programs by increasing variability and therefore obtaining genotypes with agronomically important traits, more adapted to different environmental conditions (Serrat et al. 2014). The spontaneous mutation rate in higher plants is very low, ranging from about 10−5 to 10−8 (Jiang and Ramachandran 2010). Accordingly, mutation induction is an important strategy to increase the frequency of mutations.
The use of physical and chemical mutagens may be of utmost importance for the development and incorporation of new genes and/or alleles of agronomic interest and may result in more stable genotypes, better adapted to climatic and soil conditions in Brazil. Numerous studies have shown positive results obtained with the use of mutagens, thus generating a genotype that may have agronomically desirable traits (Maluszynski et al. 1998; Martins et al. 2007). In Brazil, there are already commercial rice varieties obtained by Empresa de Pesquisa Agropecuária e Extensão Rural de Santa Catarina (EPAgRI) through mutation induction: the first, called SCS 114 Andosan, and the second, SCS 118 Marques (Ishiy et al. 2006; Schiocchet et al. 2014).
Mutation can be induced by treatment with either physical mutagens, such as ionizing radiation, or chemical mutagens, including alkylating substances, for example, ethyl methane sulphonate (EMS) (Predieri 2001; Wu et al. 2005; Talebi et al. 2012). Among chemical mutagens, EMS is the most widely used due to its ease of use and potential for producing high frequency of nucleotide
substitution, generating a relatively high density of irreversible mutations (Henikoff and Comai 2003; Talebi et al. 2012).
Thus, this study evaluated the effect of the chemical mutagen EMS on agronomic traits in 340 M3 families of rice derived from BRS Querência.
MAteriAl And MetHOds
Obtaining the mutant families
Mutant genotypes were obtained by treating seeds of the rice variety BRS Querência with the chemical mutagen EMS at 1.5% (v/v) (0.15 M). Previous studies indicate that concentrations of 1.5 and 1.6% EMS were efficient in generating mutant populations of rice (Wu et al. 2005; Till et al. 2007). The variety BRS Querência, of early cycle, consists of modern American-type plants, with smooth leaves and grains. It has high tillering capacity, strong stems and stands out for presenting long panicle with many fertile spikelets (SOSBAI 2012).
The treatment consisted of soaking a sample of 40,000 seeds in distilled water. Seeds remained submerged for 6 h and then were subjected to the mutagen for 2 h. This soak time in distilled water was set in a preliminary test, in which seeds of BRS Querência were soaked in distilled water for 24 h and weighed every hour until constant weight. This procedure aimed to standardize the water content of seeds and activate their metabolism to favor the mutagenic action of the product. Soon after the application of the mutagenic agent, seeds remained for 1 h in running water and 1 h in still water (Coimbra et al. 1999, 2005). Afterwards, these seeds were sown in experimental field for generation advance.
Generation advance
Seeds of the M1 generation were sown in 2009 for generation advance in an experimental field. Plants harvested in bulk gave rise to the M2 population.
Field trial
In an experimental field, ten seeds of BRS Querência (control) were sown as well as a sample of 340 families randomly chosen, following a completely randomized design. Of these, we evaluated four plants of each family and the control, at random, where each plant was considered an experimental unit, totaling four replications. For the field trial, the minimum cultivation system was employed according to the technical recommendations for irrigated rice (SOSBAI 2012).
Plants were evaluated for the traits: main panicle length (PL), in cm; main panicle weight (PW), in g; main panicle grain weight (PgW), in g; flag leaf width (FLW), in cm; and plant height (PH), in cm. Data were subjected to analysis of variance (p ≤ 0.05), and the comparison between the means was performed by Dunnett’s test at a 5% level of significance. Subsequently, multivariate analysis was run for the separation of families using cluster analysis by the Tocher’s method (Rao 1952), based on the generalized Mahalanobis distance D2, as well as the canonical variable analysis (Cruz and Regazzi 1997). The relative contribution of each variable in the determination of genetic dissimilarity was detected by the method proposed by Singh (1981). Statistical analyses were performed using the genes software (Cruz 2001).
resUlts And discUssiOn
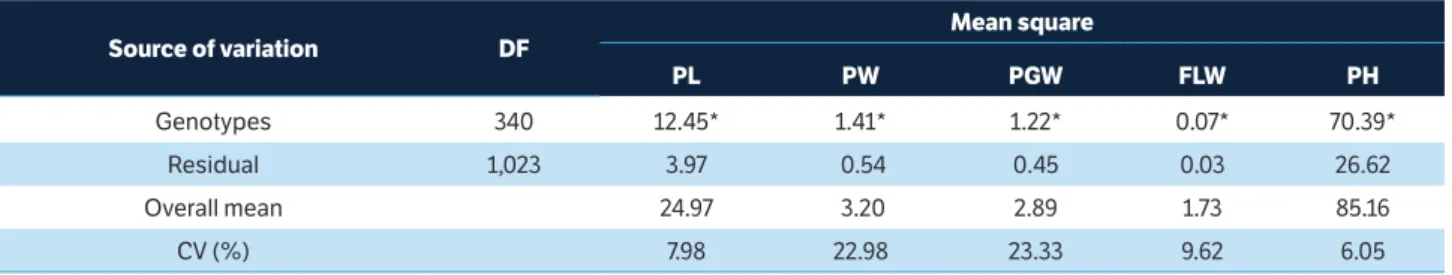
The results presented by analysis of variance (Table 1) evidenced significant differences at 5% significance by F-test between mean values of mutant
families for all traits, demonstrating the efficiency of mutation induction with EMS at 1.5%.
Results of Dunnett’s test for the five traits studied are listed in Tables 2 to 6. These data indicated genetic variability among the families studied, i.e. for all the traits there were families with mean values significantly different from the control BRS Querência.
Considering the main panicle length (Table 2), seven families presented mean values higher than that of the control (24.72 cm), and only the M3 213 family showed smaller main panicle length, while the others remained in the same length class of the control.
The panicle length is positively related to the number of grains per panicle and consequently is associated with grain yield (Ashfaq et al. 2012; Aditya and Bhartiya 2013; Ranawake et al. 2013). In this way, the mutagenic agent used promoted a significant increase in the main panicle length of some families (M3 331, M3 335, M3 332, M3 277, M3 217, M3 336 and M3 218), which may be correlated with an increased grain yield (Table 2).
As for the main panicle weight (Table 3), four families (M3 36, M3 34, M3 28 and M3 2) had mean values higher than the control (3.19 g) and only one family (M3 277) showed a lower mean. The other families exhibited the main panicle weight significantly similar to the control.
The main panicle weight directly and positively affects grain yield and is correlated with the number and weight of grains per panicle (Senapati et al. 2009; Abd Allah et al. 2010; Li et al. 2014), representing a desirable trait in rice breeding programs.
Families showing increased main panicle weight also presented a higher value of main panicle grain weigh than that of the control, suggesting that mutation interfered with the accumulation of photoassimilates (Tables 3, 4).
source of variation dF
Mean square
Pl PW PgW FlW PH
Genotypes 340 12.45* 1.41* 1.22* 0.07* 70.39*
Residual 1,023 3.97 0.54 0.45 0.03 26.62
Overall mean 24.97 3.20 2.89 1.73 85.16
CV (%) 7.98 22.98 23.33 9.62 6.05
table 1. Summary of the analysis of variance for the traits main panicle length, main panicle weight, main panicle grain weight,
flag leaf width and plant height of 340 M3 mutant families and control BRS Querência. Federal University of Pelotas, Pelotas (RS),
Brazil, 2015.
With regard to main panicle grains (Table 4), EMS caused an increase in the trait, with six mutant families exhibiting a better performance than the control. Whereas the control had a mean grain weight of 2.89 g, superior mutant families presented a mean value of 4.40 g. This result observed in these mutants can be related to a greater yield, since the grain mass is a major component of yield (Jeng et al. 2006; Song et al. 2007; Hasan et al. 2013; Karim et al. 2014). It is worth emphasizing that this increase in the main panicle grain weight will be relevant provided that there is no reduction in other components of grain yield.
Main panicle length
M3 families with mean values higher than that of the control brs Querência 331, 335, 332, 277, 217, 336 and 218
M3 families with mean values similar to that of the control brs Querência (24.72 cm)
196, 36, 242, 297, 33, 236, 88, 18, 30, 132, 339, 31, 17, 204, 176, 227, 34, 284, 317, 2, 75, 52, 185, 178, 189, 265, 3, 10, 55, 184, 149, 177, 243, 125, 37, 171, 206, 40, 271, 35, 179, 190, 47, 19, 43, 197, 209, 320, 289, 172, 153, 188, 258, 337, 65, 80, 15, 91, 49, 148, 173, 238, 298, 5, 95, 24, 195, 253, 9, 46, 262, 276, 302, 72, 180, 245, 257, 268, 270, 105, 175, 39, 45, 131, 205, 26, 29, 83, 186, 300, 25, 32, 340, 84, 230, 288, 76, 79, 27, 111, 237, 273, 13, 234, 12, 170, 48, 78, 203, 69, 110, 116, 121, 246, 81, 140, 161, 187, 194, 210, 308, 67, 202, 286, 303, 92, 255, 283, 324, 4, 1, 135, 280, 50, 53, 89, 99, 107, 146, 207, 259, 87, 137, 232, 315, 240, 290, 193, 23, 28, 183, 314, 38, 254, 313, 115, 130, 323, 102, 106, 154, 200, 291, 127, 198, 157, 159,
318, 223, 261, 11, 208, 156, 133, 338, 225, 98, 118, 147, 275, 7, 241, 136, 166, 287, 152, 163, 214, 70, 108, 22, 112, 215, 272, 212, 231, 249, 267, 295, 139, 244, 327, 16, 211, 305, 63, 150, 224, 256, 142, 333, 8, 20, 167, 292, 322, 328, 239, 278, 73, 174, 248, 122, 145, 134, 141, 155, 182, 307, 21, 126, 251, 334, 94, 269, 124, 168, 221, 281, 151, 57, 86, 120, 299, 316, 129, 164, 274, 226, 306, 310, 60, 143, 199, 93, 85, 90, 109, 144, 219, 233, 247, 266,
51, 128, 228, 279, 309, 62, 114, 330, 119, 162, 264, 165, 169, 77, 101, 263, 41, 64, 117, 220, 66, 235, 301, 68, 325, 54, 42, 191, 103, 104, 97, 181, 14, 285, 96, 282, 58, 319, 6, 293, 312, 229, 192, 294, 59, 71, 252, 158, 304, 296, 329, 123, 222, 74, 260, 326, 321, 216, 56, 201, 113, 44, 311, 138, 250,
160, 100, 61 and 82
M3 family with mean values lower than that of the control brs Querência 213
Main panicle weight
M3 families with mean values higher than that of the control brs Querência 36, 34, 28 and 2
M3 families with mean values similar to that of the control brs Querência (3.19 g)
17, 16, 30, 1, 236, 29, 33, 3, 219, 40, 206, 339, 18, 38, 15, 19, 9, 31, 176, 227, 22, 27, 37, 132, 25, 43, 52, 48, 197, 12, 35, 203, 214, 205, 196, 13, 223, 26, 55, 239, 177, 189, 149, 4, 187, 64, 230, 204, 21, 11, 237, 50, 179, 262, 45, 286, 147, 51, 148, 340, 209, 153, 75, 46, 232, 10, 7, 23, 280, 215, 111, 265, 140, 89, 8, 62, 253, 300, 24, 212, 298, 150, 255, 163, 240, 185, 194, 172, 173, 313, 107, 238, 268, 207, 125, 188, 210, 32, 234, 102, 131, 41, 66, 5, 47, 99, 159, 155, 166, 195, 291, 54, 167, 92, 108, 135, 49, 137, 76, 157, 20, 175, 290, 251, 283, 338, 88, 220, 243, 199, 228, 245, 126, 161, 164, 152, 94, 226, 14, 193, 323, 67, 136, 42, 320, 6, 184, 57, 257, 273, 242, 105, 73, 330, 146, 198, 247, 289, 337, 178, 224, 254, 292, 304, 241, 65, 270, 144, 83, 112, 77, 314, 312, 264, 208, 39, 70, 284, 235, 181, 287, 288, 336, 174, 170, 72, 271, 295, 310, 333, 143, 127, 130, 53, 261, 95, 186, 315, 221, 103, 154, 118, 334, 180, 211, 256, 183, 246, 171, 302, 128, 139, 59, 202, 114, 63, 82, 200, 307, 267, 58, 133, 165, 116, 134, 158, 263, 104, 156, 106, 324, 101, 233, 80, 142, 282, 145, 168, 169, 269, 331, 301, 97, 91, 121, 109, 325, 192, 141, 303, 276, 87, 299, 297, 151, 317, 318, 68, 190, 119, 138, 258, 319, 93, 69, 309, 249, 296, 162, 90, 182, 306, 160, 275, 244, 122, 329, 98, 252, 124, 84, 279, 293, 308, 110, 294, 225, 229, 327, 129, 222, 248, 113, 60, 120, 85, 79, 328, 217, 335, 71, 115, 322, 201, 316, 231, 266, 272, 326, 332, 216, 218, 321, 56, 285, 250, 305, 100, 78, 44, 281, 191, 123, 74, 278, 274, 117,
96, 86, 61, 311, 81, 259, 260 and 213
M3 family with mean values lower than that of the control brs Querência 277
table 2. Distribution of 340 M3 mutant families in relation to the control BRS Querência for the main panicle length. Federal University of Pelotas, Pelotas (RS), Brazil, 2015.
table 3. Distribution of 340 M3 mutant families in relation to the control BRS Querência for the main panicle weight. Federal University of Pelotas, Pelotas (RS), Brazil, 2015.
For the trait flag leaf width (Table 5), the chemical agent used had a negative influence, since three families had lower mean values than that of the control, and the other families had mean values significantly similar to that of the control (1.67 cm). Morphological characteristics of leaves along with chlorophyll levels affect the leaf photosynthetic efficiency and directly influence the yield of rice grains (Zhang et al. 2009). The flag leaf width is correlated with grain yield in rice (Agahi et al. 2007; Aditya and Bhartiya 2013).
Main panicle grain weight
M3 families with mean values higher than that of the control brs Querência 36, 34, 2, 28, 30 and 17
M3 families with mean values similar to that of the control brs Querência (2.89 g)
1, 16, 236, 29, 206, 33, 339, 3, 18, 40, 38, 9, 15, 19, 197, 22, 176, 31, 205, 25, 43, 214, 37, 27, 232, 227, 132, 48, 223, 52, 203, 12, 289, 13, 237, 26, 196, 64, 51, 177, 239, 230, 21, 189, 55, 340, 45, 4, 11, 148, 179, 35, 187, 286, 147, 204, 209, 50, 153, 46, 215, 262, 265, 149, 10, 280, 253, 140, 75, 111, 212, 23, 300, 62, 240, 210, 8, 298, 207, 163, 185, 172, 194, 255, 313, 107, 188, 150, 234, 24, 173, 66, 152, 242, 245, 32, 268, 125, 5, 159, 291, 54, 41,
243, 167, 102, 238, 166, 251, 338, 99, 126, 7, 47, 199, 290, 226, 157, 135, 220, 175, 228, 155, 20, 42, 137, 164, 108, 161, 195, 76, 283, 219, 49, 67, 14, 323, 136, 184, 92, 94, 57, 73, 247, 105, 88, 198, 337, 273, 304, 292, 146, 257, 330, 193, 224, 320, 6, 241, 131, 178, 181, 144, 235, 211, 208, 65, 336, 312, 112, 77, 83, 264, 270, 89, 70, 288, 174, 287, 72, 271, 333, 53, 63, 127, 170, 284, 314, 334, 130, 103, 310, 246, 221, 118, 295, 143, 154, 261, 39, 128, 95, 183, 186, 315, 114, 180, 256, 58, 202, 59, 158, 139, 200, 307, 324, 82, 233, 267, 254, 106, 101, 142, 133, 331, 165, 303, 134, 263, 282, 116, 145, 301, 171, 156, 266, 302, 98, 168, 309, 80, 109, 192, 269, 151, 121, 252, 141, 325, 169, 249, 319, 68, 138, 87, 318, 299, 276, 69, 119, 162, 91, 296,
90, 244, 306, 182, 104, 93, 122, 329, 258, 275, 248, 190, 160, 225, 113, 293, 297, 229, 317, 308, 222, 217, 124, 129, 84, 85, 294, 327, 335, 120, 97, 328, 279, 201, 332, 110, 115, 79, 218, 71, 272, 316, 60, 321, 322, 231, 250, 56, 216, 326, 285, 100, 305, 281, 123, 44, 191, 74, 78, 117, 278, 96, 274,
61, 86, 311, 213, 259, 260, 277 and 81
M3 family with mean values lower than that of the control brs Querência No family had a mean value lower than the control
Flag leaf width
No family had a mean value higher than the control
M3 families with mean values similar to that of the control brs Querência (1.67 cm)
46, 86, 93, 112, 9, 89, 139, 183, 129, 130, 196, 280, 17, 30, 47, 52, 79, 88, 102, 133, 178, 190, 236, 45, 48, 53, 58, 80, 91, 92, 105, 115, 122, 125, 137, 174, 177, 184, 185, 187, 336, 15, 29, 36, 64, 83, 87, 101, 103, 109, 111, 119, 168, 189, 206, 221, 227, 238, 245, 254, 313, 10, 25, 34, 39, 54, 66, 114, 124, 127, 132, 172, 180, 186, 195, 224, 260, 271, 16, 27, 28, 40, 43, 55, 82, 85, 94, 95, 98, 107, 108, 120, 141, 148, 149, 166, 203, 230, 243, 297, 1, 18,
22, 31, 35, 37, 42, 49, 50, 65, 69, 77, 99, 104, 126, 134, 146, 173, 179, 182, 202, 255, 262, 263, 298, 2, 12, 21, 26, 62, 68, 78, 84, 121, 123, 135, 152, 163, 171, 175, 228, 265, 270, 286, 287, 290, 295, 268, 3, 5, 8, 19, 23, 24, 41, 97, 110, 117, 118, 142, 144, 145, 161, 169, 170, 176, 194, 208, 209, 223, 226, 233, 246, 251, 256, 267, 274, 281, 315, 317, 7, 11, 32, 33, 38, 57, 59, 71, 72, 106, 131, 136, 138, 153, 165, 188, 214, 215, 237, 249, 258, 261, 273, 276, 288, 300, 305, 308, 314, 4, 20, 56, 113, 116, 156, 159, 200, 204, 205, 219, 235, 275, 277, 291, 306, 67, 70, 90, 96, 100, 150, 157, 167, 232, 244, 252, 283, 284, 285, 296, 302, 304, 310, 318, 324, 326, 73, 81, 147, 154, 162, 211, 241, 250, 259, 301, 307, 312, 338, 76, 128, 151, 155, 191, 197, 198, 199, 201, 218, 239, 240, 247, 266, 269, 279, 292, 293, 320, 322, 325, 60, 63, 207, 220, 222, 229, 231, 248, 257, 303, 311, 319, 330, 337, 6, 13, 61, 140,
158, 289, 294, 299, 323, 340, 14, 75, 164, 192, 193, 212, 282, 335, 216, 217, 234, 242, 316, 328, 332, 339, 210, 264, 331, 253, 272, 278, 333, 334, 321, 327, 309, 51, 181, 329, 74, 160 and 225
M3 family with mean values lower than that of the control brs Querência 213, 44 and 143
table 4. Distribution of 340 M3 mutant families in relation to the control BRS Querência for the main panicle grain weight. Federal University of Pelotas, Pelotas (RS), Brazil, 2015.
table 5. Distribution of 340 M3 mutant families in relation to the control BRS Querência for the flag leaf width. Federal University of Pelotas, Pelotas (RS), Brazil, 2015.
(76.25 cm), considered a semidwarf genotype. No family showed a lower mean value, and the other families had mean height significantly equal to that presented by the control. Our results suggest that possibly the mutagen promoted changes in alleles that confer short height, causing this increase. The SD1-Semidwarf1 gene, isolated from semidwarf rice, has shown to be related to gibberellin biosynthesis (Monna et al. 2002; Sasaki et al. 2002), which is a key hormone for controlling plant height. It should be noted that the mutation sd1 is considered recessive (Ashikari et al. 2002).
Comparing the results for the five traits evaluated in the study, plant height was the most affected by the
mutagen EMS, with a higher number of families (52.05%) differing from the control BRS Querência (Table 6).
According to results obtained by Martins et al. (2005), the induction of ionizing mutation was effective in reducing plant height in rice genotypes. The use of EMS, at a dose of 0.04 M, in different rice mutant generations leads to an increment of the trait plant height (Siddiqui and Singh 2010).
and other traits should also be considered, such as stem thickness. It should be emphasized that taller plants have the benefit of reducing the amount and quality of weeds (Balbinot Junior et al. 2003).
Many factors influence the induced mutation rate, such as concentration of mutagen, mutagen exposure time, washing time, types of organs treated (seed or pollen) and species or genotype chosen. Seed structure may vary from species to species, which can influence the efficacy of the mutagenic agent. For example, in paddy rice, the chemical product used must penetrate the husk first and then interact with the embryo, inducing mutation (Xin et al. 2008).
The cluster analysis by Tocher’s method (Table 7) revealed the formation of seven groups. The first one grouped most families of mutants together with the control BRS Querência; the second group was composed of five families (M3 331, M3 332, M3 335, M3 217 and M3 277); the third one grouped three families (M3 44, M3 143 and M3 160); the fourth (M3 218 and M3 336) and fifth (M3 89 and M3 219) groups were formed by two families each, while the sixth and seventh groups had one family each (M3 213 and M3 289, respectively).
Regarding the relative contribution of each trait to the genetic dissimilarity among mutant families (Table 8), the 340 families evaluated as well as the control presented, in descending order of contribution, the traits: main panicle length, main panicle grain weight, flag leaf width, plant height and main panicle weight. Among
them, the traits main panicle length, main panicle grain weight and flag leaf width contributed with 69.49% to genetic dissimilarity, though the traits plant height and main panicle weight contributed with only 30.51%.
The trait that contributed most to the genetic dissimilarity was the main panicle length (31.07%), with values ranging from 36.07 cm (M3 331 family) to 18.62 cm (M3 213 family). The second most important variable for genetic dissimilarity was the main panicle grain weight (19.31%), with values ranging from 4.58 g (M3 36 family) to 1.67 g (M3 81 family).
The variances (eigenvalues), percentage variances and cumulative variances of canonical variables are presented in Table 9. As the estimates of eigenvalues, corresponding to the first three canonical variables, obtained 80.41% of the total variance of the analyzed traits, it was possible to explain satisfactorily the variability among the evaluated mutant families and represent them in a three-dimensional scatter plot (Figure 1).
The graphic dispersion indicated the distinction of mutant families into groups and can be used as a strategy to select different families to be used in artificial crosses in breeding programs. The groups formed by the graphic dispersion of scores (Figure 1) followed the same trend of the groups obtained by the Tocher’s optimization method (Table 7), with the exception of group III (Tocher), which was not separated by the canonical variable analysis, appearing clustered with genotypes from group I.
Plant height
M3 families with mean values higher than that of the control brs Querência
33, 9, 36, 43, 26, 39, 47, 25, 48, 23, 17, 19, 46, 230, 11, 15, 29, 20, 37, 31, 40, 22, 45, 2, 5, 16, 52, 212, 223, 3, 24, 42, 84, 196, 12, 21, 34, 53, 66, 6, 7, 28, 262, 1, 8, 145, 18, 115, 41, 13, 178, 179, 4, 162, 204, 207, 222, 236, 60, 118, 205, 92, 202, 291, 259, 56, 215, 30, 287, 298, 283, 35, 38, 243, 177, 313, 10, 14, 51, 234, 255, 256, 307, 129, 188, 227, 297, 320, 143, 182, 140, 147, 271, 295, 104, 149, 172, 221, 245, 246, 263, 267, 272, 150, 315, 27, 32,
50, 132, 168, 218, 268, 301, 304, 314, 161 and 192
M3 families with mean values similar to that of the control brs Querência (76.25 cm)
49, 185, 276, 299, 206, 261, 77, 187, 233, 316, 336, 281, 112, 241, 332, 70, 197, 122, 79, 183, 186, 214, 251, 266, 289, 300, 308, 311, 75, 91, 144, 148, 101, 105, 146, 253, 254, 280, 98, 158, 173, 238, 265, 194, 99, 114, 166, 176, 198, 136, 171, 330, 108, 124, 189, 235, 55, 191, 200, 226, 237, 264, 328, 152, 102, 107, 155, 224, 78, 103, 121, 228, 65, 81, 89, 100, 126, 248, 324, 193, 270, 305, 338, 151, 184, 275, 303, 310, 317, 63, 180, 76, 110, 113, 117, 244, 257, 258, 292, 294, 82, 83, 74, 95, 109, 142, 163, 286, 64, 116, 203, 240, 260, 273, 93, 111, 153, 54, 170, 174, 285, 309, 339, 125, 190,
239, 44, 130, 208, 269, 71, 169, 86, 73, 302, 326, 331, 229, 128, 225, 319, 325, 164, 159, 219, 157, 199, 220, 85, 139, 209, 247, 249, 284, 321, 131, 175, 61, 68, 282, 323, 327, 58, 127, 57, 217, 288, 87, 80, 154, 242, 277, 290, 306, 329, 201, 232, 322, 120, 278, 69, 279, 141, 312, 340, 106, 137, 94, 134, 59, 135, 318, 333, 97, 119, 165, 334, 195, 293, 72, 138, 216, 211, 252, 296, 337, 210, 62, 90, 167, 133, 96, 67, 156, 250, 274, 231, 335, 88, 181,
160, 123 and 213
M3 family with mean values lower than that of the control brs Querência No family had a mean value lower than the control
The similar result obtained by the canonical variable analysis strengthens the reliability of the data obtained
by To che r’s cluste r i ng te ch n i qu e ( B e n ite z e t a l. 2011).
table 7. Grouping of 340 M3 mutant families and the variety BRS Querência by Tocher’s method based on the Mahalanobis distance, considering
traits evaluated in M3 families. Federal University of Pelotas, Pelotas (RS), Brazil, 2015.
groups Families
1
333 334 323 164 282 247 73 292 128 199 220 240 157 338 159
198 76 155 330 310 325 319 241 269 136 70 151 229 154 57
312 273 208 194 235 300 63 32 257 193 153 161 200 150 144
163 99 268 226 251 283 142 261 170 173 188 146 314 244 324
291 169 306 107 228 290 175 166 288 249 126 108 286 255 233
270 49 301 315 295 267 116 275 256 307 246 298 287 224 148
65 68 77 165 172 118 265 248 106 294 71 293 279 285 121
238 135 59 152 134 127 209 50 263 114 318 111 158 179 10
95 83 55 303 299 186 105 313 237 141 180 90 94 296 174
189 109 85 113 201 202 182 221 326 102 101 103 124 145 24
168 185 243 262 149 125 271 177 98 308 120 245 320 5 215
92 187 304 162 276 191 8 4 252 322 72 184 305 69 302
54 137 280 122 130 87 132 204 110 117 258 171 281 192 211
119 195 227 147 207 176 41 104 203 140 58 53 27 328 35
183 167 264 12 45 20 18 52 178 112 156 131 139 222 42
31 230 37 91 316 66 138 284 234 56 100 21 60 97 216
14 205 3 206 67 80 40 11 214 239 197 337 23 38 13
75 223 62 6 15 236 19 340 250 321 254 96 309 129 311
7 84 212 327 61 64 253 78 93 272 26 47 46 79 115
133 25 48 22 190 29 329 30 231 317 266 260 43 196 39
210 278 274 74 82 17 33 2 232 1 339 225 9 81 34
123 297 259 86 242 51 181 36 16 28 88 341 (BRS Querência)
2 331 332 335 217 277
3 44 143 160
4 218 336
5 89 219
6 213
7 289
Variable s.j s.j value (%)
Main panicle length 129,199.84 31.07
Main panicle grain weight 80,291.68 19.31
Flag leaf width 79,454.55 19.11
Plant heigth 72,708.77 17.49
Main panicle weight 54,141.17 13.02
table 8. Estimates of the relative contribution of each trait for genetic divergence between rice mutant families, based on the partitioning of total D2. Federal University of Pelotas, Pelotas (RS), Brazil, 2015.
cOnclUsiOn
The mutation induction by EMS, at 1.5%, is capable of generating mutants with superior traits. Of a total of 340 families, for the trait main panicle length, seven families (2.06%) presented mean values higher than that of the control, as to the traits main panicle weight and main panicle grain weight, there were observed four (1.18 %) and six (1.76%) mutant families, respectively, with better performance than that of the control.
table 9. Variances (eigenvalues), percentage variances and cumulative variances of canonical variables, aiming to estimate the dissimilarity among rice mutant families. Federal University of Pelotas, Pelotas (RS), Brazil, 2015.
canonical variables Variances (eigenvalues) Percentage variances cumulative variances
1 1.51 42.11 42.11
2 0.73 20.32 62.43
3 0.64 17.97 80.41
4 0.42 11.78 92.19
5 0.28 7.81 100.00
Figure 1. Scatter plot of scores of 340 M3 mutant families and the control BRS Querência along the first three canonical axes (CV1, CV2 and CV3). Federal University of Pelotas, Pelotas (RS), Brazil, 2015. Group II Group IV VC3 VC1 VC2 Group VII Grupo I Group VI Group V Group III –5 –3 –1 1 3 –2 –4 –6 –8 10 12 10 12 14 16 18 3 1 –1 –3 –5
–12 –10 –8
–6 –4 –2 18 16 14
12 10
Among the traits, plant height was the most affected by the mutagenic agent, which provided the increase in the trait.
There is genetic dissimilarity among rice families, and the traits contributing most to it are the main panicle length, main panicle grain weight and flag leaf width.
AcKnOWledgeMents
The authors thank the National Council for Scientific and Technological Development (CNPq), Coordination for the Improvement of Higher Education Personnel (CAPES) and Rio grande do Sul Research Foundation (FAPERgS) for financial support and scholarships granted.
reFerences
Abd Allah, A. A., Ammar, M. H. and Badawi, A. T. (2010). Screening
rice genotypes for drought resistance in Egypt. Journal of Plant
Breeding and Crop Science, 2, 205-215.
Aditya, J. P. and Bhartiya, A. (2013). Genetic variability, correlation
and path analysis for quantitative characters in rainfed upland rice
of Uttarakhand Hills. Journal of Rice Research, 6, 24-34.
Agahi, K., Fotokian, M. and Farshadfar, E. (2007). Correlation
and path coefficient analysis for some yield-related traits in rice
genotypes (Oryza sativa L.). Asian Journal of Plant Sciences, 6,
513-517. http://dx.doi.org/10.3923/ajps.2007.513.517.
Ashfaq, M., Khan, A. S., Khan, S. H. U. and Ahmad, R. (2012).
Association of various morphological traits with yield and genetic
divergence in rice (Oryza sativa). International Journal of Agriculture
Ashikari, M., Sasaki, A., Ueguchi-Tanaka, M., Itoh, H., Nishimura,
A., Swapan, D., Ishiyama, K., Saito, T., Kobayashi, M., Khush, G.
S., Kitano, H. and Matsuoka, M. (2002). Loss-of-function of a rice
gibberellin biosynthetic gene, GA20 oxidase (GA20ox-2), led to
the rice “Green Revolution”. Breeding Science, 52, 143-150. http://
dx.doi.org/10.1270/jsbbs.52.143.
Balbinot Junior, A. A., Fleck, N. G., Menezes, V. G. and Agostinetto, D.
(2003). Competitividade de cultivares de arroz irrigado com cultivar
simuladora de arroz-vermelho. Pesquisa Agropecuária Brasileira,
38, 53-59. http://dx.doi.org/10.1590/S0100-204X2003000100007.
Benitez, L. C., Rodrigues, I. C. S., Arge, L. W. P., Ribeiro, M. V. and
Revista Ciência Agronômica, 42, 409-416. http://dx.doi.org/10.1590/ S1806-66902011000200021.
Coimbra, J. L. M., Carvalho, F. I. F., Oliveira, A. C., Silva, J. A. G. and
Lorencetti, C. (2005). Comparação entre mutagênicos químico
e físico em populações de aveia. Ciência Rural, 35, 12-18. http://
dx.doi.org/10.1590/S0103-84782005000100008.
Coimbra, J. L. M., Marchioro, V. S., Lorencetti, C., Azevedo, R.,
Carvalho, F. I. F. and Oliveira, A. C. (1999). Comparação dos efeitos
de agentes mutagênicos na geração M1 em genótipos fixos de
aveia (Avena sativa L.). Revista Brasileira de Agrociência, 5, 12-18.
Cruz, C. D. (2001). Programa genes: aplicativo computacional em
genética e estatística. Viçosa: UFV.
Cruz, C. D. and Regazzi, A. J. (1997). Divergência genética. In C. D. Cruz
e A. J. Regazzi. Métodos biométricos aplicados ao melhoramento
genético (p. 287-324). Viçosa: Imprensa Universitária.
Harland, J. R. (1975). Crops and man. Madison: American Society
of Agronomy.
Hasan, M. J., Kulsum, M. U., Akter, A., Masuduzzaman, A. S. M. and
Ramesha, M. S. (2013). Genetic variability and character association
for agronomic traits in hybrid rice (Oryza sativa L.).Bangladesh
Journal of Plant Breeding and Genetics, 24, 45-51. http://dx.doi.
org/10.3329/bjpbg.v24i1.16999.
Henikoff, S. and Comai, L. (2003). Single-nucleotide mutations
for plant functional genomics. Annual Review of Plant Biology,
54, 375-401.
Ishiy, T., Schiocchet, M. S., Bacha, R. E., Alfonso-Morel, D., Tulman,
A. N. and Knoblauch, R. (2006). Rice mutant cultivar SCS114
andosan. Plant Mutation Reports, 2, 25.
Jalata, Z., Ayana, A. and Zeleke, H. (2011). Variability, heritability and
genetic advance for some yield and yield related traits in Ethiopian
barley (Hordeum vulgare L.) landraces and crosses. International
Journal of Plant Breeding and Genetics,5, 44-52. http://dx.doi.
org/10.3923/ijpbg.2011.44.52.
Jeng, T. L., Tseng, T. H., Wang, C. S., Chen, C. L. and Sung, J. M.
(2006). Yield and grain uniformity in contrasting rice genotypes
suitable for different growth environments. Field Crops Research,
99, 59-66. http://dx.doi.org/10.1016/j.fcr.2006.03.005.
Jennings, P. R., Coffman, W. R. and Kauffman, H. E. (1981).
Mejoramiento de arroz. Cali: Centro Internacional de Agricultura
Tropical.
Jiang, S. Y. and Ramachandran, S. (2010). Natural and artificial
mutants as valuable resources for functional genomics and
molecular breeding. International Journal of Biological Sciences,
6, 228-251. http://dx.doi.org/10.7150/ijbs.6.228.
Karim, D., Siddique, N. E. A., Sarkar, U., Hasnat, Z. and Sultana,
J. (2014). Phenotypic and genotypic correlation co-efficient of
quantitative characters and character association of aromatic
rice. Journal of Bioscience and Agriculture Research, 1, 34-46.
Li, G., Zhang, J., Yang, C., Song, Y., Zheng, C., Wang, S., Liu, Z.
and Ding, Y. (2014). Optimal yield-related attributes of irrigated
rice for high yield potential based on path analysis and stability
analysis. The Crop Journal, 2, 235-243. http://dx.doi.org/10.1016/j.
cj.2014.03.006.
Maluszynski, M., Ahoowalia, B., Ashri, A., Nichterlein, K. and Van
Zanten, L. (1998). Induced mutations in rice breeding and germplasm
enhancement. Proceedings of the 19th Session of the International
Rice Commission; Cairo, Egypt.
Martins, A. F., Vieira, E. A., Kopp, M. M., Luz, V. K., Carvalho, M. F.,
Branco, J. S. C., Cruz, R. P., Carvalho, F. I. F. and Oliveira, A. C. (2007).
Caracterização de famílias mutantes de arroz para tolerância ao
frio nos períodos vegetativo e reprodutivo. Bragantia, 66, 227-233.
http://dx.doi.org/10.1590/S0006-87052007000200006.
Martins, A. F., Zimmer, P. D., Oliveira, A. C., Carvalho, F. I. F., Vieira,
E. A., Carvalho, M. F., Martins, L. F. and Fonseca, F. S. (2005).
Variabilidade para caracteres morfológicos em mutantes de arroz.
Ciência e Agrotecnologia, 29, 1215-1223. http://dx.doi.org/10.1590/
S1413-70542005000600016.
Monna, L., Kitazawa, N., Yoshino, R., Suzuki, J., Masuda, H., Maehara,
Y., Tanji, M., Sato, M., Nasu, S. and Minobe, Y. (2002). Positional
cloning of rice semidwarfing gene. sd-1: rice “green revolution
gene” encodes a mutant enzyme involved in gibberellin synthesis.
DNA Research, 9, 11-17.
Ni, H., Moody, K., Robles, R. P., Paller, E. C. and Lales, J. S. (2000).
Oryza sativa plant traits conferring competitive ability against
weeds. Weed Science, 48, 200-204.
Predieri, S. (2001). Mutation induction and tissue culture in improving
fruits.Plant Cell, Tissue and Organ Culture, 64, 185-210.
Ranawake, A. L., Amarasingha, U. G. S. and Dahanayake, N. (2013).
Agronomic characters of some traditional rice (Oryza sativa L.)
cultivars in Sri Lanka. Journal of the University of Ruhuna, 1, 3-9.
Rao, R. C. (1952). Advanced statistical methods in biometric
research. New York: John Wiley and Sons.
Sasaki, A., Ashikari, M., Ueguchi-Tanaka, M., Itoh, H., Nishimura,
A., Swapan, D., Ishiyama, K., Saito, T., Kobayashi, M., Khush, G. S.,
Kitano, H. and Matsuoka, M. (2002). Green revolution: a mutant
gibberellin-synthesis gene in rice – new insight into the rice variant
that helped to avert famine over thirty years ago. Nature, 416,
701-702. http://dx.doi.org/10.1038/416701a.
Schiocchet, M. A., Noldin, J. A., Raimondi, J. V., Neto, A. T.,
Marschalek, R., Wickert, E., Martins, G. N., Hicke, E., Knoblauch,
R., Scheuermann, K. K., Eberhardt, D. S. and Andrade, A. (2014).
SCS118 Marques - new rice cultivar obtained through induced
mutation. Crop Breeding and Applied Biotechnology, 14, 68-70.
http://dx.doi.org/10.1590/S1984-70332014000100012.
Senapati, B. K., Roy, S., De D. K. and Pal, S. (2009). Selection criteria
for high yield in early segregating generation of rice (Oryza sativa L.)
crosses. Journal of Crop and Weed, 5, 12-14.
Serrat, X., Esteban, R., Guibourt, N., Moysset, L., Nogués, S. and
Lalanne, E. (2014). EMS mutagenesis in mature seed-derived rice calli
as a new method for rapidly obtaining TILLING mutant populations.
Plant Methods, 10, 1-14. http://dx.doi.org/10. 1186/ 1746-4811-10-5.
Siddiqui, S. A. and Singh, S. (2010). Induced genetic variability for
yield and yield traits in basmati rice. World Journal of Agricultural
Sciences, 6, 331-337.
Singh, D. (1981). The relative importance of characters affecting
genetic divergence. Indian Journal of Genetic Plant Breeding,
41, 237-245.
Sociedade Sul Brasileira de Arroz Irrigado (2012). Arroz irrigado:
recomendações técnicas da pesquisa para o Sul do Brasil. Itajaí: SOSBAI.
Song, X. J., Huang, W., Shi, M., Zhu, M. Z. and Lin, H. X. (2007). A
QTL for rice grain width and weight encodes a previously unknown
RING-type E3 ubiquitin ligase. Nature Genetics, 39, 623-630. http://
dx.doi.org/10.1038/ng2014.
Talebi, A. B., Talebi, A. B. and Shahrokhifar, B. (2012). Ethyl methane
sulphonate (EMS) induced mutagenesis in malaysian rice (cv.
MR219) for lethal dose determination. American Journal of Plant
Sciences, 3, 1661-1665. http://dx.doi.org/10.4236/ajps.2012.312202.
The Statistics Division of the Food and Agriculture Organization of
the United Nations (2014); [accessed 2014 Jun 1]. http://faostat.
fao.org/#
Till, B. J., Cooper, J., Tai, T. H., Colowit, P., Greene, E. A., Henikoff,
S. and Comai, L. (2007). Discovery of chemically induced
mutations in rice by TILLING. BMC Plant Biology, 7, 19. http://
dx.doi.org/10.1186/1471-2229-7-19.
Wu, J. L., Wu, C., Lei, C., Baraoidan, M., Bordeos, A., Madamba,
M. R. S., Ramos-Pamplona, M., Mauleon, R., Portugal, A., Ulat, V.
J., Bruskiewich, R., Wang, G., Leach, J., Khush, G. and Leung, H.
(2005). Chemical- and irradiation-induced mutants of indica rice
IR64 for forward and reverse genetics. Plant Molecular Biology, 59,
85-97. http://dx.doi.org/10.1007/s11103-004-5112-0.
Xin, Z., Wang, M. L., Barkley, N. A., Burow, G., Franks, C., Pederson,
G. and Burke, J. (2008). Applying genotyping (TILLING) and
phenotyping analyses to elucidate gene function in a chemically
induced sorghum mutant population. BMC Plant Biology, 8, 1-14.
http://dx.doi.org/10.1186/1471-2229-8-103.
Zhang, G. H., Xu, Q., Zhu, X. D., Qian, Q. and Xue, H. W. (2009).
Shallot-Like1 is a Kanadi transcription factor that modulates rice
leaf rolling by regulating leaf abaxial cell development. Plant Cell,